

MCP Extras Free
Altcoin support hinges on BTC and ETH, and the fuel map leans upside
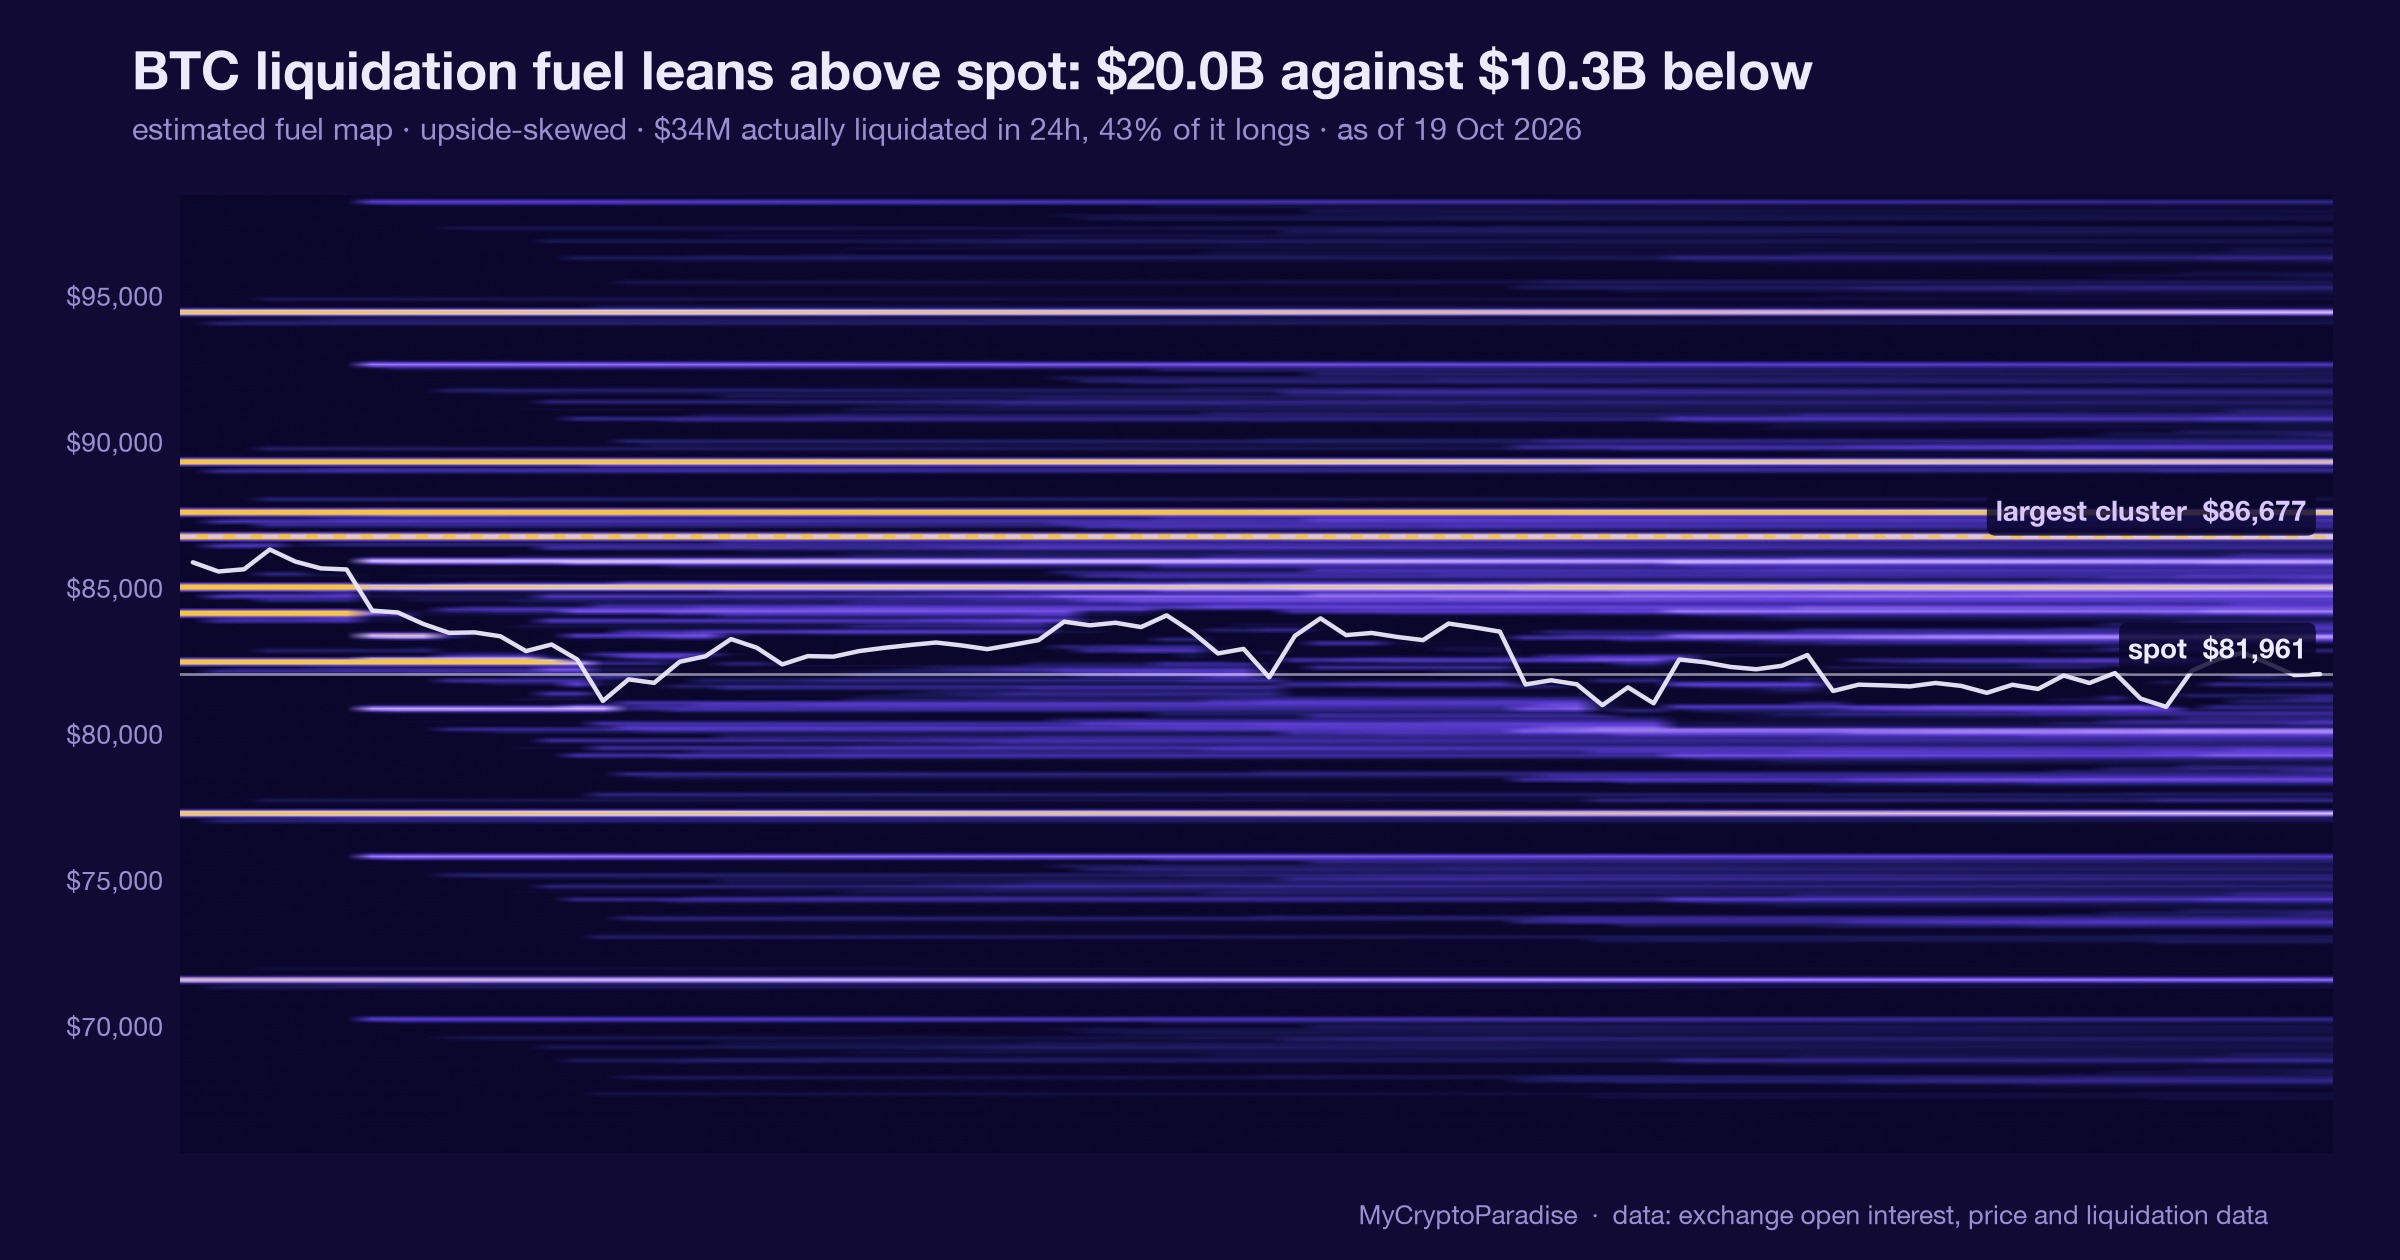
Our model reads BTC and ETH liquidation fuel skewed upside on 19 October 2026, the real test behind the altcoin support line.
Our model reads BTC and ETH liquidation fuel skewed upside on 19 October 2026, the real test behind the altcoin support line.
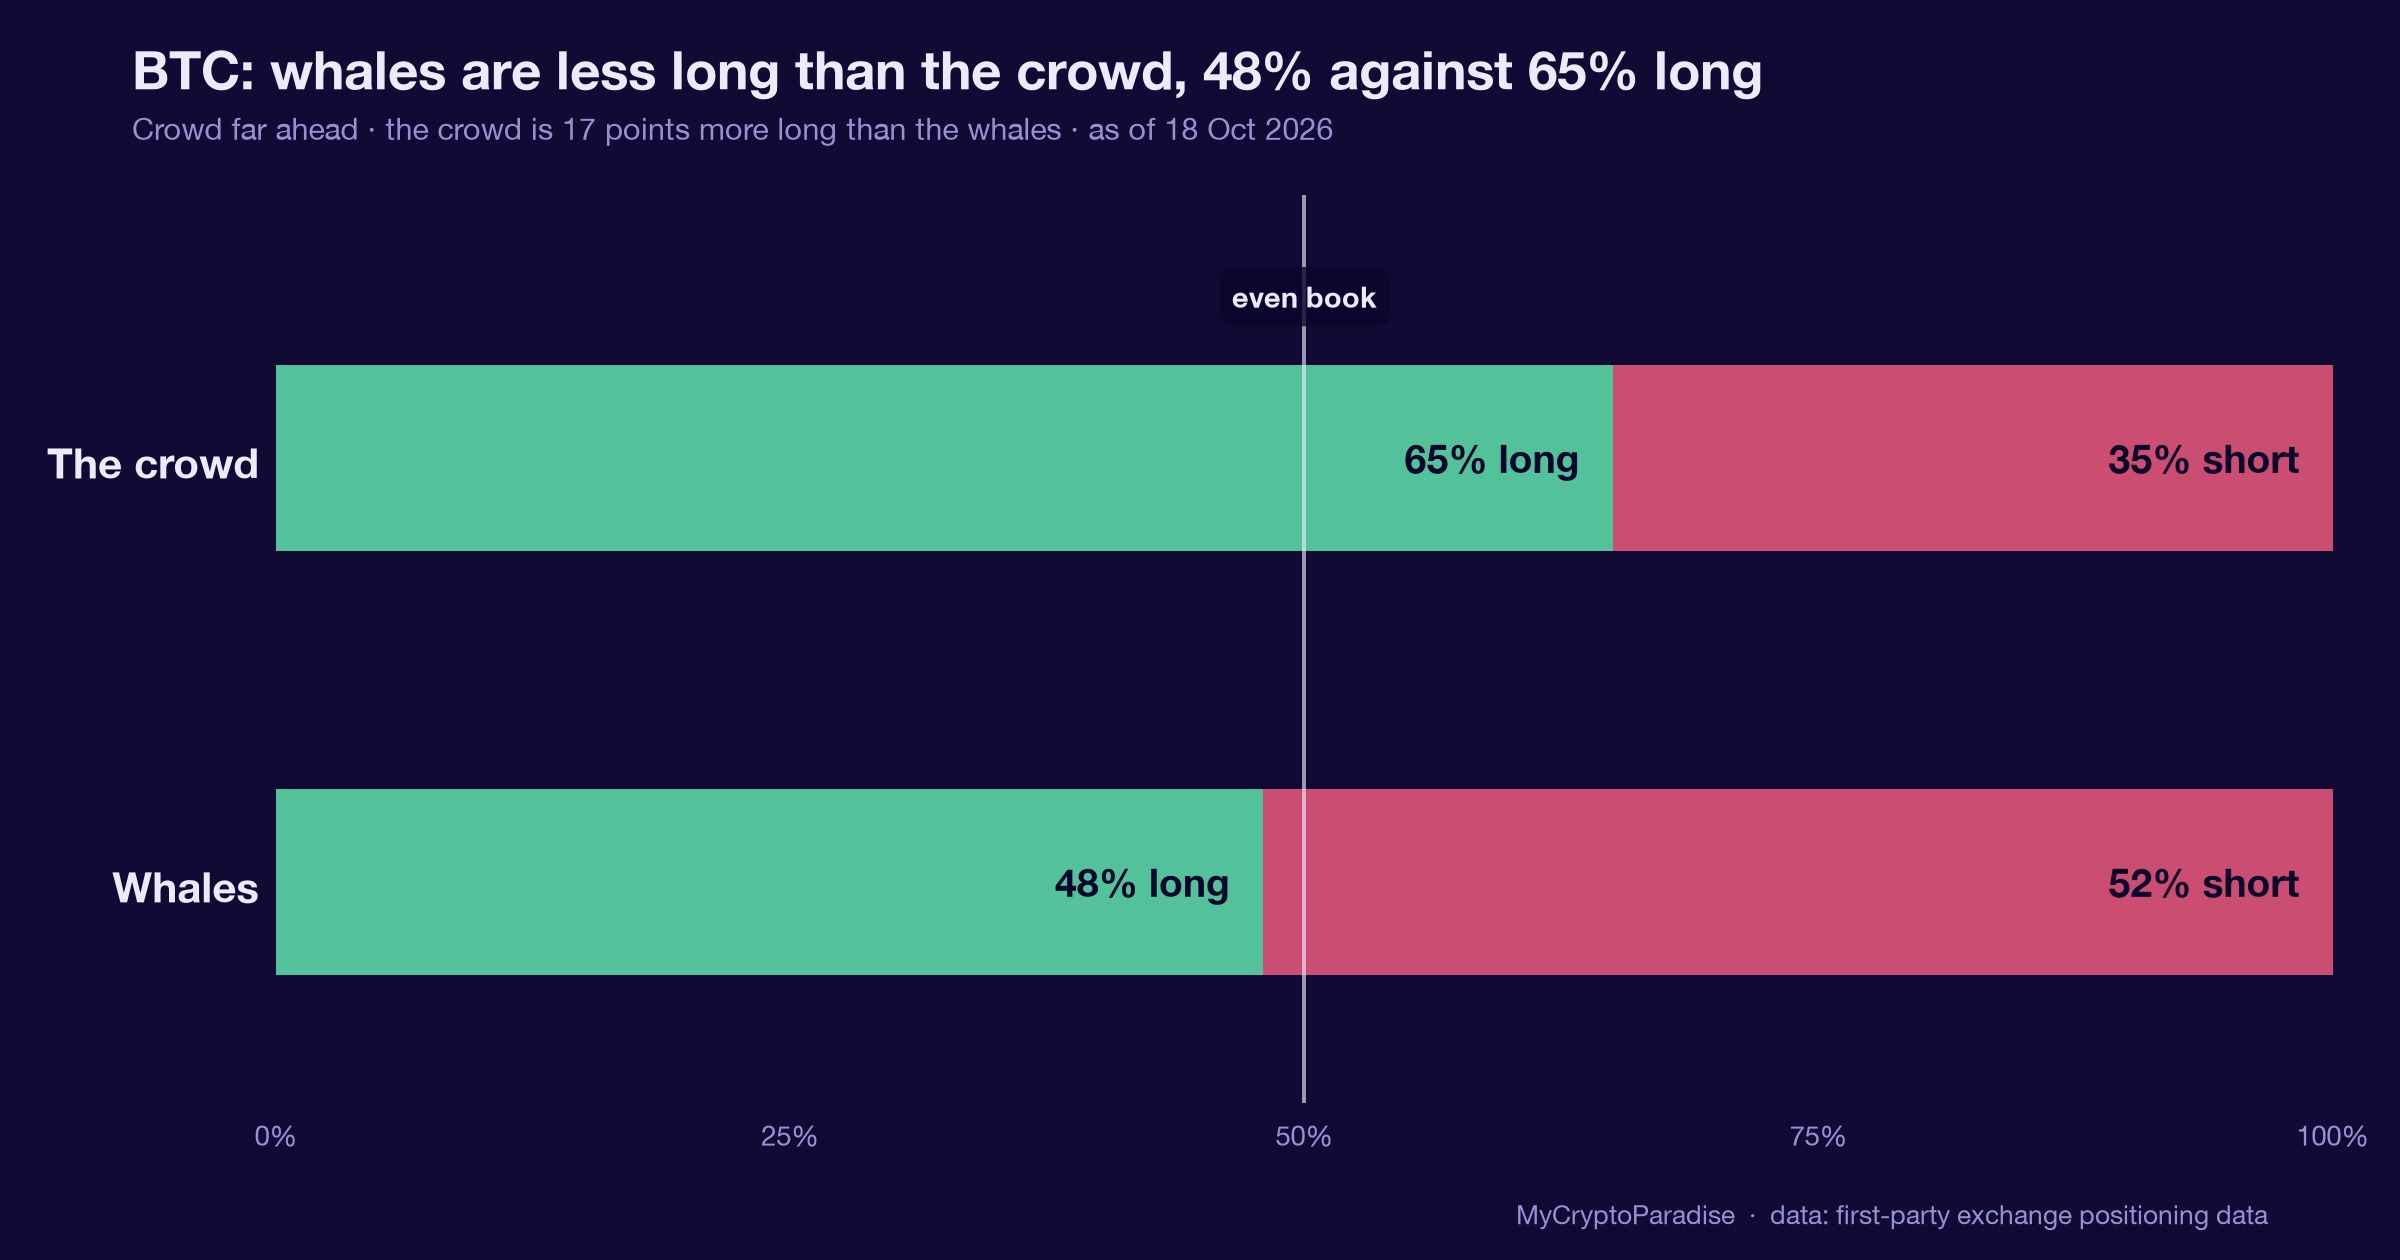
A whale reportedly opened a $110M BTC long at 40x, yet our radar netted minus $148M of selling that day. Here is how we read whale flow.
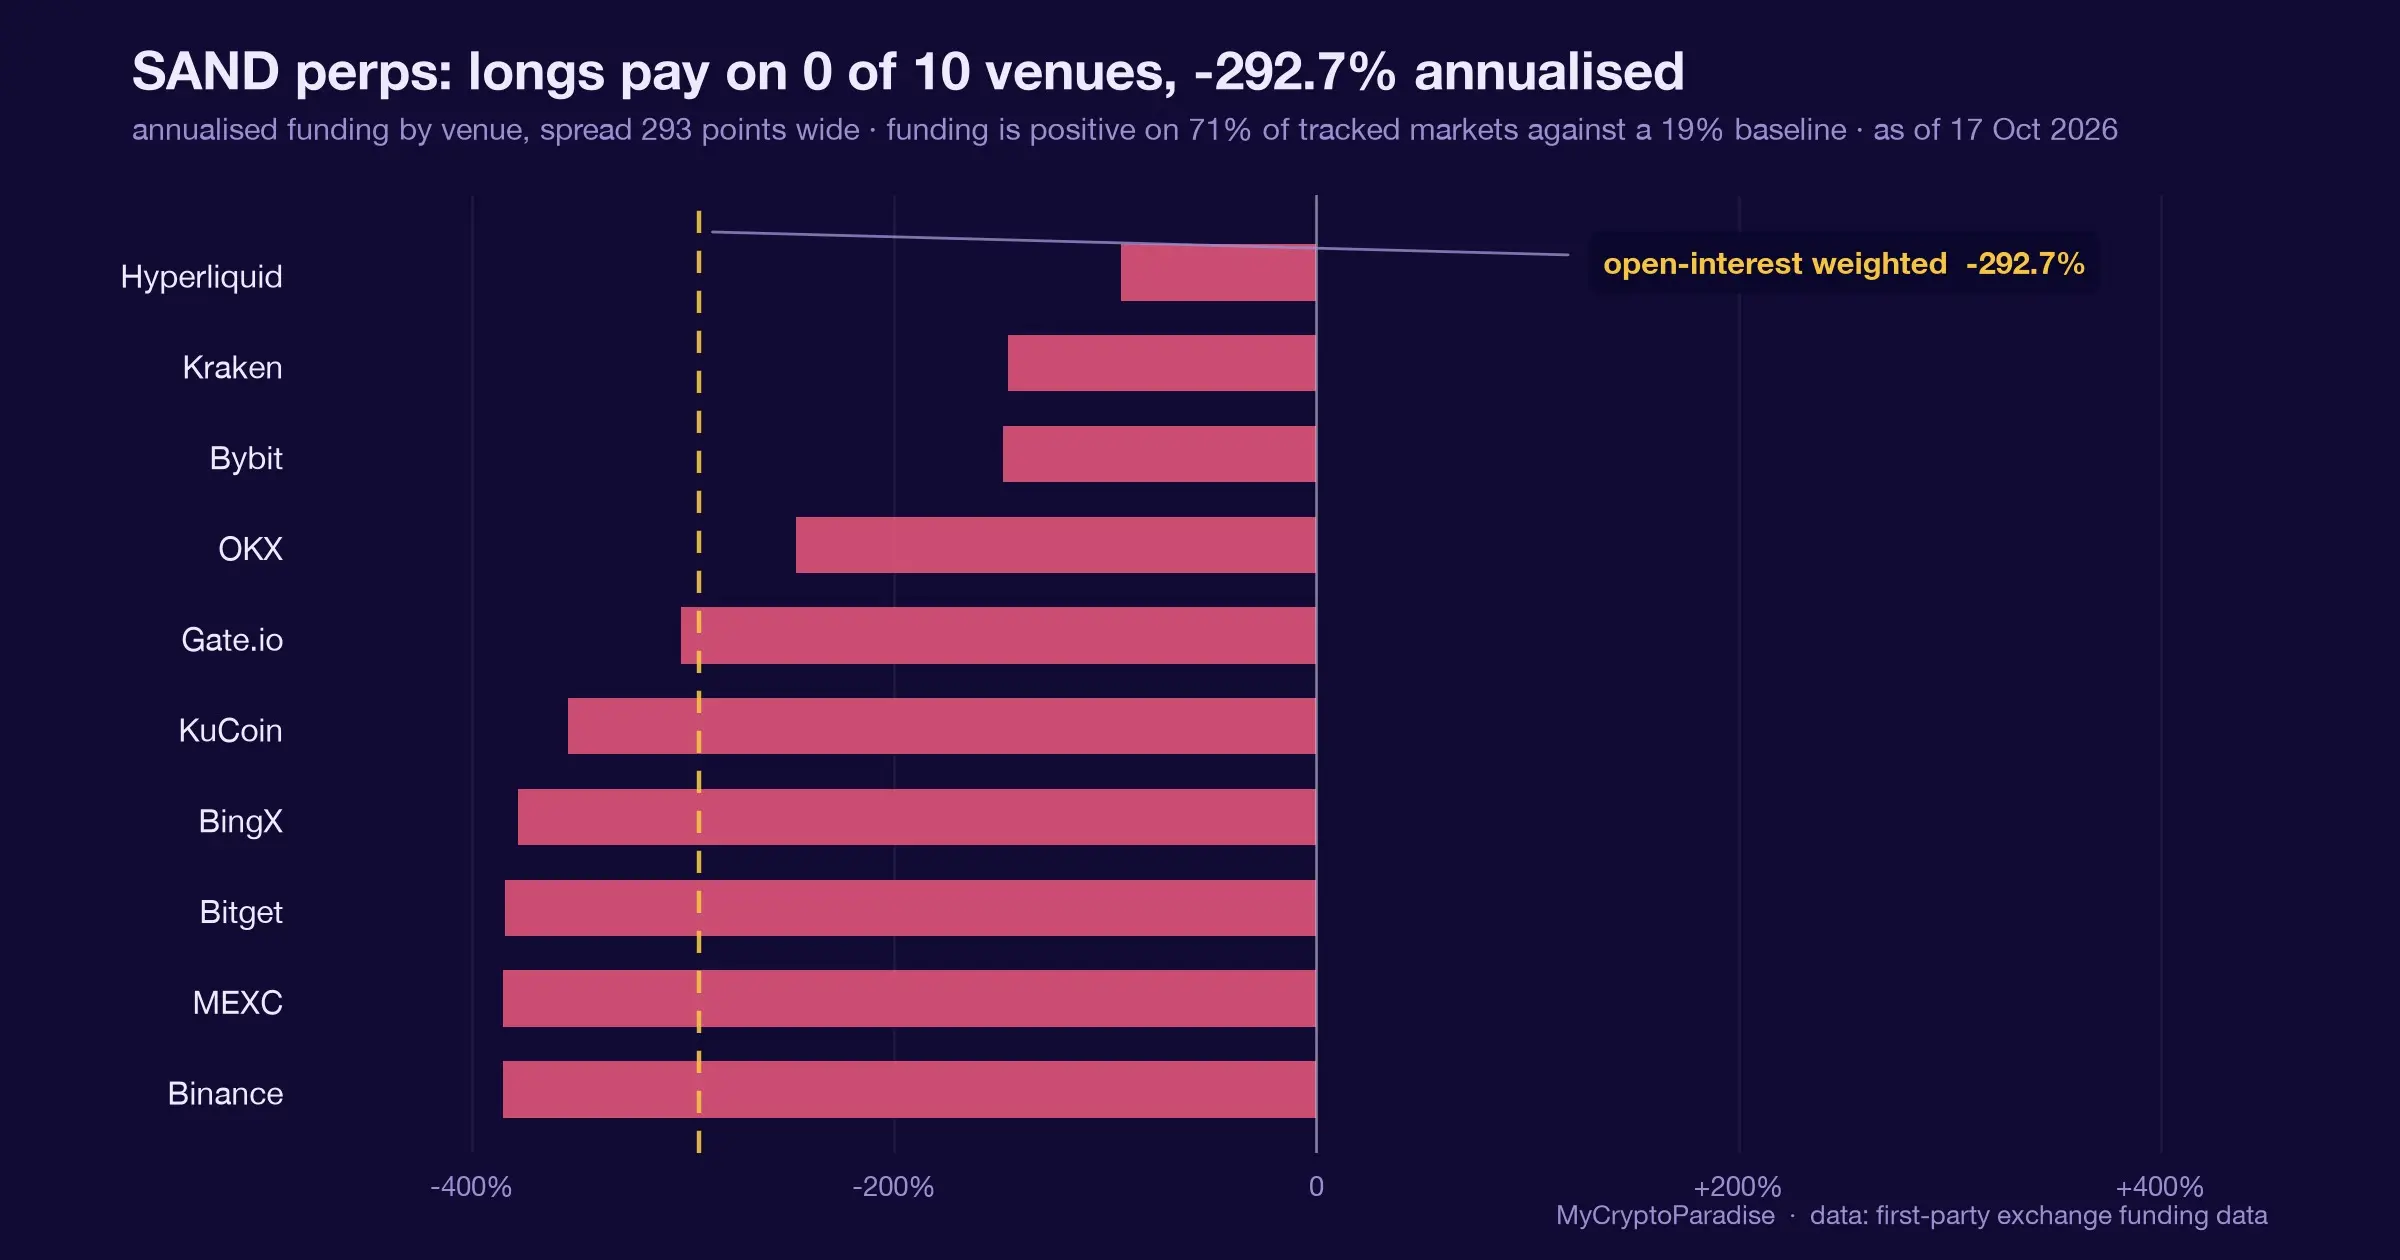
SAND shorts pay the most stretched funding on the tape at minus 292.7 percent, but the extreme is cooling. Here is how to read a funding extreme.
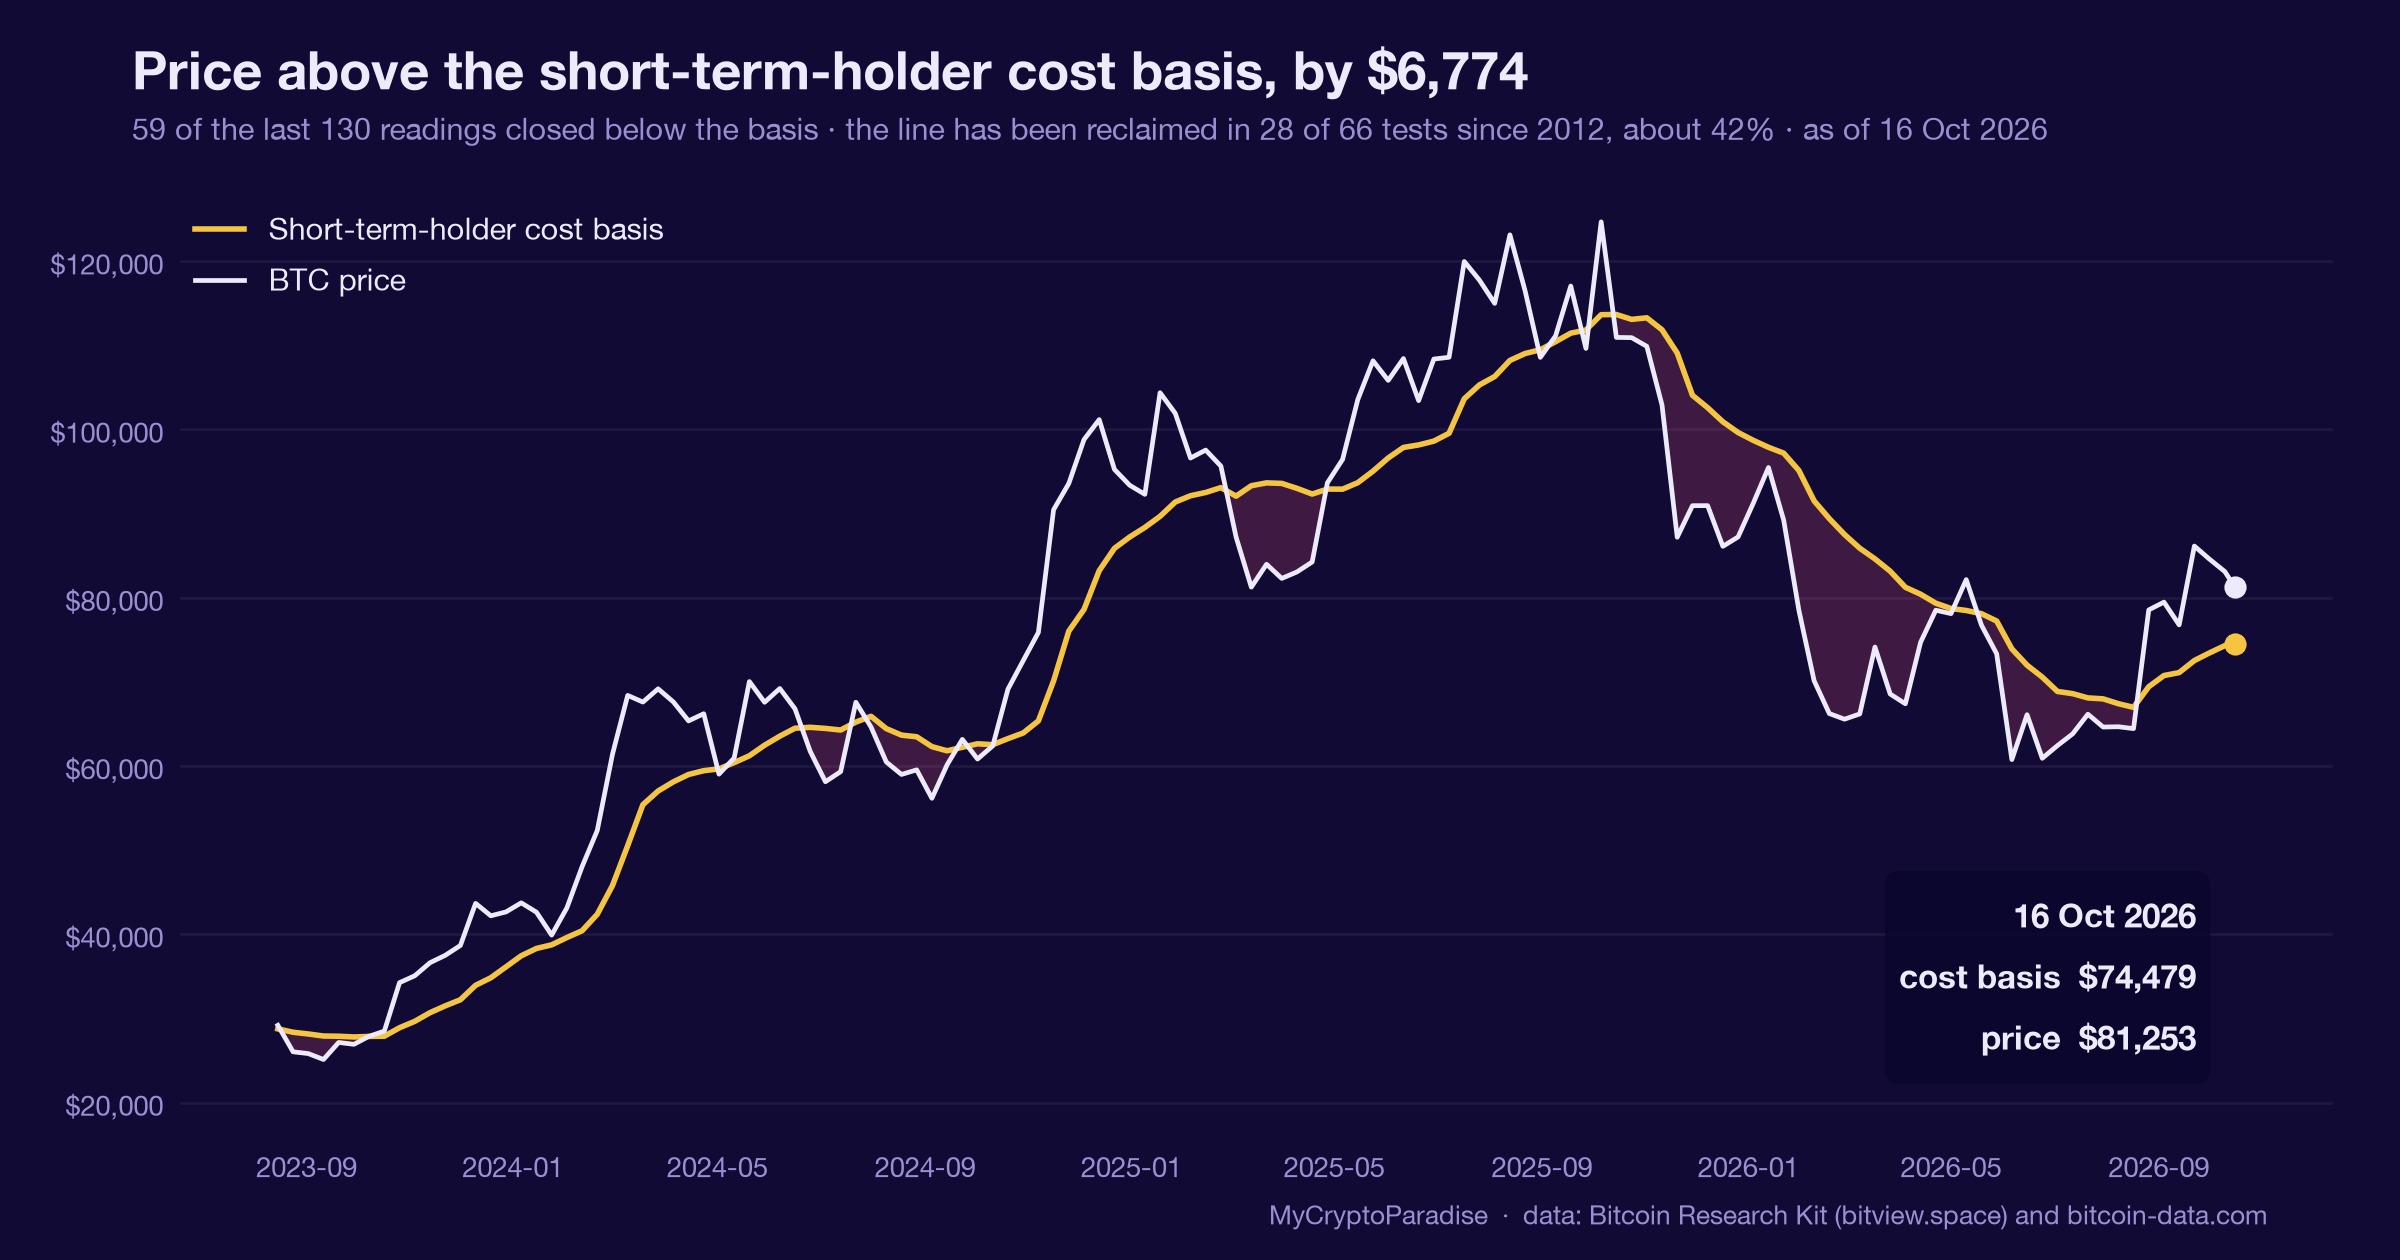
Bitcoin sits 51% above its realized price on 16 October 2026, but a third of recent buyers are underwater as the cushion thins.
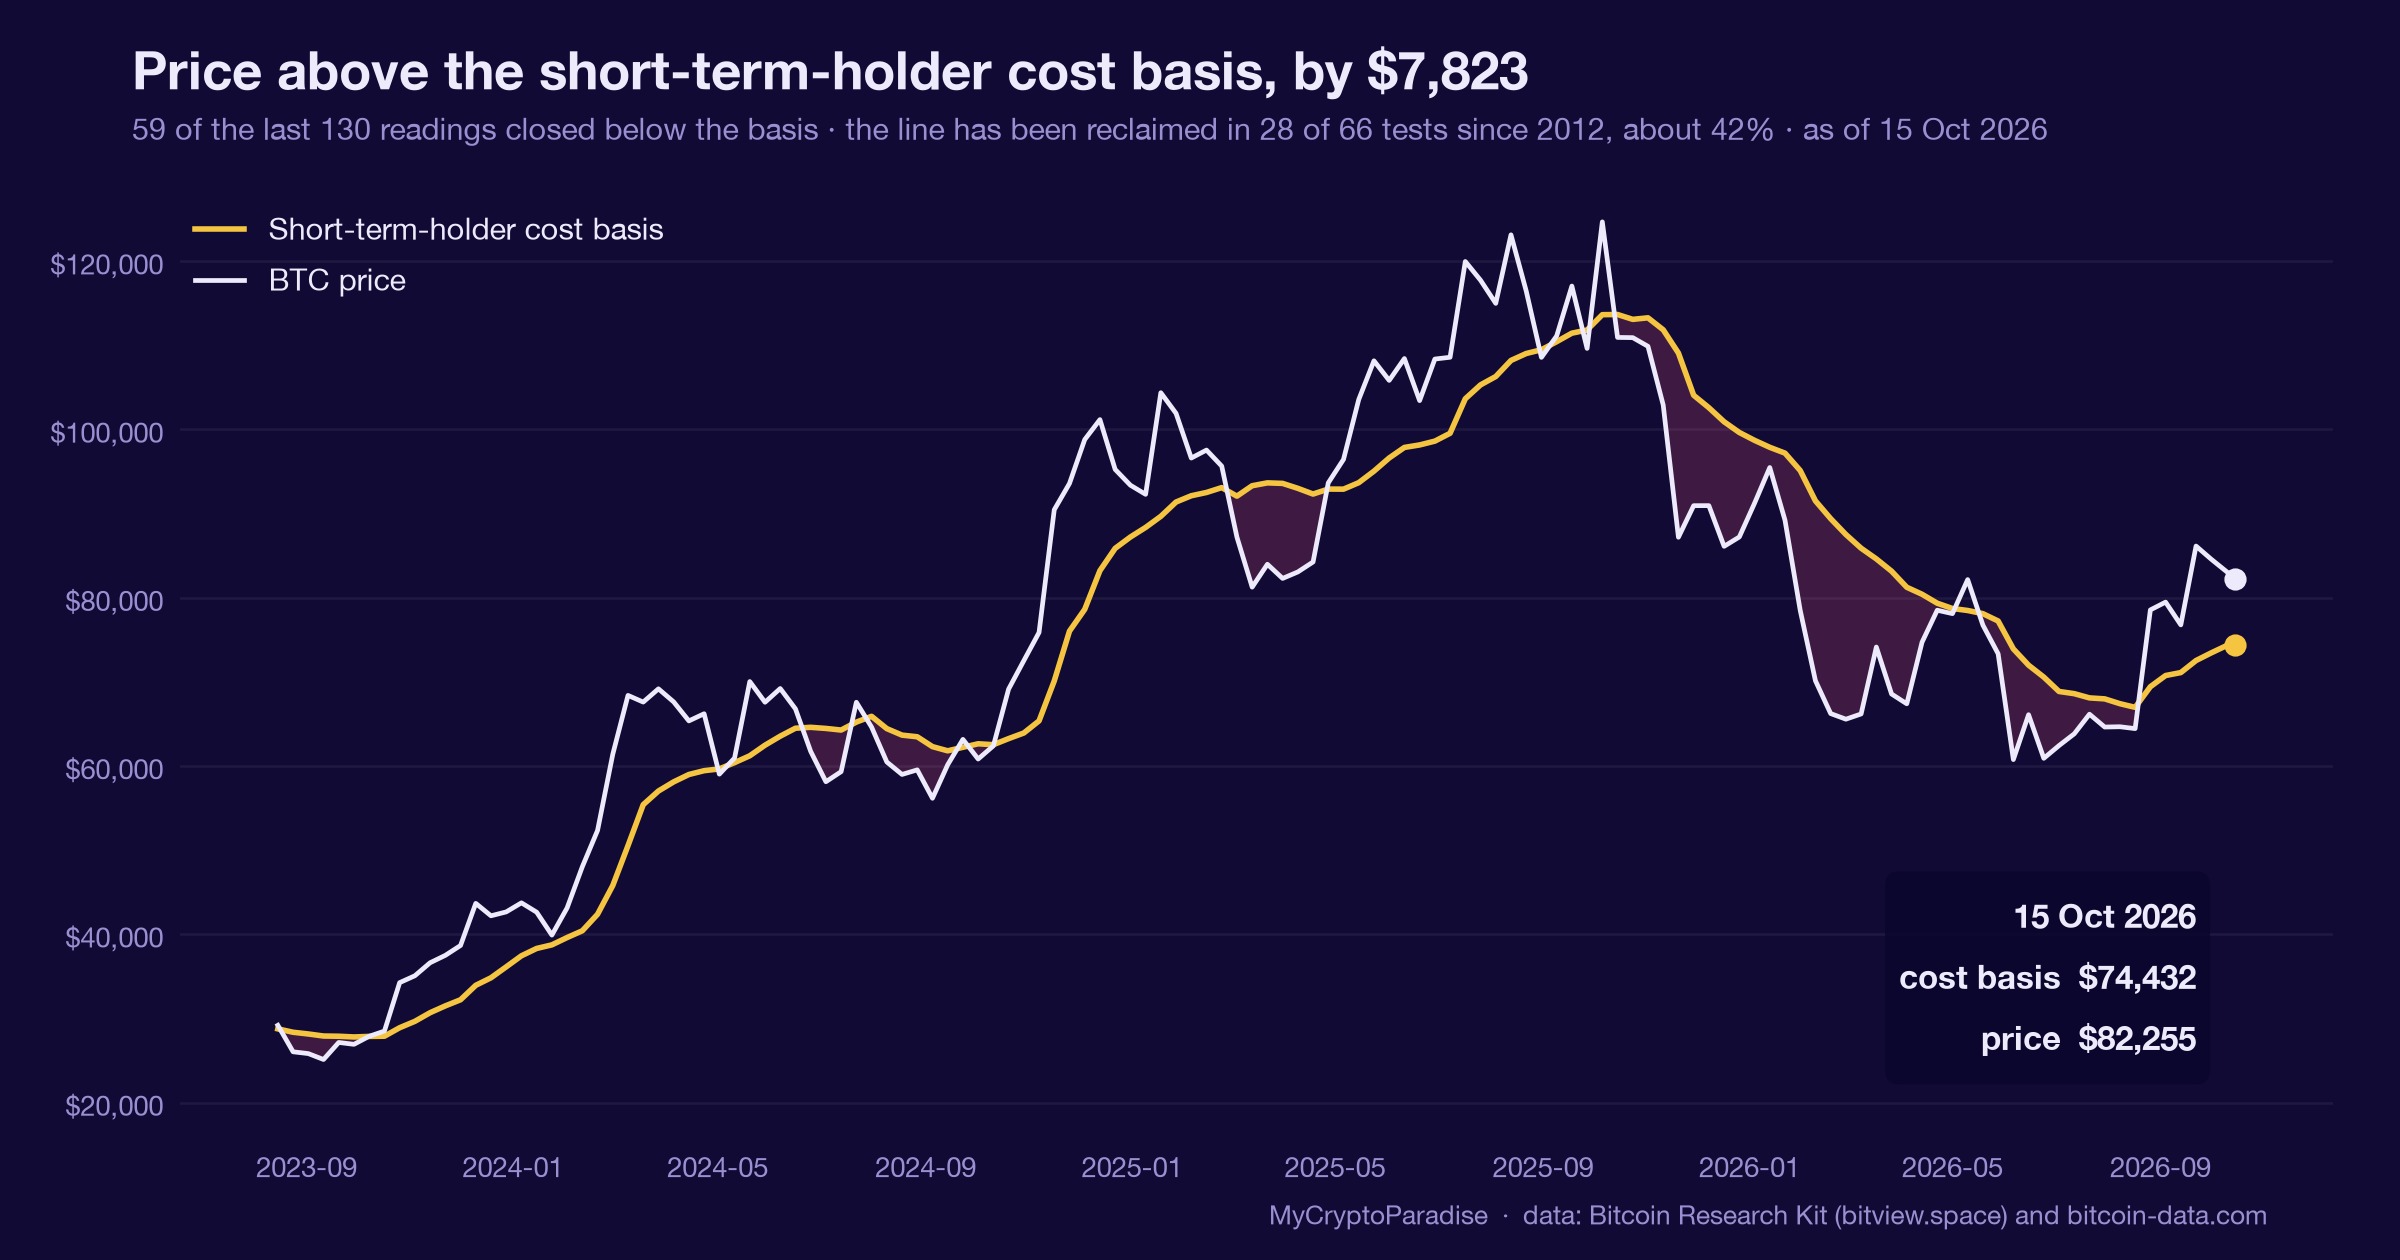
Bitcoin’s average coin is 53 percent above cost, yet a third of supply is underwater and long-term holders are moving coins at a loss.
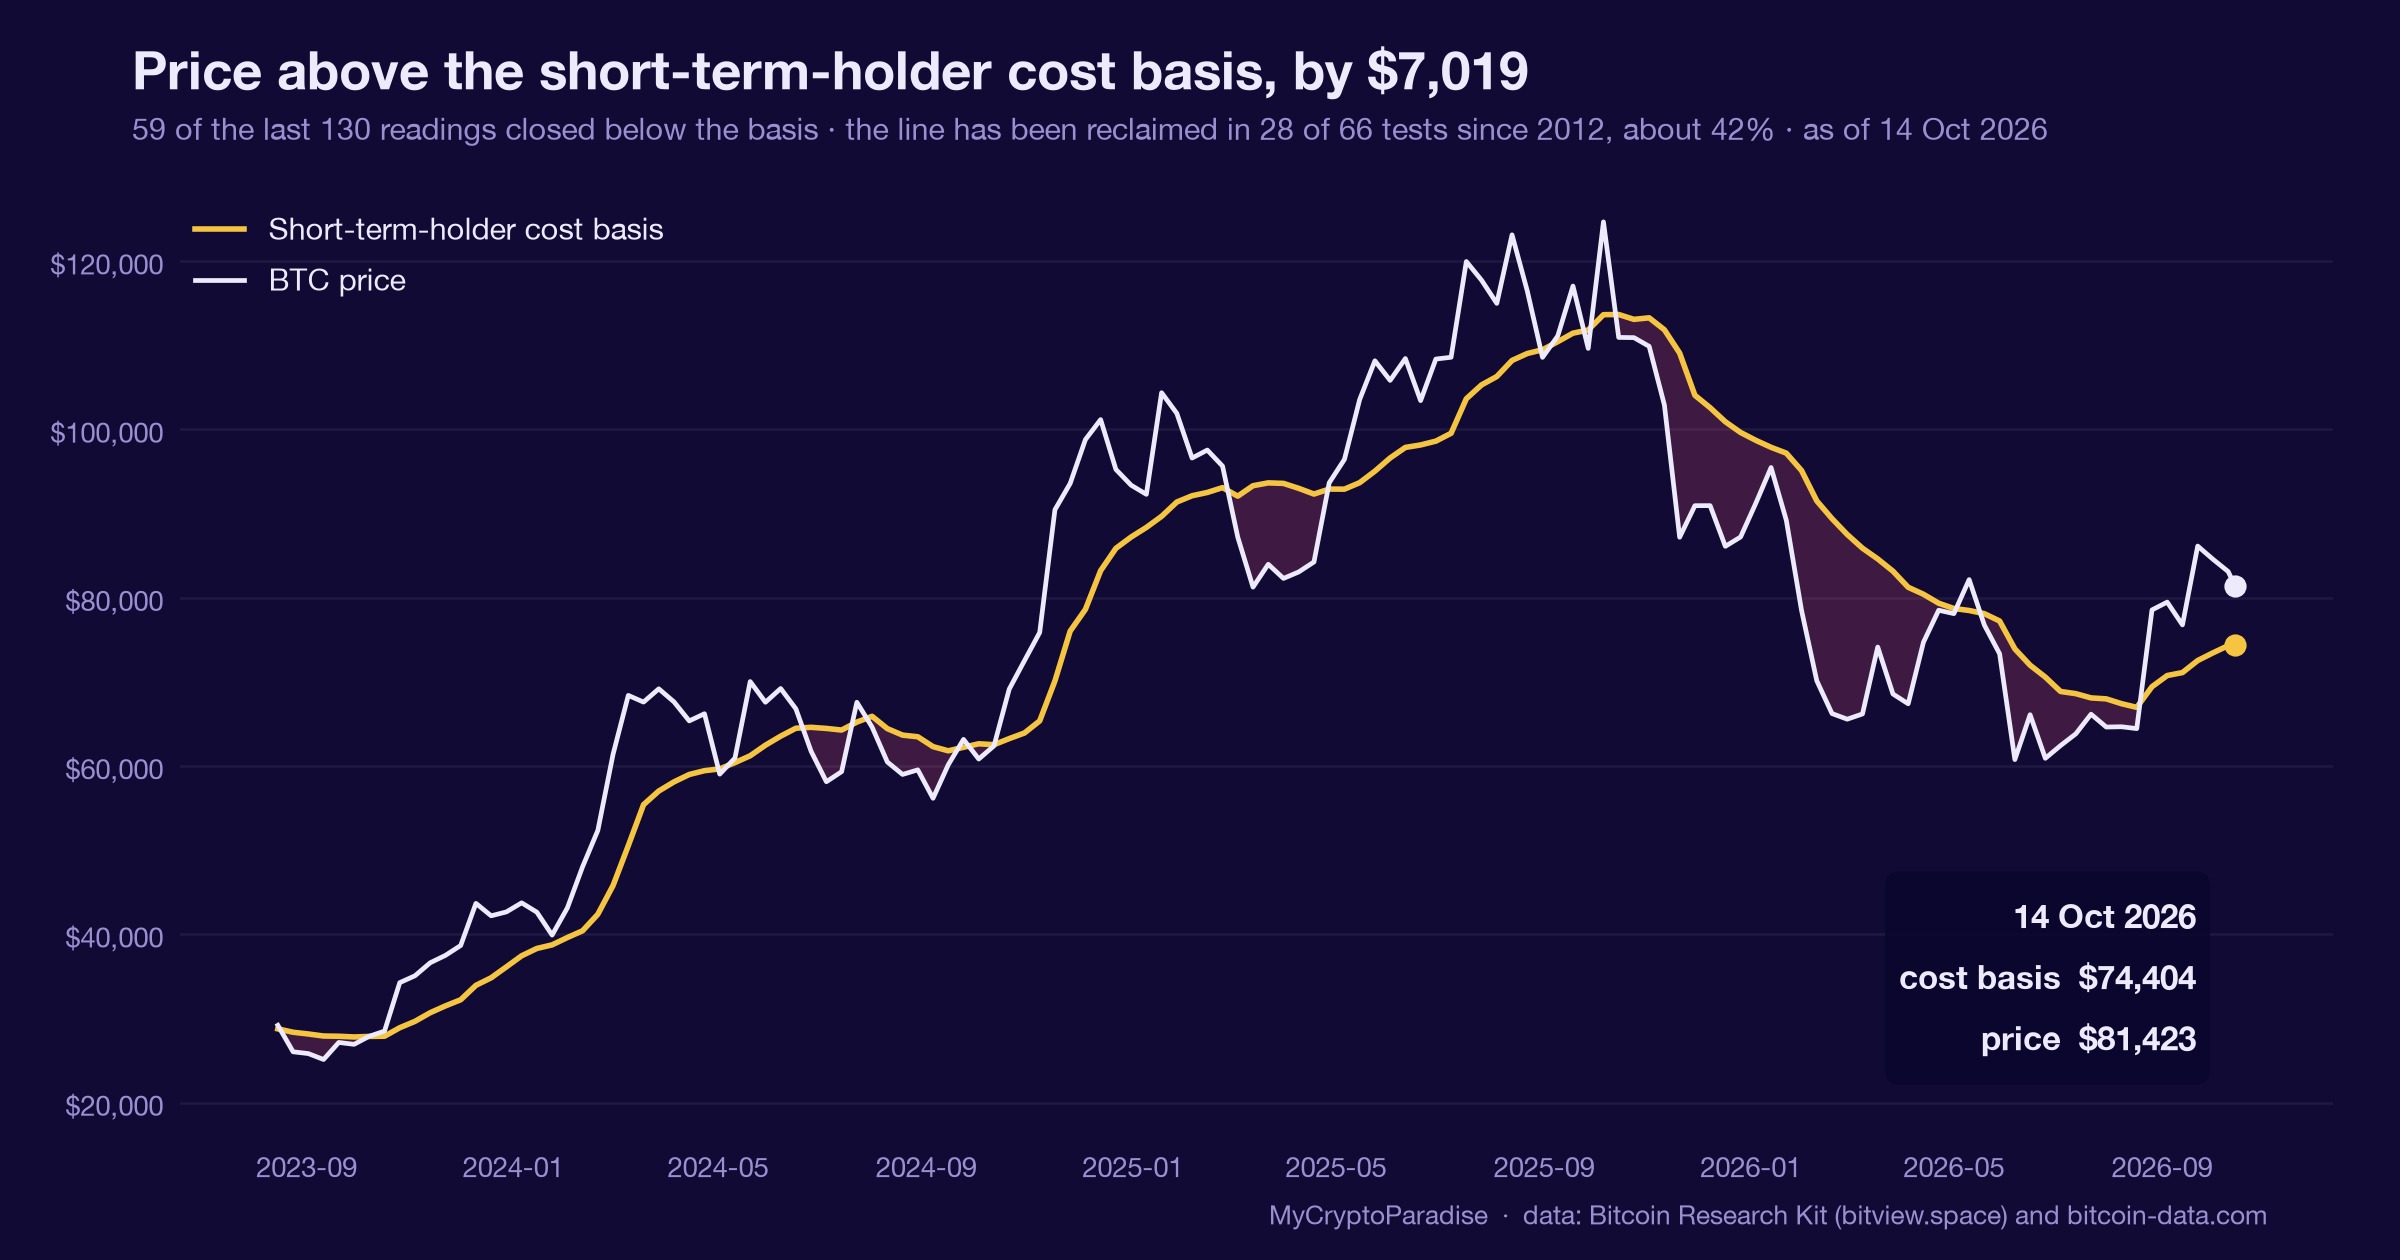
Bitcoin SOPR sits at 1.0007 on 14 October 2026, right on the breakeven line: we read the reset, the cohorts, and the level that ends the lean.
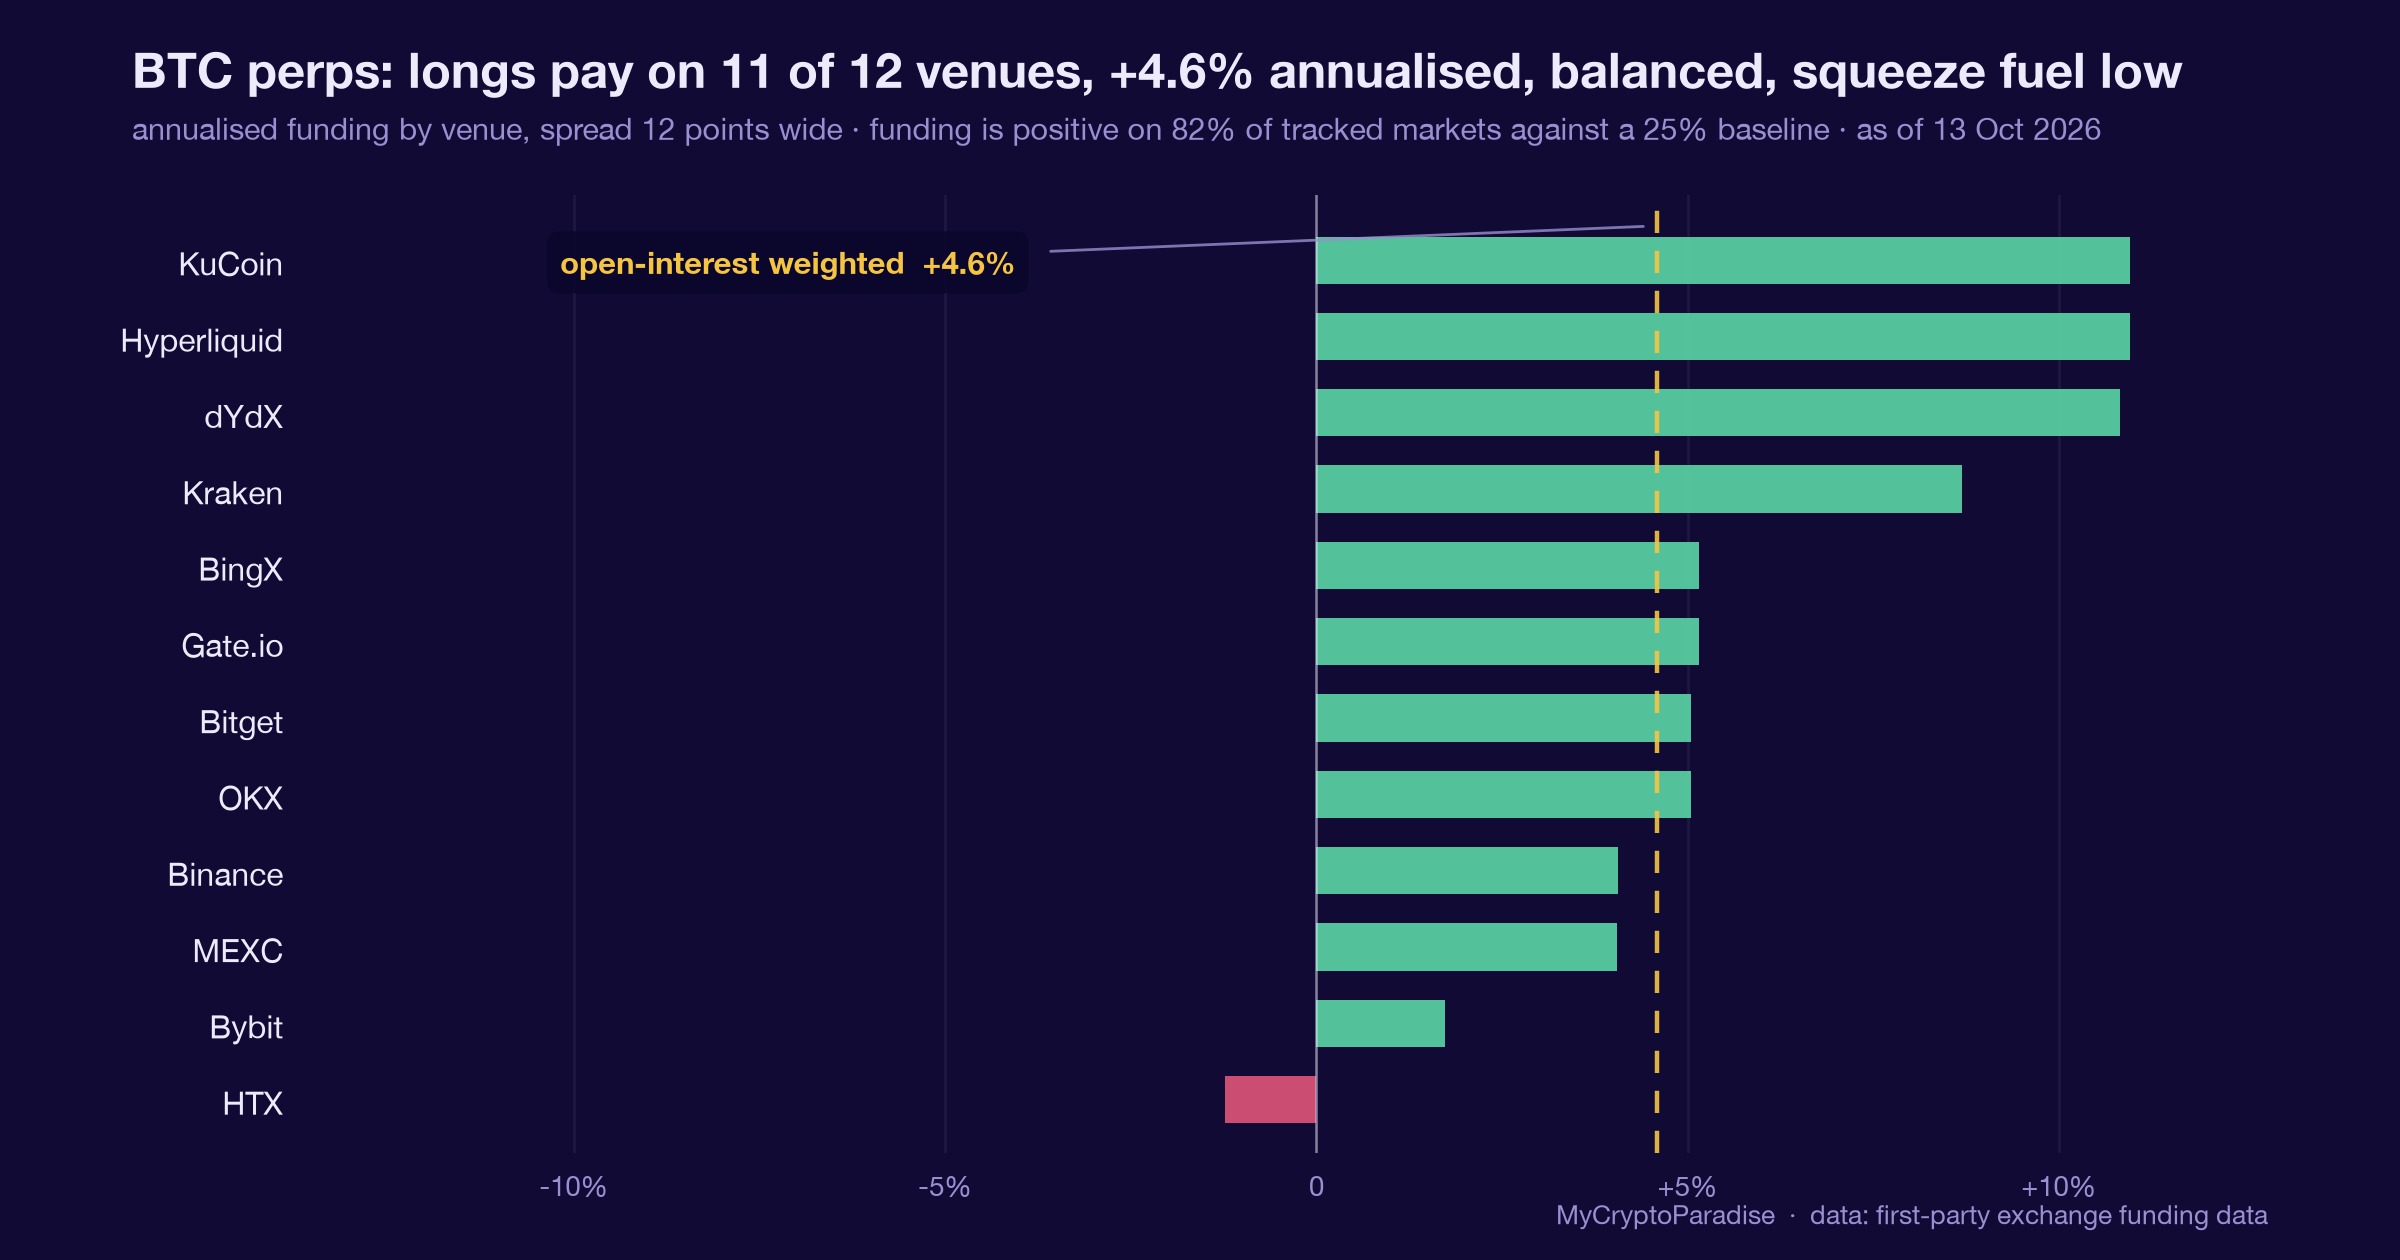
BTC stalled near overhead supply while funding stayed balanced at about 4.6 percent annualized: why the quiet leverage tape matters.
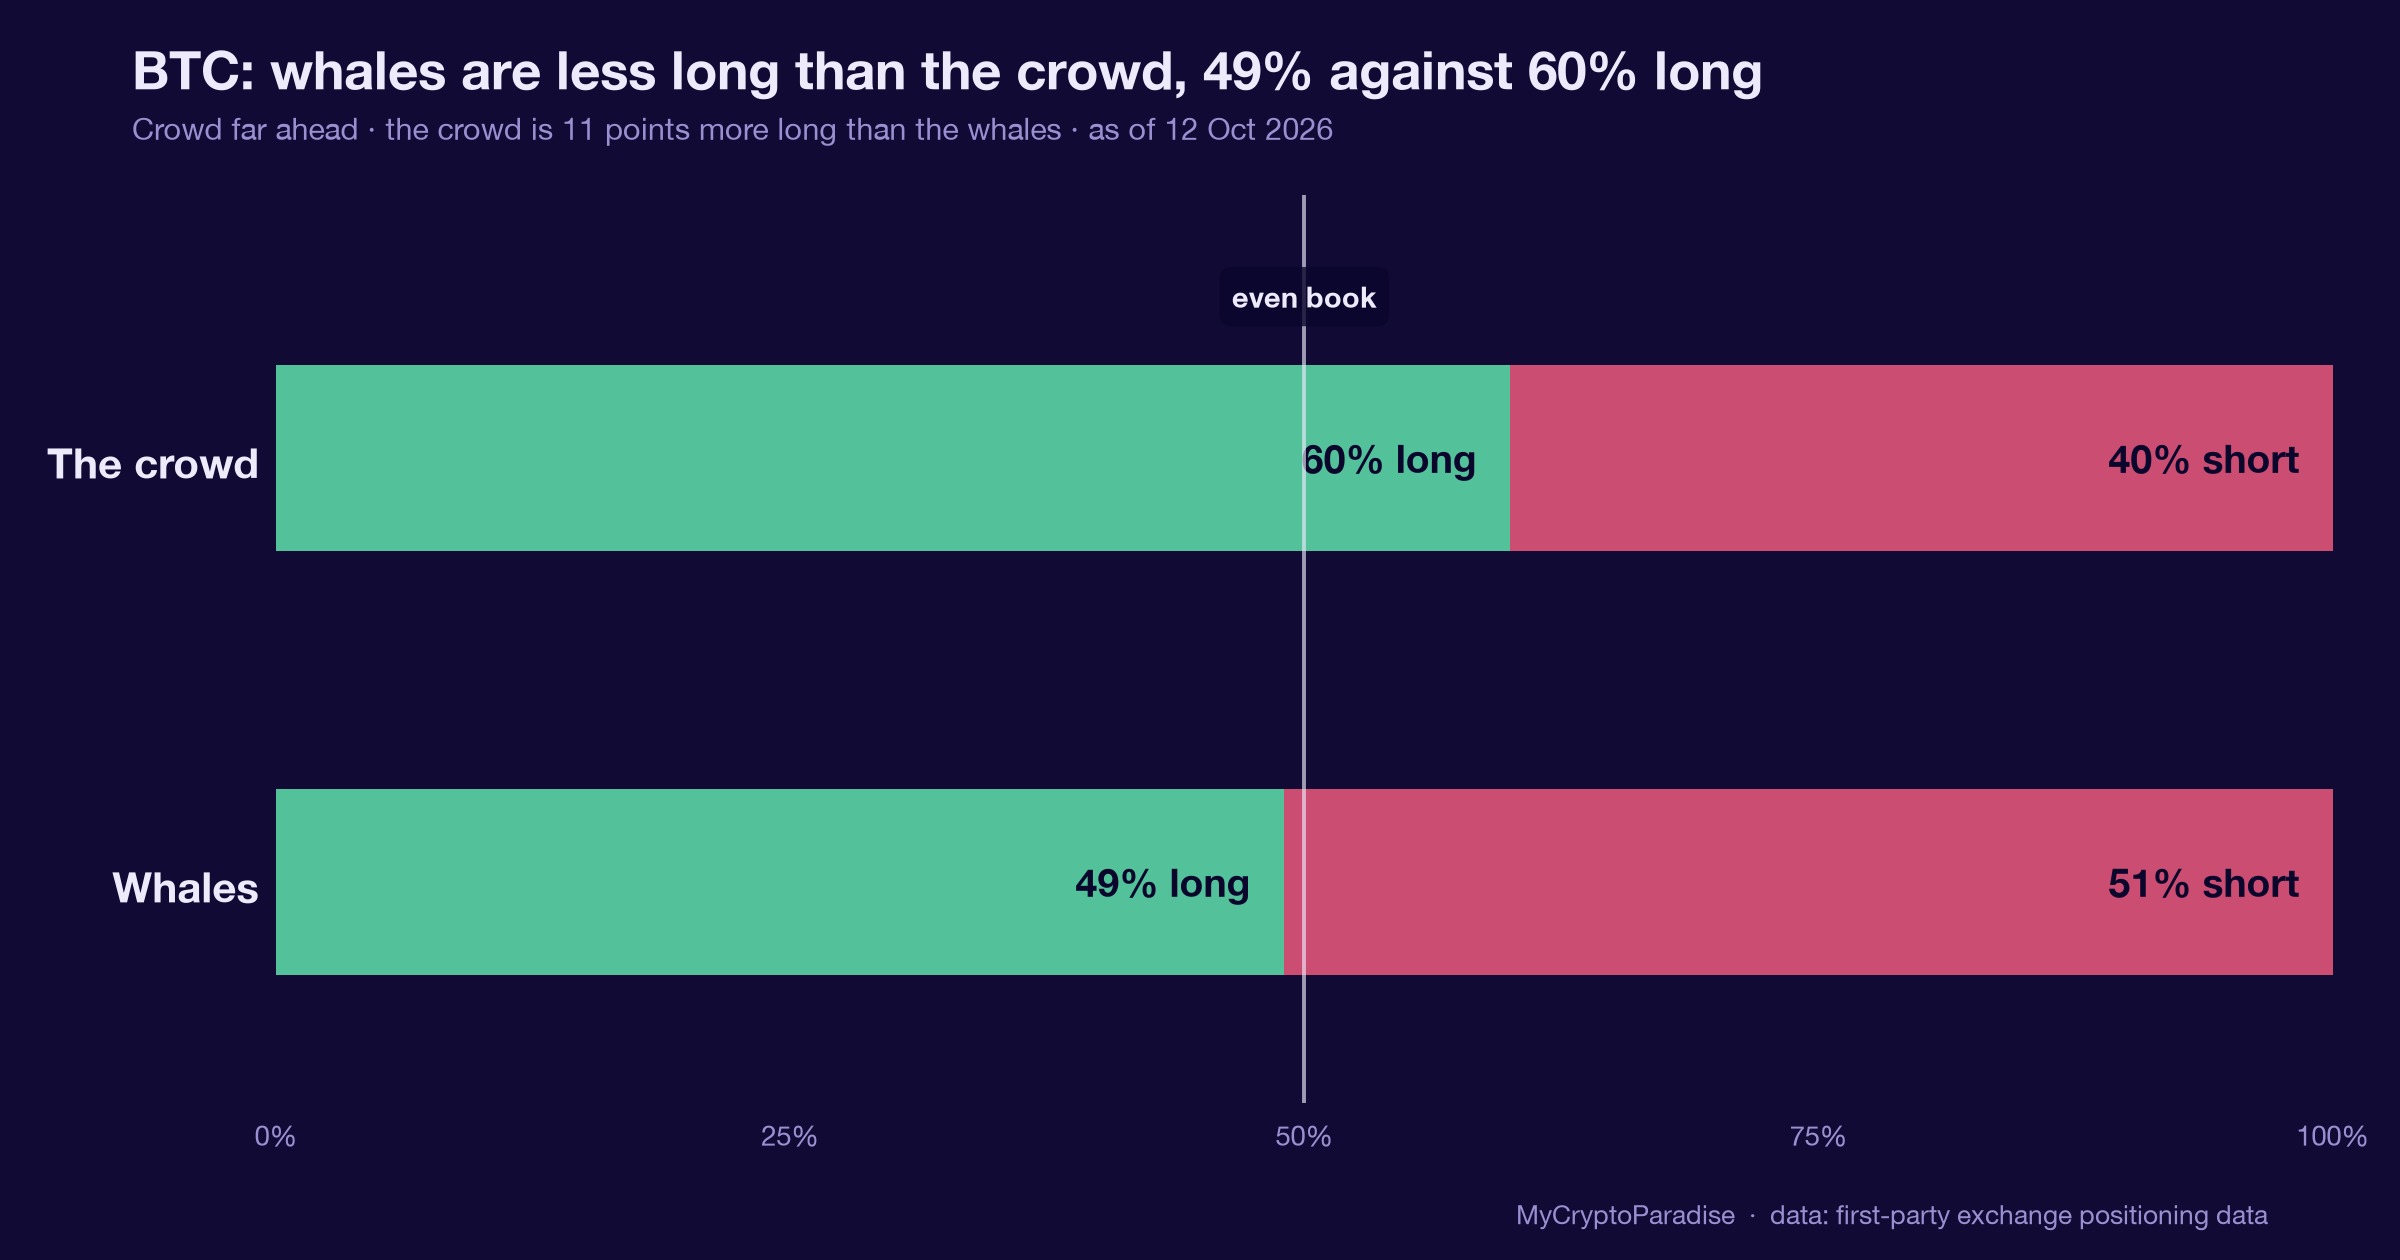
One $35.6M Bitcoin short hit the feed, but our 24-hour whale tape was net buying and the whale index sits buy-side. Here is how to read it.
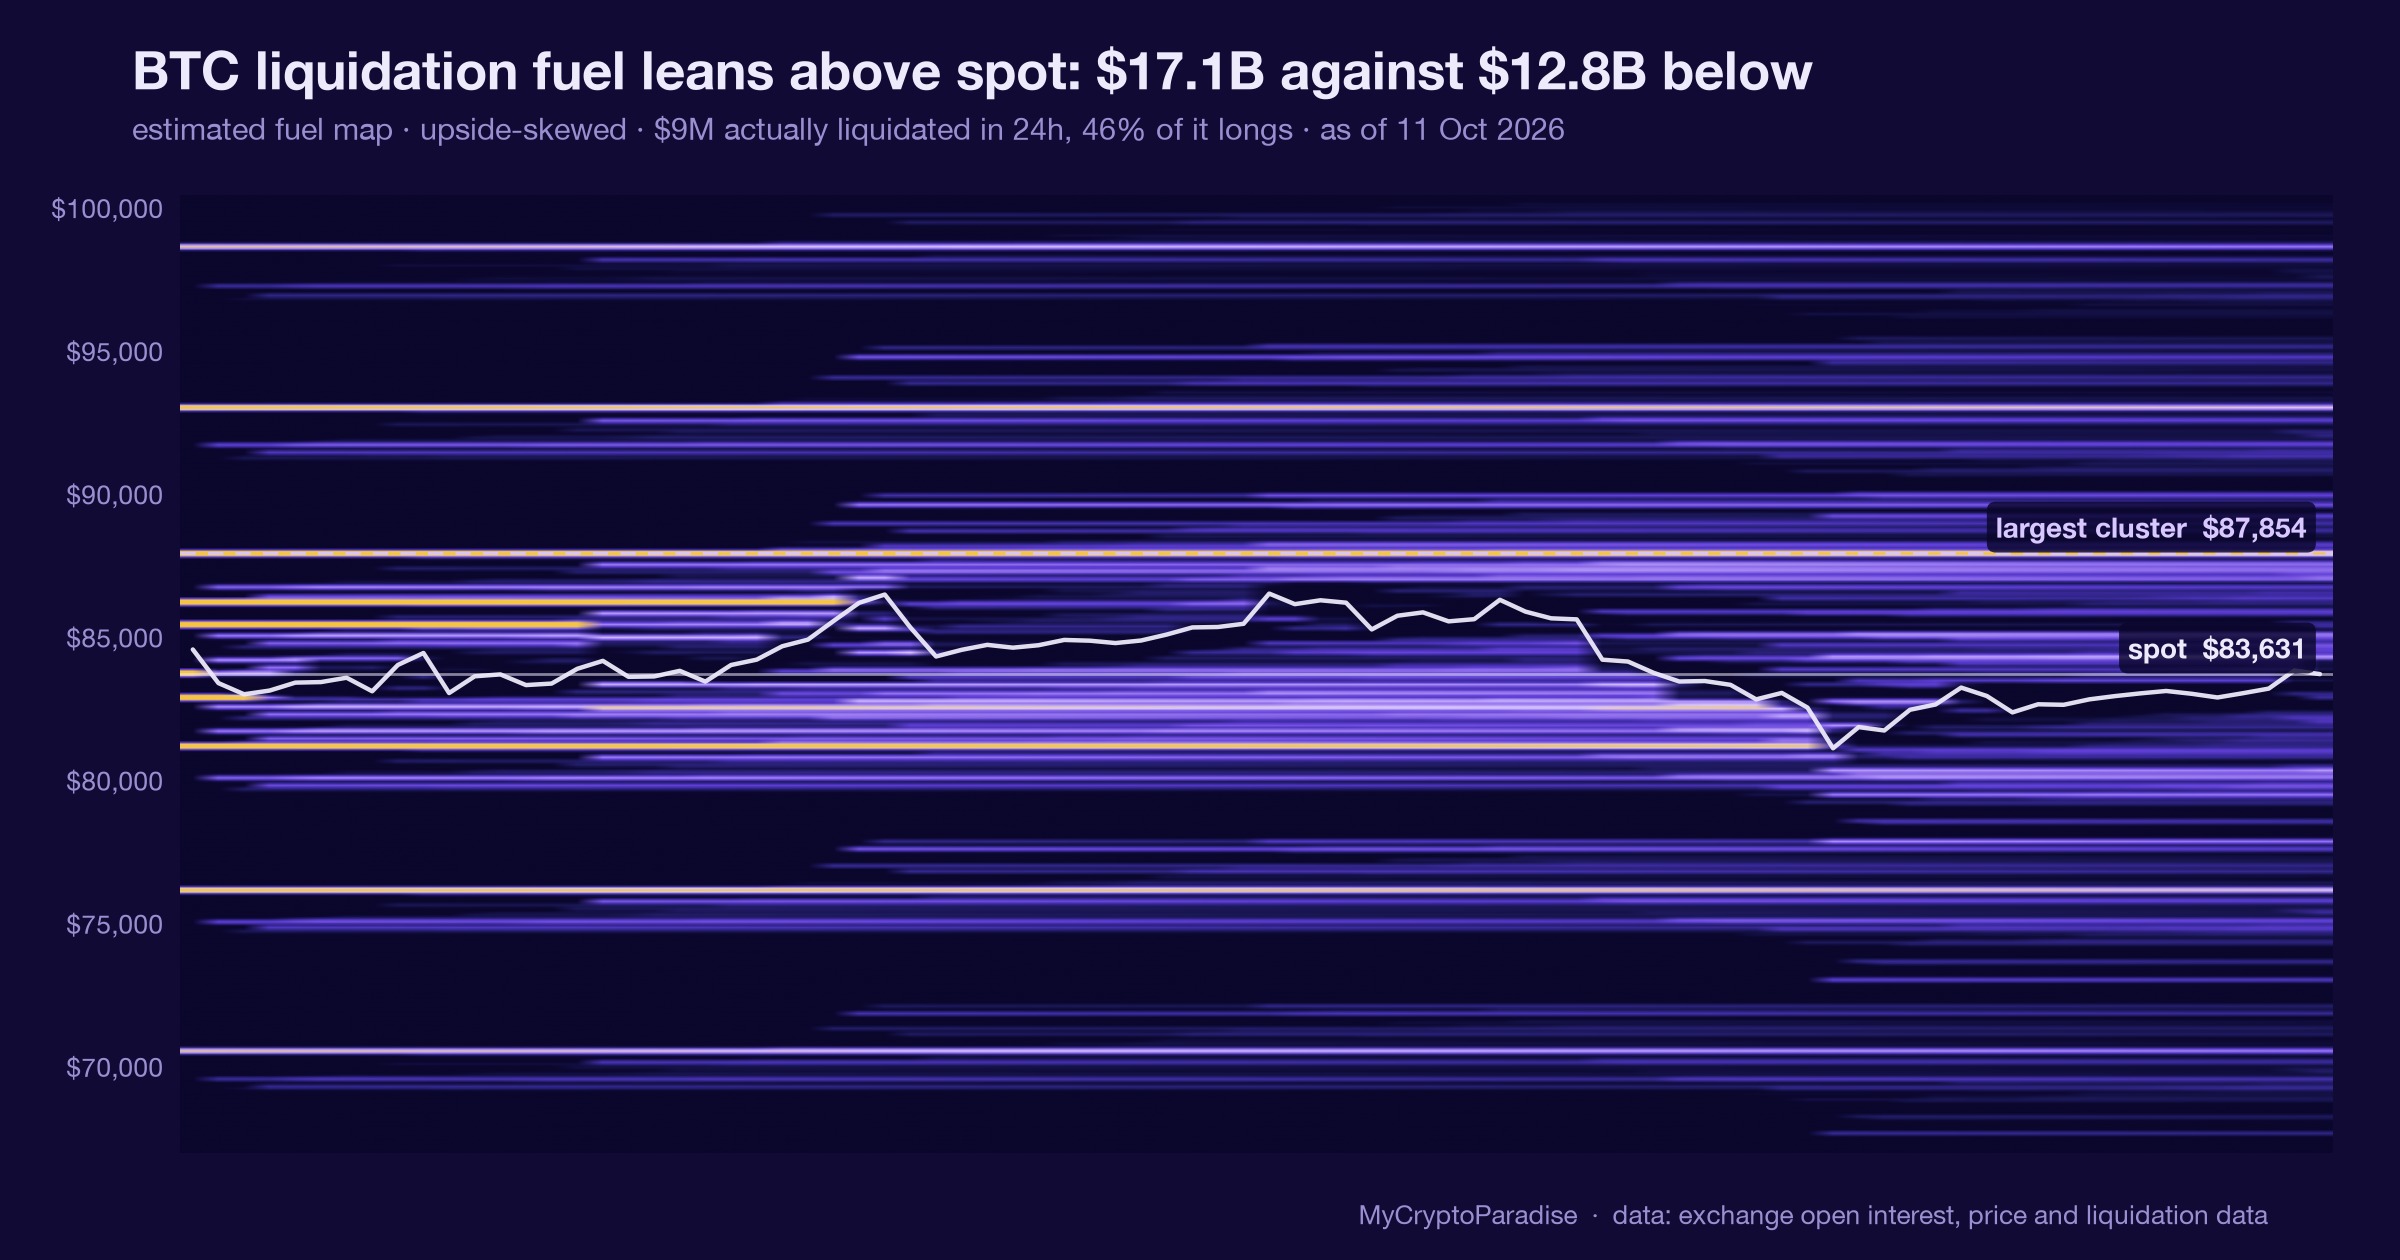
BTC’s liquidation heatmap flipped upside-skewed on 11 October: $17.1B fuel above spot, $12.8B below. How to read it, and where it stops.
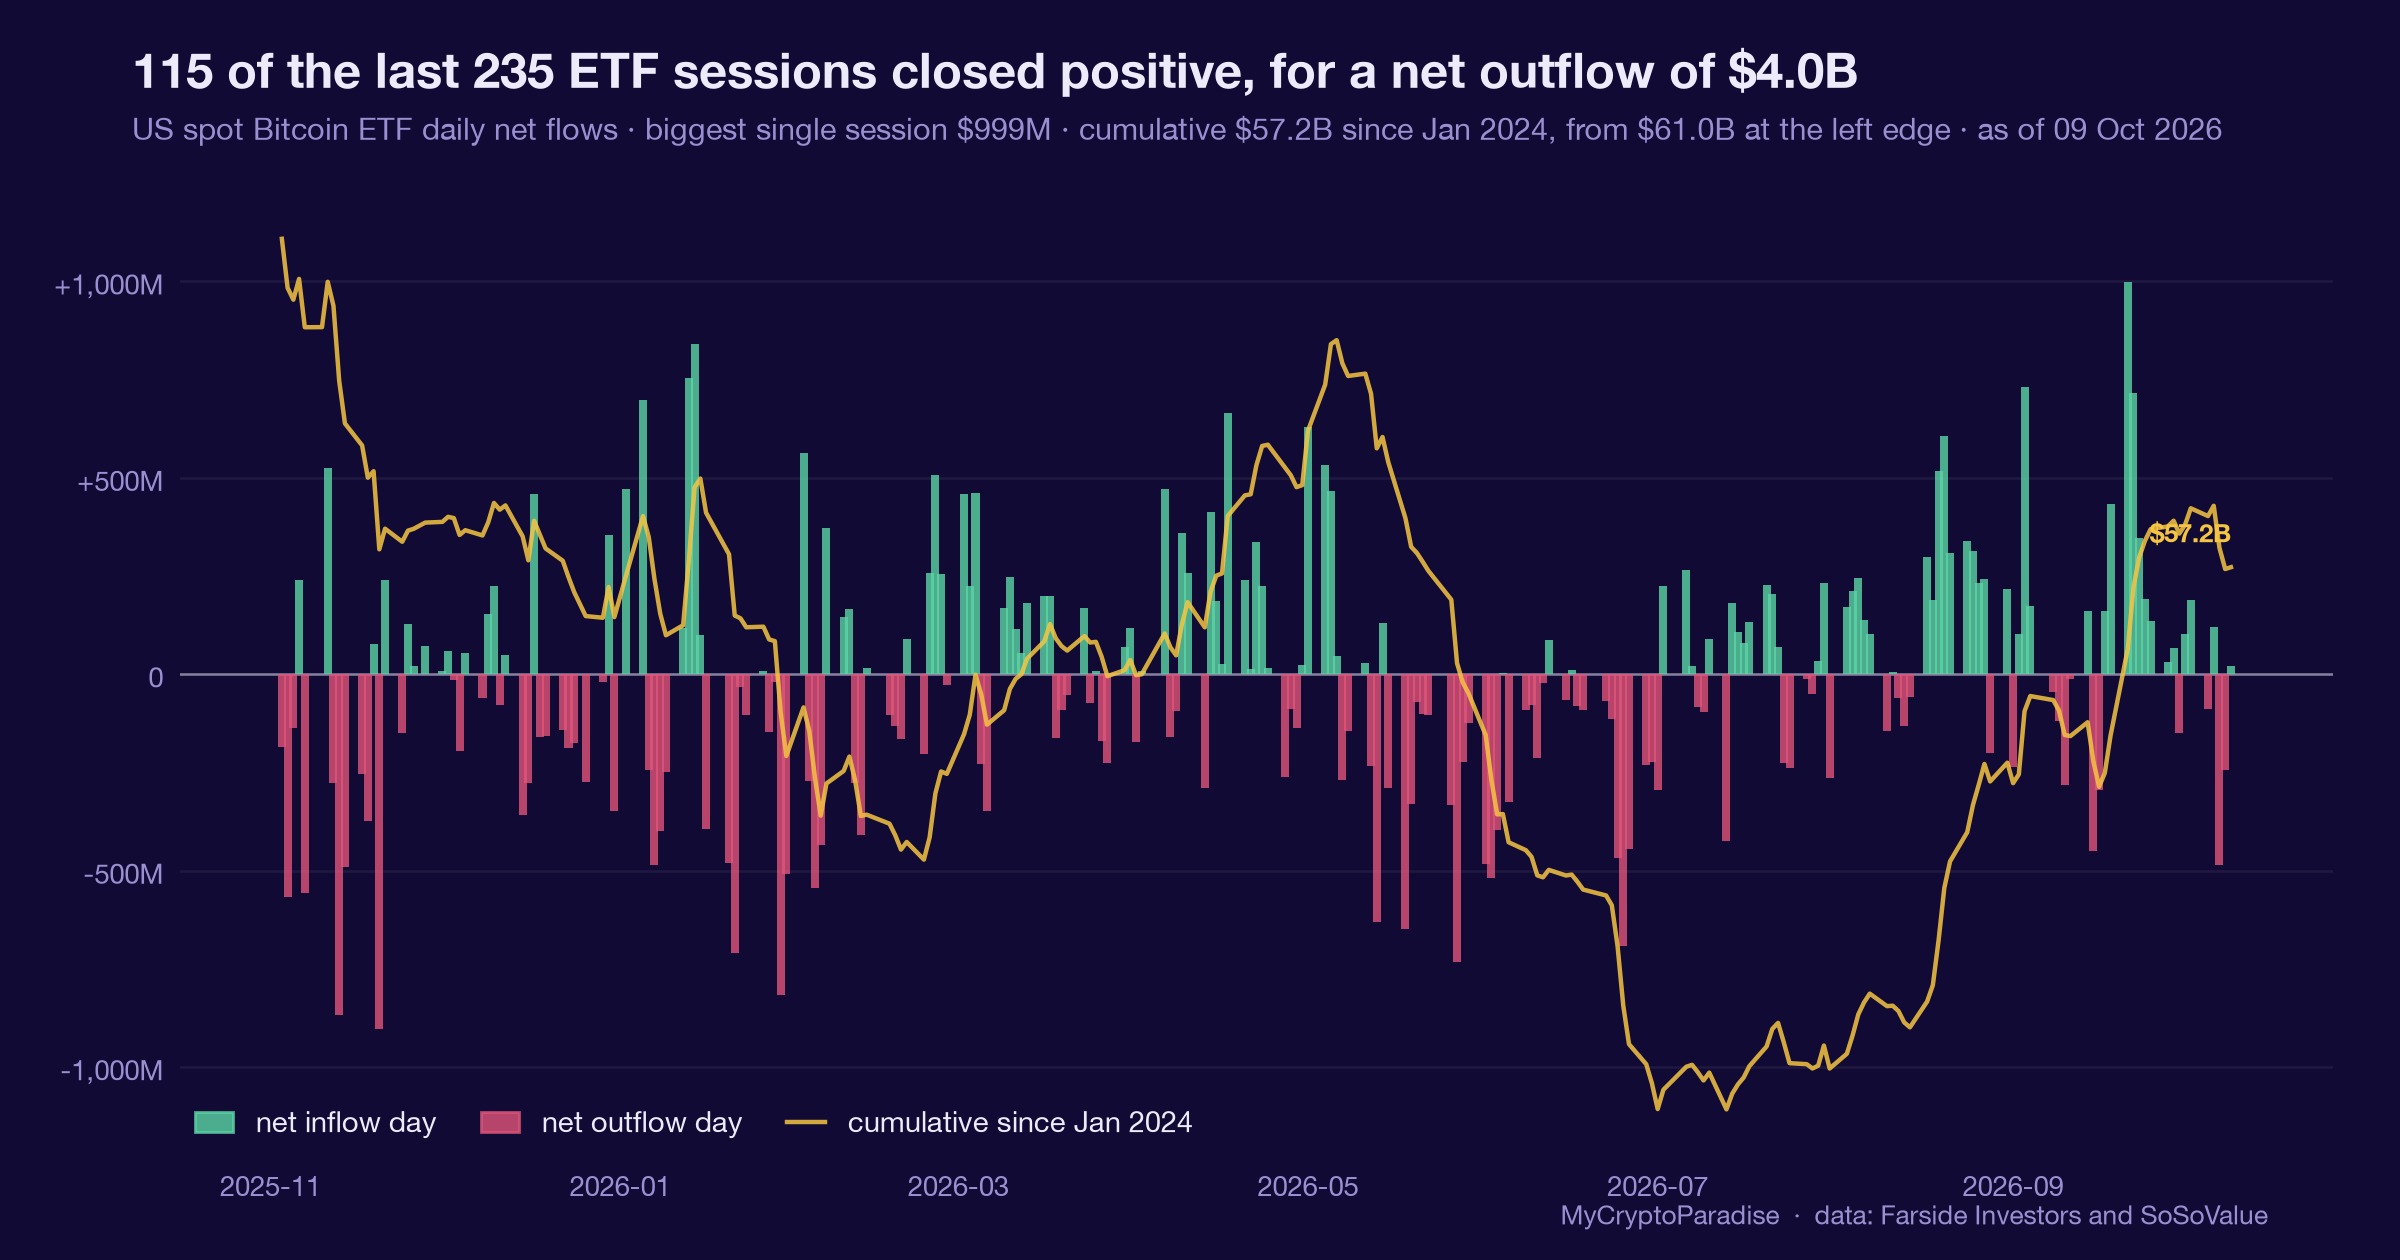
Bitcoin ETFs lost $681.1M over five sessions to 9 October, yet the outflow ranks only in the 26th percentile and the 30-day net stays positive.
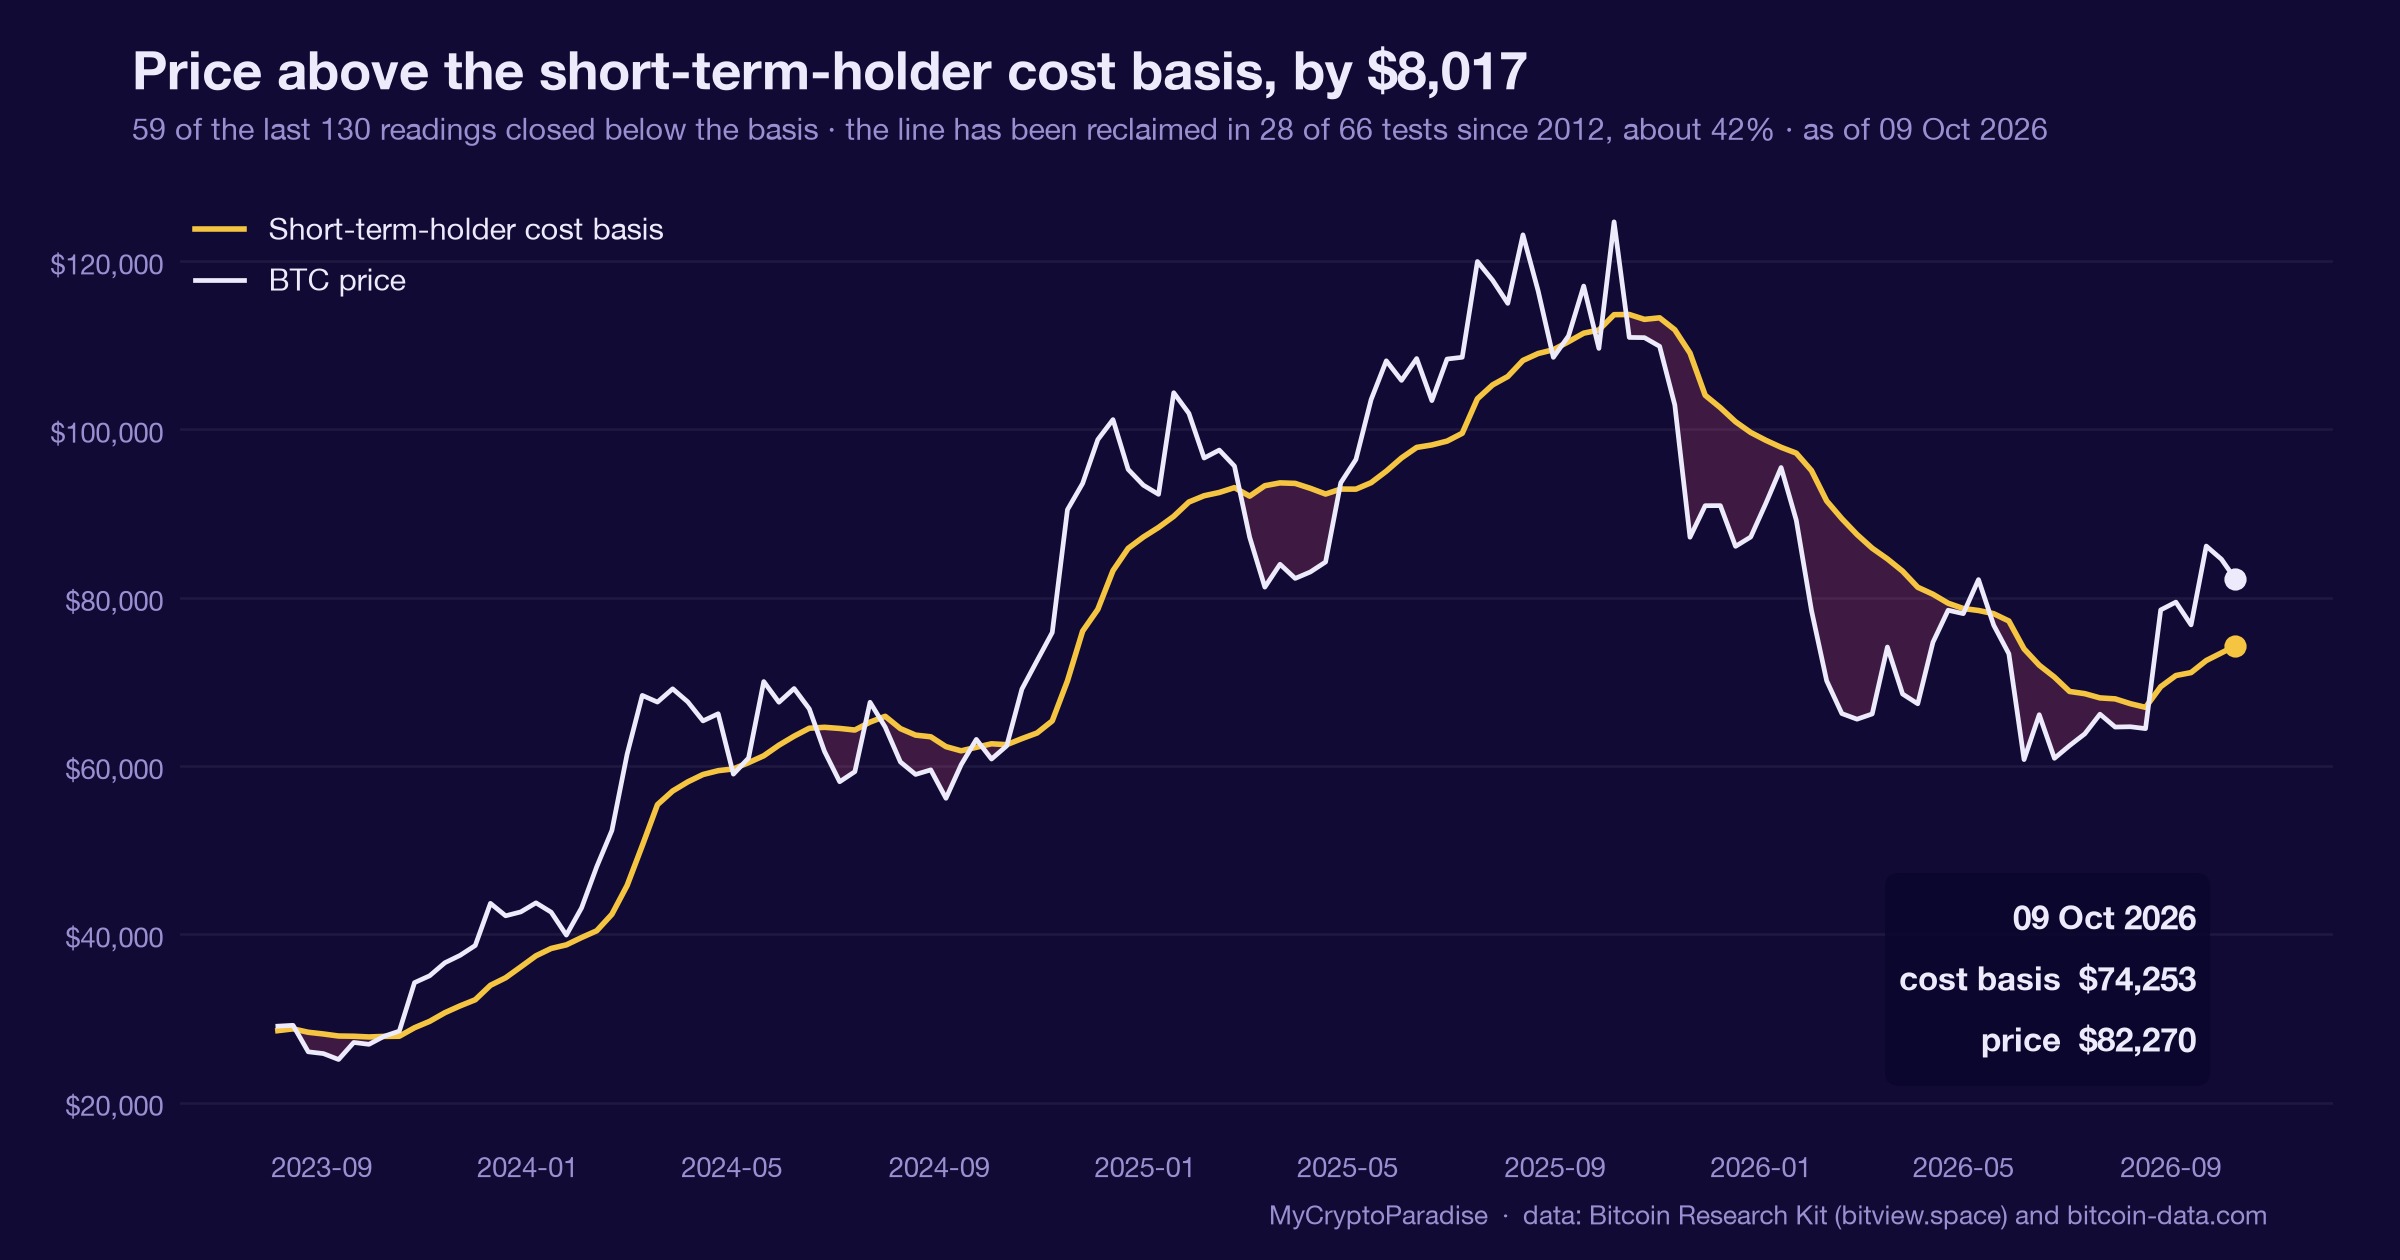
Bitcoin trades 53% above its realized price, yet 31% of supply is underwater. How to read the cohort cost-basis split and its invalidation level.
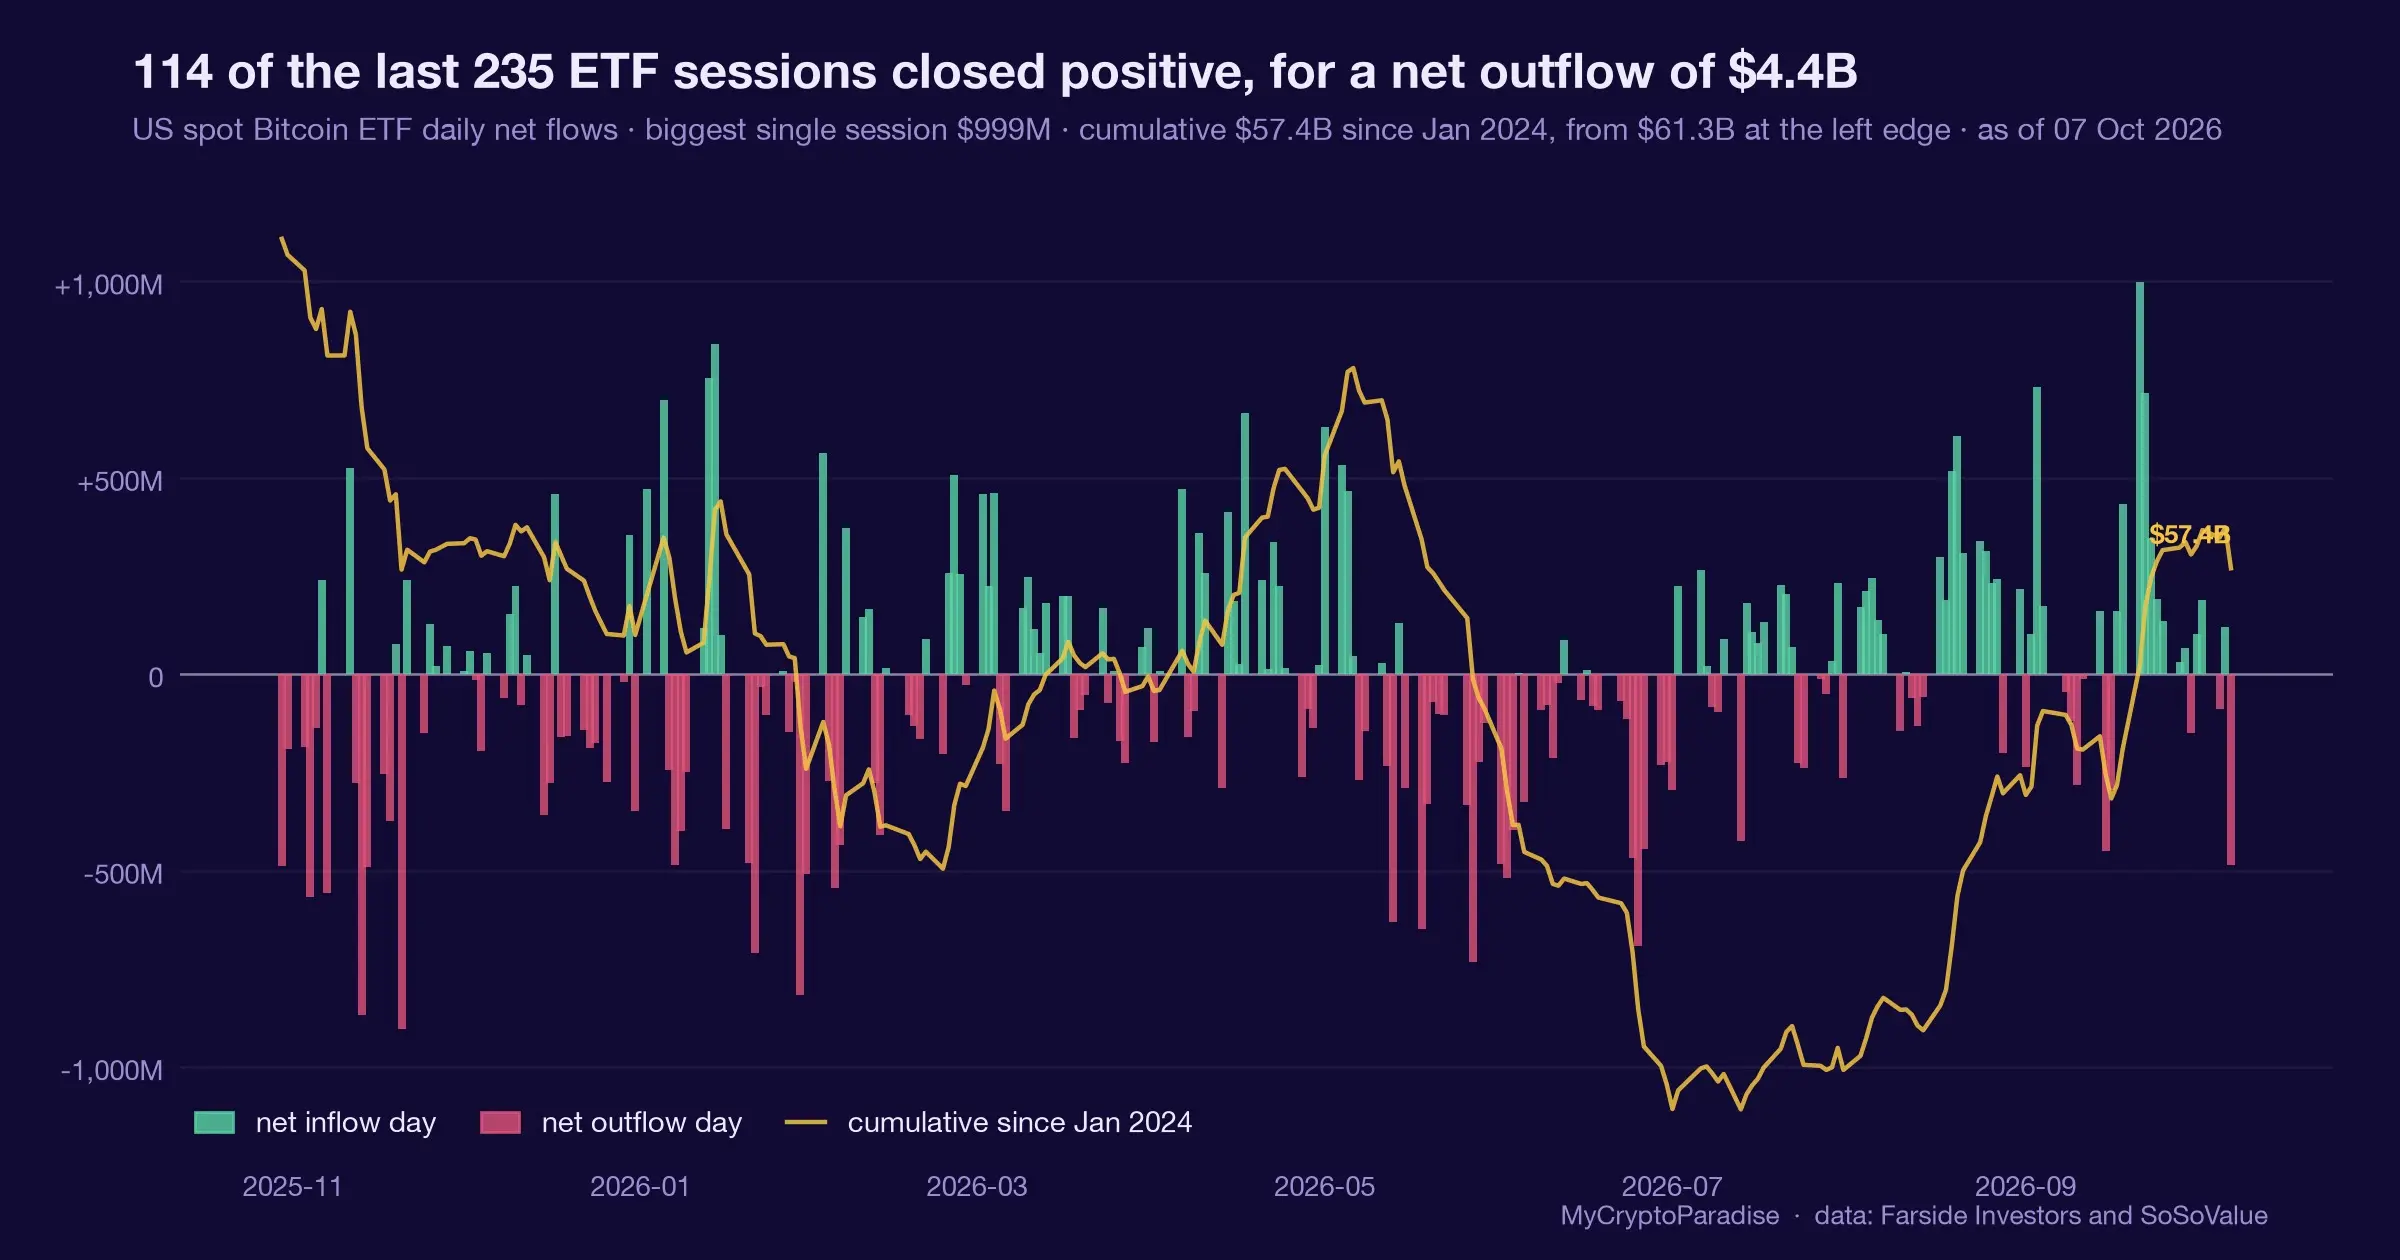
Bitcoin’s two biggest buyer cohorts share a break-even floor. How to read ETF cost basis, and the level that flips the read.
 Chat with one of our tradersChat with a trader