

In short
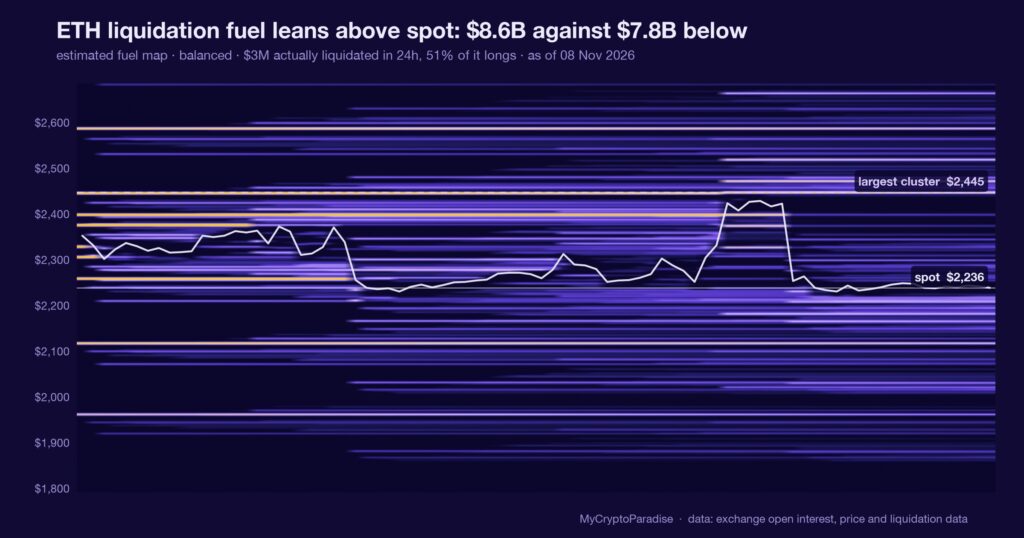
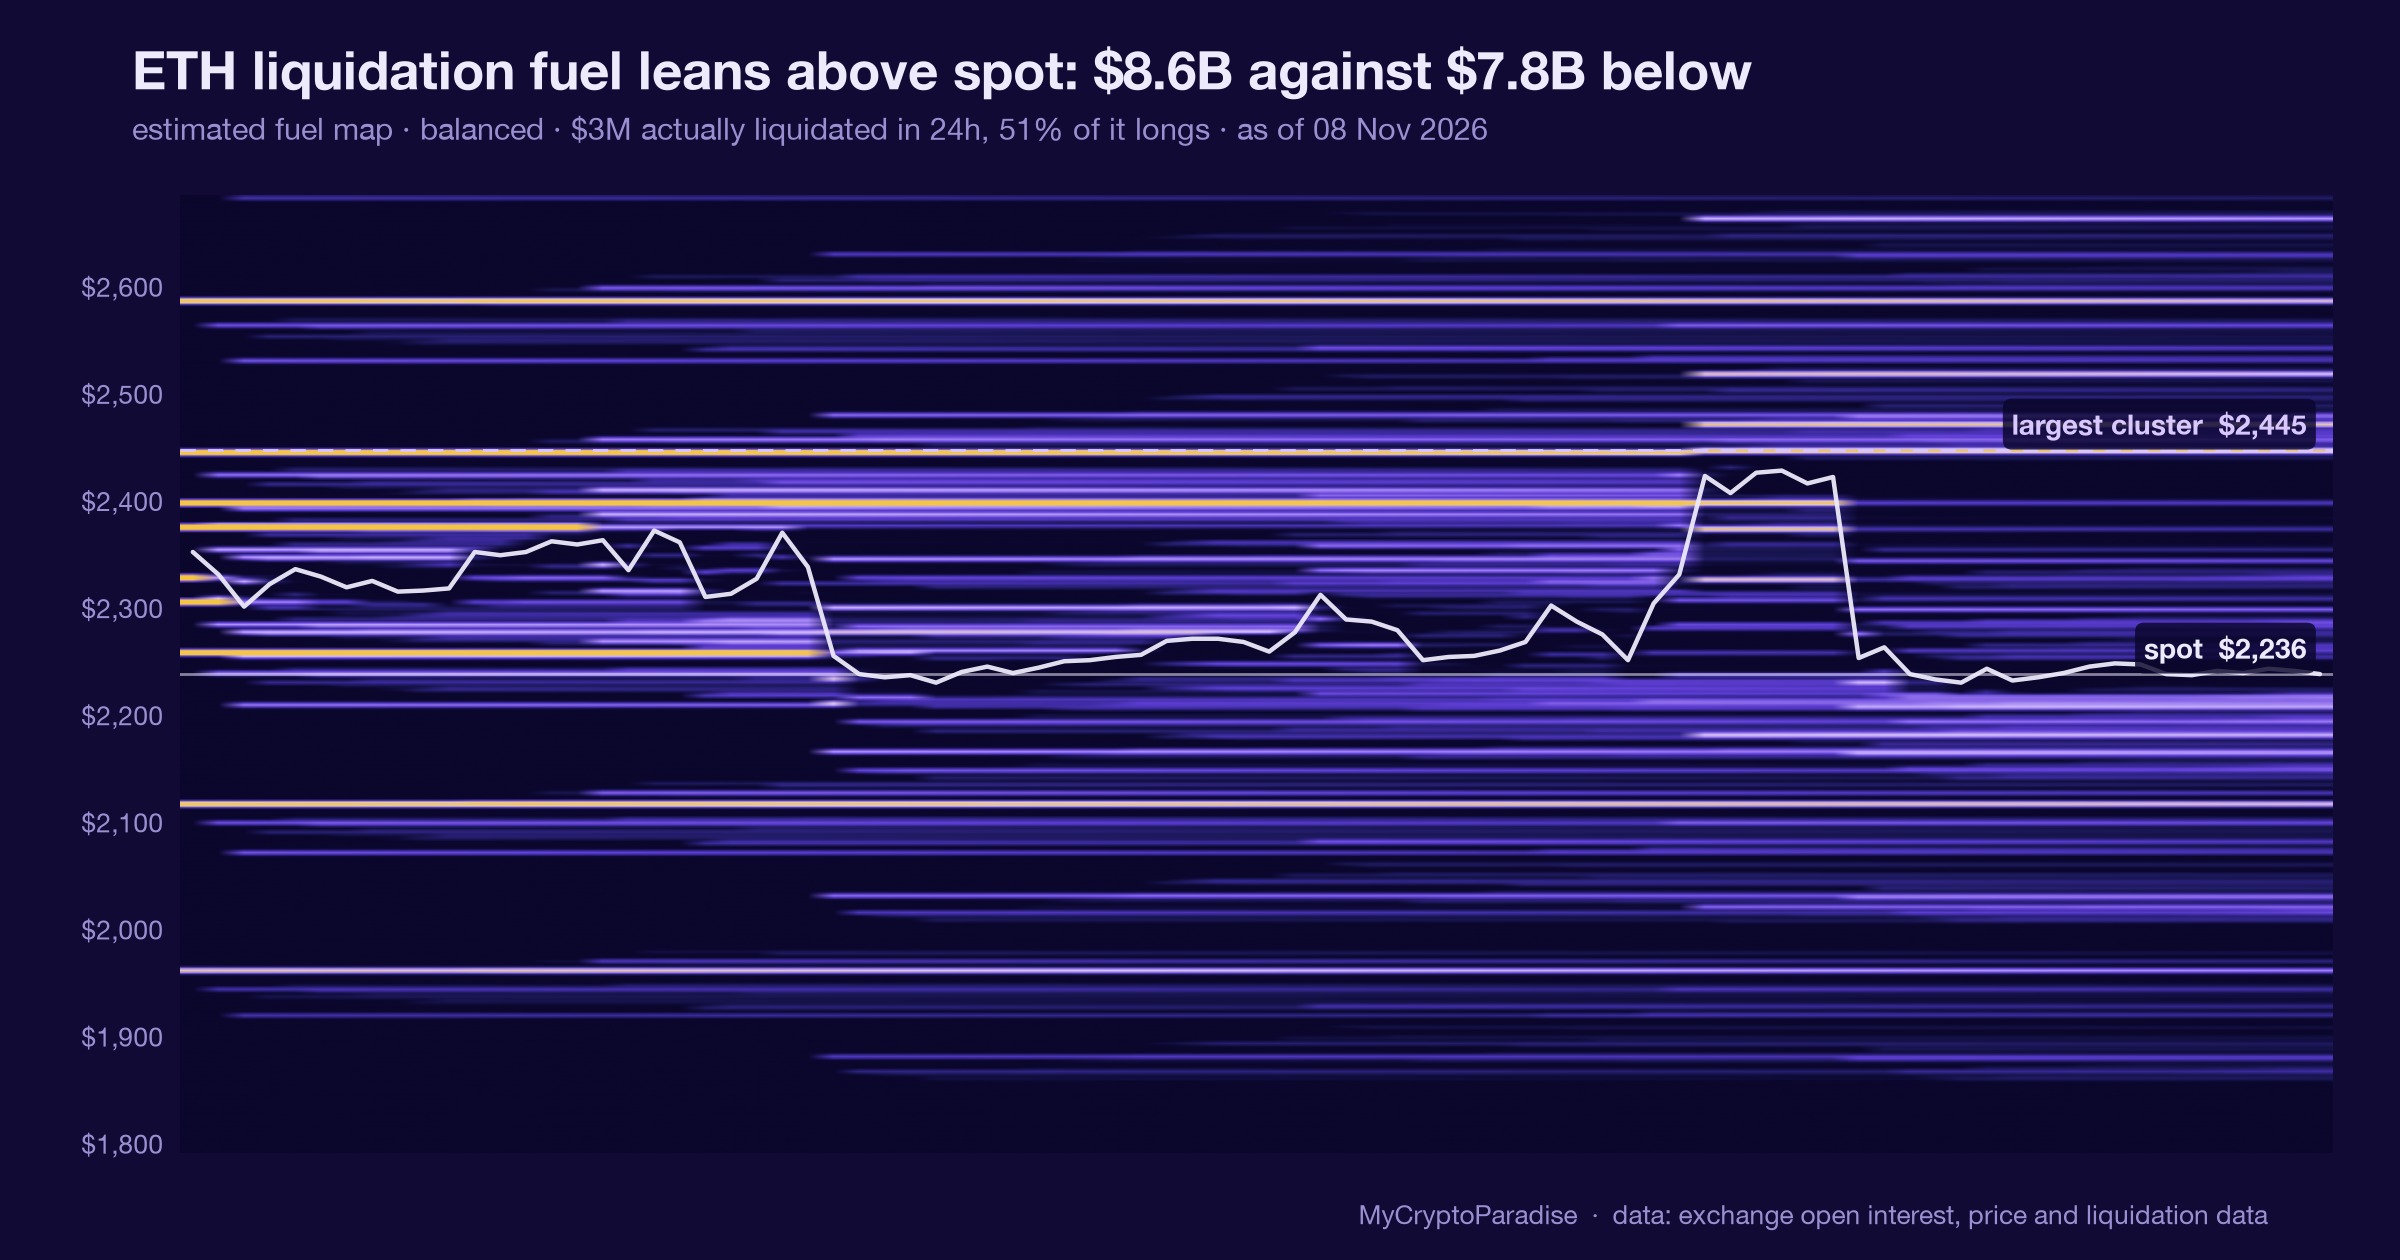
A liquidation heatmap estimates where leveraged positions would be force-closed, and the resting order book shows the real bids and asks waiting within reach of price. On 8 November 2026, with ETH near $2,236, our MCP Insights order-book reading holds $698.6M of bids against $639.4M of asks within 2 percent of spot: a 52.2 percent bid share, a slight lean below that eased 2.6 points from yesterday. The fuel map agrees it is close: $8.62B of estimated fuel above against $7.80B below, roughly 1.1 to 1, which our grid simply labels balanced. We call this neutral, explicitly not a directional read. Both the fuel map and the absorption gauge carry a model-estimate flag that has not cleared calibration, so we quote no historical frequency. This piece shows you how to read the heatmap and the resting book yourself, without mistaking a balanced tape for a loaded one.
Key facts
- ETH spot at the reading
- $2,236
- Estimated ETH liquidation fuel above spot
- $8.62B
- Estimated ETH liquidation fuel below spot
- $7.80B
- Fuel balance
- balanced, +5 points toward the heavier side
- What would prove this read wrong
- A daily close that drags the estimated fuel map firmly to one side of spot, or the within-2-percent bid share flipping clearly ask-heavy as the resting book turns net offered.
- Reading taken
- 08 November 2026
- Source
- Our MCP Insights tools, from exchange data
A heatmap is a map of fuel, not of intent
A liquidation heatmap marks the price levels where leveraged positions would be force-closed if spot reached them. It is a map of where stops and margin sit, not a forecast of where price travels.
The resting order book is the other half. It shows the bids and asks actually posted near price: the standing demand and supply a move has to clear before it accelerates. One measures potential fuel; the other measures present willingness.
Both describe the terrain. Neither describes the walk. A balanced map is a statement that neither side is obviously loaded, which is itself information.
The 8 November reading leans a hair below, then flattens
Per our MCP Insights order-book data on 8 November 2026, ETH sat near a $2,239 mid with $698.6M of resting bids against $639.4M of asks inside 2 percent of spot: a 52.2 percent bid share. That lean eased 2.6 points from yesterday.
The estimated fuel map tells the same calm story. It holds $8.62B above spot against $7.80B below, roughly 1.1 to 1, which our grid labels balanced across a $1,789 to $2,683 band.
The forced tape is thin and even. Over 24 hours our OKX, HTX and Gate feed logged just $2.51M of liquidations, split 51 percent long to 49 percent short. The visible book flagged zero spoofs and zero icebergs: stable.
Three readings, one message: nobody is cornered here. A balanced map and a clean book are the absence of a setup, and the absence of a setup is a finding.
What is different here
The ParadiseTeam does not read the alert’s screenshot and relay its scare. We pull our own order book and estimated fuel map, check the forced tape against three venues, and label what we measure: balanced is balanced. The method is refusing to narrate an imbalance that our grid does not show.
The alert’s ‘both sides loaded’ is the easy misread
The source alert framed this as large positions stacked on both sides, with a decent chance of a liquidity grab either way. Read loosely, that sounds like a coiled spring.
Our numbers say the opposite of coiled. Balanced fuel, a near-even forced tape and a clean book are what a market without a crowded corner looks like. There is no lopsided pocket for price to hunt, which is the whole point of the grab thesis.
A liquidity grab needs an imbalance to grab toward. When both sides are stocked evenly, the honest read is that the fuel is there but the lean is not.
A clean book and a no-edge gauge say the same thing
The order book itself is orderly. Our integrity check flagged zero spoofed walls and zero icebergs across the venues it watches, and it calls the visible depth stable, with no large wall sitting near price.
Our order-flow absorption gauge agrees there is nothing to chase. It shows no active episode and sits in its no-edge zone at the 3rd percentile, which is the reading of a tape that is neither being absorbed nor exhausted.
A gauge that admits it has no edge is more useful than one that always finds a signal. Three tools declining to invent a lean is not a null result: it is the result.
One input that argues for no bias at all
No single reading decides a position. This balanced map is one input beside funding, open interest and spot absorption, and today it does not fight them: all of them decline to point anywhere, which is itself worth noting.
Because both the fuel map and the absorption gauge carry an uncleared calibration flag, we treat their numbers as model estimates, never as calibrated probabilities. The order-book depth is measured directly and does not carry that caveat.
So we size this at nothing until the terrain tilts. A balanced map is a weight on no bias, and the honest highest-probability stance for most is no trade at all.
Reading the ETH heatmap and book yourself, step by step
- Open the liquidation heatmap and read the total estimated fuel above spot against the total below, not the brightest single band.
- Convert the two totals into a ratio: anything inside roughly 1.3 to 1 is better described as balanced than as loaded.
- Pull the resting order book and compare bids to asks within 2 percent of spot to see where present demand actually sits.
- Check the 24-hour forced tape and its long-short split: a thin, even number means no side was recently punished.
- Confirm the book is clean, with no flagged spoof or iceberg walls, before trusting any lean the depth seems to show.
The step people skip is the ratio in step two: a bright band looks dramatic, but until you weigh both totals you cannot tell loaded from balanced.
Every number above is checkable against the live data. Start with the crypto liquidation heatmap, then cross-read the MCP Insights hub and the Crypto Fear and Greed Index.
Act and invalidate
| Scenario | What confirms it | What kills it |
|---|---|---|
| Stays balanced, range holds | Fuel ratio near 1 to 1 | Daily close out of the band |
| Fuel migrates above | Above-spot pocket outgrows below | Bid share flips ask-heavy |
| Fuel migrates below | Below-spot pocket outgrows above | Forced tape turns short-heavy |
Posture: The highest-probability stance here is no trade and a defined invalidation. A balanced map rewards patience, not positioning: wait for the fuel or the book to pick a side before sizing anything.
Frequently asked questions
What does a balanced liquidation heatmap mean?
It means the estimated fuel sitting above spot and below spot are close in size, so neither side is obviously crowded. On 8 November ETH held $8.62B above against $7.80B below, roughly 1.1 to 1, which removes the lopsided pocket a squeeze would need.
Is ETH about to see a liquidity grab?
The alert raised the idea, but a grab needs an imbalance to aim at. With fuel near even, a clean order book and a thin forced tape, our reading finds no crowded side to hunt, so we quote no such setup today.
Why does the order book matter alongside the heatmap?
The heatmap estimates where positions could be force-closed, while the book shows real resting demand and supply. Today bids lead asks 52.2 to 47.8 percent within 2 percent of spot, a slight lean below that eased 2.6 points from yesterday.
Can I trade off this reading alone?
No single indicator decides a position. This balanced map is one input beside funding, open interest and absorption, and on its own it argues for no bias rather than a direction. It sizes risk; it does not set entries or targets.
What would change this neutral read?
A daily close dragging the estimated fuel firmly to one side of spot would end the balance, as would the within-2-percent bid share flipping decisively ask-heavy. Either shift gives price a crowded pocket to lean toward, and the read stops being neutral.
Crypto trading involves substantial risk and is not suitable for everyone. Nothing here is financial advice; it is education only. Never risk more than you can afford to lose.
The private Extras feed, where the liquidation heatmap, the resting order-book depth and the forced-tape split update intraday with their invalidation levels, is part of PRO Paradiser, the intelligence layer behind the ParadiseFamilyVIP strategies.






Join the discussion
No comments yet. Members, share how you are reading this.