

In short
Cycle valuation asks one question: how stretched is Bitcoin against the averages and cost bases that have marked every prior top. Our model read on 1 November 2026 puts spot near $77,900, below an estimated production cost of about $92,900, with the Mayer Multiple at 1.06 and MVRV (market value versus realised cost basis) at 1.44. We called this neutral, explicitly not a top and explicitly not a dated forecast. Every prior cycle in our comparison peaked between 2.79 and 6.03 on MVRV; today is 1.44, which says early, not over. The gauge is a model estimate that has not cleared its calibration gate, so we quote no historical frequency and no price. The source promised $100K by Q1 2027; charts describe conditions, not calendars. This piece shows you how to read cycle valuation yourself.
Cycle valuation measures distance from every prior top
Cycle valuation is not one indicator but a panel of them. The Mayer Multiple compares price to its long-run moving average. The Pi Cycle compares two longer averages for the moment they cross. The Puell Multiple watches miner revenue against its own yearly norm. Each asks the same question from a different angle: how stretched is this.
MVRV (market value versus realised value, the aggregate cost basis of every coin) and NUPL (net unrealised profit and loss) measure how much of the market sits in paper gain. Hash Ribbons watch whether miners are capitulating or expanding.
None of these metrics knows what month it is. They describe a condition, not a countdown, and that distinction is the whole of this piece.
The reading on 1 November looks early
Per our MCP Insights cycle data, spot sat near $77,900 on 1 November 2026. The Mayer Multiple read 1.06, forty-three percent of the way to its 2.4 stretch line. Pi Cycle proximity was 0.49, Puell 1.12, and the 2-year average multiplier 0.87.
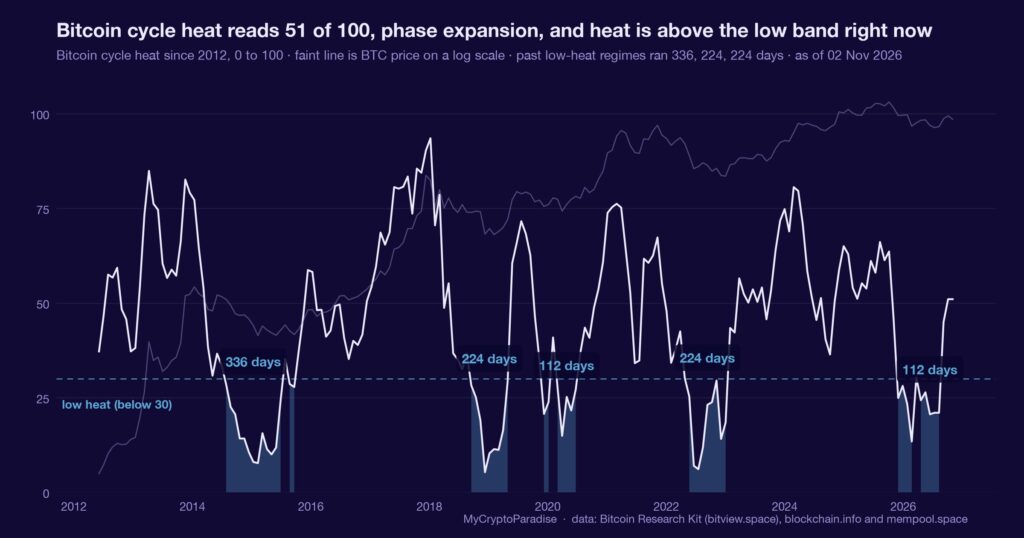
Our valuation model put MVRV at 1.44 and NUPL at 0.31, a 33rd-percentile neutral zone. The composite cycle-heat score read 51 out of 100. Estimated production cost sat near $92,900, so spot traded at roughly 0.84 of what it costs to mine a coin.
Every prior cycle in our comparison peaked on MVRV between 2.79 and 6.03. Today is 1.44. A panel this far below its own top-marking thresholds is describing early expansion, not a ceiling.
What is different here
The ParadiseTeam reads cycle valuation as a panel of thresholds, not as a timetable. Where a prediction converts charts into dated prices, we convert them into a distance: how far today sits from every prior top, and the invalidation that would change the reading.
Below production cost is not a floor
The source read these same charts as a schedule: $100,000 by Q1 2027, a new all-time high by Q3 2027, then $180,000 to $200,000 by Q4 2028. Charts, it said, do not lie.
Charts do not lie, but they also do not carry calendars. Price below production cost has preceded both long bases and deeper flushes; miners hold, sell or capitulate, and only the hash-ribbon reading tells you which, after the fact.
A metric that names a month is not reading data. It is decorating a guess with one.
One gauge cannot set a date
Our reading is a model estimate, not a calibrated probability. The cycle and valuation series both carry a flag that they have not cleared their calibration gate, so we attach no historical frequency to any of these numbers.
This is one input. Cycle valuation sits alongside funding, spot demand and the cost-basis read, and on its own it weights a bias rather than setting one. You can watch the same panel move on our Bitcoin cycle valuation page.
The deeper layers behind this gauge live in PRO Paradiser. A single reading is a lean; the panel around it is what sizes the risk.
What the panel has not done yet
Through this expansion our model has not fired a top signal. The 90-day new-high probability reads zero, and the 90-day top-risk grade sits at 22 out of 100, drifting sideways in the neutral band rather than climbing toward euphoria.
That is not a forecast that it never will. It is an honest statement that, as of this reading, the conditions that marked every prior top are absent, and the ones that mark a base are only partly present.
The honest grade is incomplete, not bullish. A panel that has not topped is telling you where you are not, which is a smaller claim than where you are going.
Reading cycle valuation yourself, step by step
- Start with the Mayer Multiple: price over its long-run average, and note how far it sits below the 2.4 stretch line.
- Check the Pi Cycle proximity and the 2-year average multiplier for the same stretch question from longer lookbacks.
- Read MVRV and NUPL together: how much of the market holds paper profit, and in which valuation zone it sits.
- Compare today’s MVRV against the panel of prior cycle peaks, which ran from 2.79 to 6.03.
- Set your invalidation at the threshold that flips the read, not at a predicted price or a calendar quarter.
The step people skip is comparing against prior peaks. A metric looks high until you line it up with every past top and see how much room remains.
Every number above is checkable against the live data. Start with the MCP Insights hub, then cross-read the Crypto Fear and Greed Index and the live crypto funding rates.
Act and invalidate
| Scenario | What confirms it | What kills it |
|---|---|---|
| Mid-expansion read holds | Top-risk grade stays low | A daily close into euphoria zone |
| Below-cost base extends | Hash Ribbons hold above one | A hash-ribbon inversion fires |
| Dated target disappoints | MVRV stays under 2.0 | MVRV reclaims the 2.5 peak zone |
Posture: Patient, not positioned. A neutral valuation panel is a reason to wait for confirmation, not a reason to act on a calendar someone else drew.
Frequently asked questions
What does Bitcoin cycle valuation actually measure?
It measures how stretched price is against the averages and cost bases that marked prior tops. On 1 November 2026 the panel read neutral: MVRV at 1.44, cycle-heat at 51, and spot below its estimated production cost. Early, not over.
Does price below production cost mean a bottom?
No. A spot price near 0.84 of estimated mining cost pressures miners, but it has preceded both long bases and deeper flushes. Only the hash-ribbon reading, after the fact, tells you whether miners held or capitulated through it.
Can these charts predict a price by a date?
They describe conditions, not calendars. The source read them as $100,000 by Q1 2027, but no cycle metric carries a timetable. A threshold tells you how stretched the market is, never which quarter it resolves.
Why do you quote no historical frequency here?
Our cycle and valuation readings are model estimates that have not cleared their calibration gate, and no base rate is wired for this cohort. A number with no error bar is decoration, so we quote the reading and refuse the rate.
How far is today from prior cycle peaks?
Every prior cycle in our comparison peaked on MVRV between 2.79 and 6.03. Today reads 1.44, and the 90-day top-risk grade sits at 22 out of 100. The panel is well below its own top-marking lines.
Crypto trading involves substantial risk and is not suitable for everyone. Nothing here is financial advice; it is education only. Never risk more than you can afford to lose.
The private Extras feed, where the cycle-heat panel, the valuation gravity zone and the production-cost ratio update with their invalidation levels, is part of PRO Paradiser, the intelligence layer behind the ParadiseFamilyVIP strategies.












Join the discussion
No comments yet. Members, share how you are reading this.