

In short
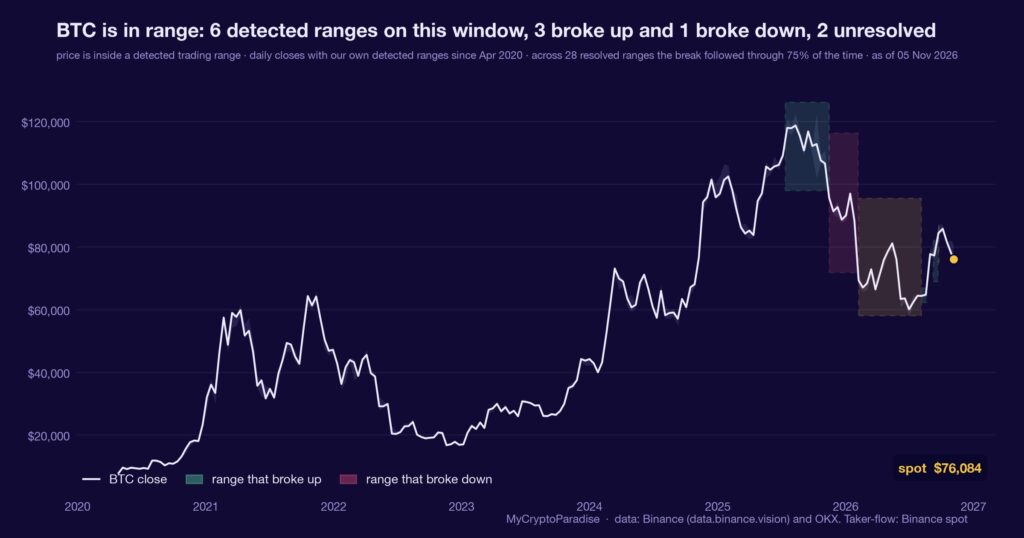
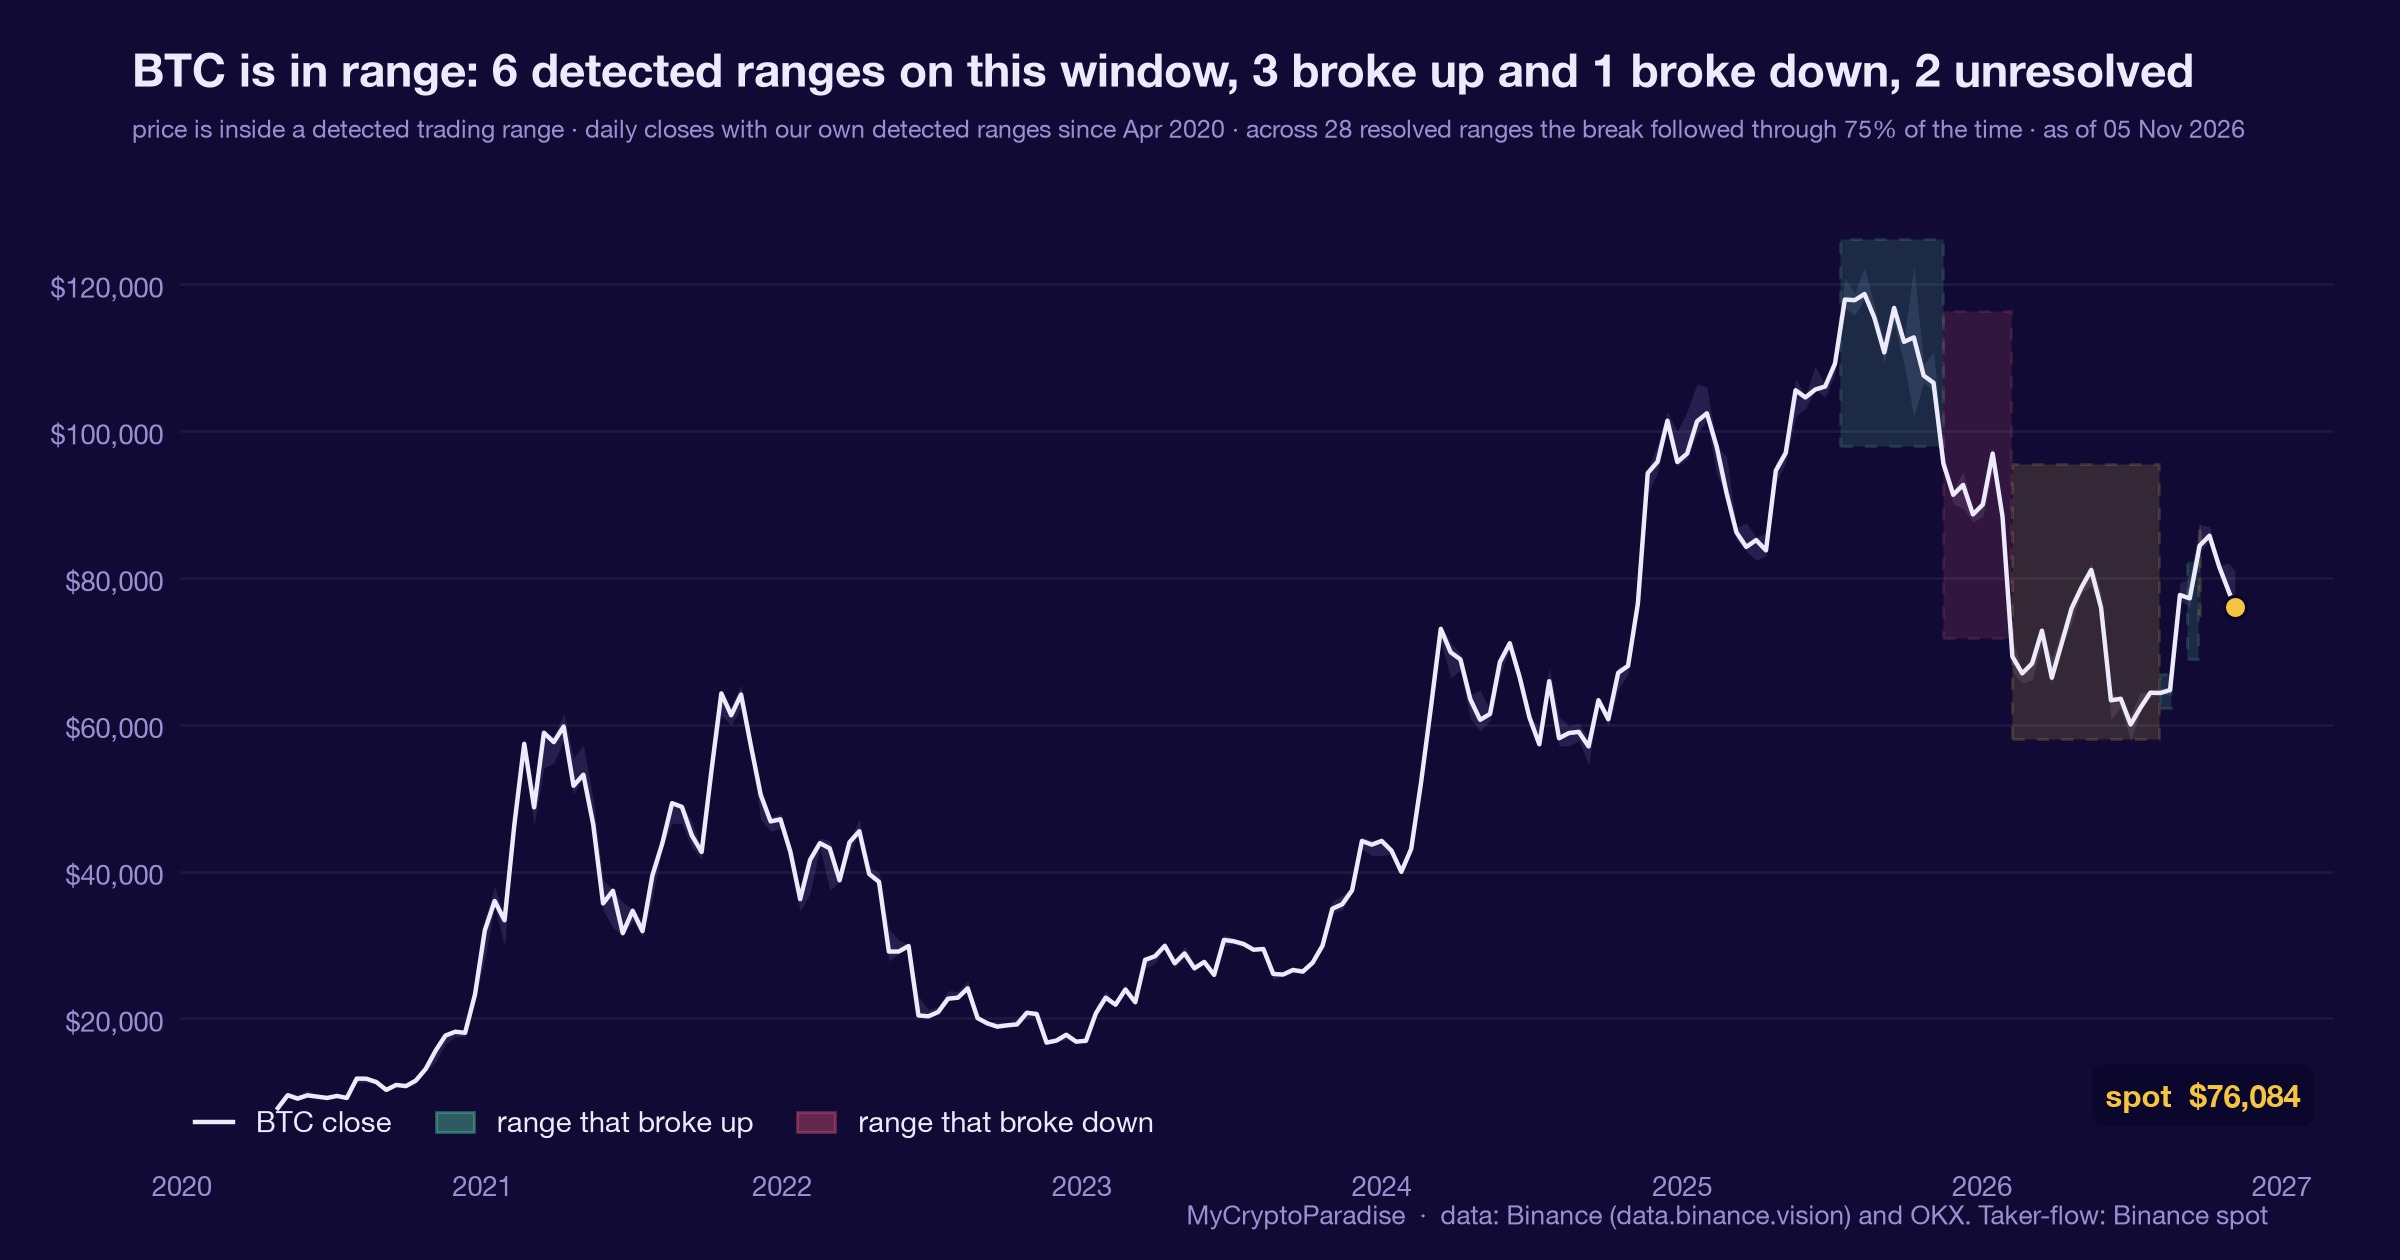
A detected trading range is a price band our model marks once buyers and sellers repeatedly turn price at the same two edges. On 5 November 2026 our MCP Insights range model puts Bitcoin at $76,084, sitting just above the lower edge at $74,955.5, with the upper edge at $87,399 and the band confirmed on 22 September. We read this as constructive while that floor holds, and we explicitly did not call it a bottom: a range is a container, not a direction. The feed’s order-flow split agrees, with spot buyers net positive while futures traders sell. The reading carries a model-estimate flag, so we quote no historical frequency, only the live geometry. Since the 22 September confirmation price has stayed inside the band, including the bounce from the 75,700 low. This piece shows you how to read a range floor yourself, and the one daily close that breaks it.
Key facts
- BTC price at the reading
- $76,084
- Range state
- price is inside a detected trading range
- Top of the current detected range
- $87,399
- Bottom of the current detected range
- $74,956
- What would prove this read wrong
- A daily close below the lower range edge at $74,955.5, or spot CVD rolling net negative while futures selling re-accelerates past minus $4.26B.
- Reading taken
- 05 November 2026
- Source
- Our MCP Insights tools, from Binance (data.binance.vision) and OKX. Taker-flow: Binance spot. Upstream data published by Binance public market data
A range is a container, not a call
A detected trading range is what our model draws after price turns away from the same high and the same low enough times that both edges stop being accidents. The band is a map of where buyers and sellers have agreed to fight, nothing more.
Inside that band, order flow tells you who is doing the fighting. Spot cumulative volume delta (CVD) tracks whether market buyers or market sellers are winning on the cash exchanges, and futures CVD does the same for leverage. When the two disagree, one cohort is absorbing the other.
A range that still contains price is information. A range someone insists must break is a wish wearing a chart.
Where the floor actually sits today
On 5 November 2026 our MCP Insights range model places Bitcoin at $76,084, roughly $1,100 above the lower edge at $74,955.5 and well beneath the upper edge at $87,399. The band was confirmed on 22 September, and price has just bounced from the $75,700 low back toward the floor it is now testing.
The feed’s order flow frames the same spot. Spot CVD reads plus $222.4M, net buying but softer than the prior plus $399.5M, while futures CVD reads minus $3.33B, heavy selling that has recovered from minus $4.26B.
The combined delta is minus $23.8M, a slight seller edge. These order-flow figures are the source feed’s; our own tools confirm the price and the range, not the deltas.
Our liquidation model adds the fuel picture: about $19.5B of estimated fuel rests above spot against $11.26B below, roughly 1.7 to one, upside-skewed. Over 24 hours $81.7M liquidated, 54 percent of it longs.
A floor is only a floor while buyers keep showing up to defend it. The order flow is how you watch them do it, trade by trade.
What is different here
The ParadiseTeam does not treat a bounce as a bottom or a single green delta as demand. We mark the range edges first, then watch spot and futures order flow fight at them, and we publish the daily close that would prove our constructive lean wrong.
The bounce is not the bottom
The obvious misread is that a bounce off $75,700 and net spot buying mean the low is in. It does not. Spot demand has softened, from plus $399.5M to plus $222.4M, and futures are still selling three billion dollars net.
Place this where it belongs. The range read is one input: it sits alongside the fuel map, the order-flow split and the squeeze gauge, and today it mostly agrees with them that price is pinned to the lower third of its band.
A read that only quotes the buying half of the delta is marketing. The selling half is what sizes the risk.
Spot is absorbing, and here is the line
The measurable asymmetry is this: spot buyers are absorbing a far larger futures sell flow, and price has held the floor through it since the $75,700 low. That is a statement about who is defending the edge right now, not about where price goes next.
The larger liquidation pocket, roughly 1.7 to one, also sits above spot, which is where forced short covering would feed a move if the floor holds. It stops being the constructive reading on a daily close below $74,955.5.
The probability shifted; it did not resolve. A held floor with buyers underneath is a lean, worth exactly one line of risk.
What turns the floor into a launch
For the constructive lean to earn more than one line of risk, price needs to do more than hold: spot CVD has to stop softening and turn back up while futures selling keeps shrinking, the way it already has from minus $4.26B to minus $3.33B.
The upper edge at $87,399 is the range ceiling, roughly fifteen percent away, and nothing in today’s flow argues price is leaving the lower third soon. The band is wide, and most of it is empty air between two defended edges.
Ranges resolve when one edge stops being defended. Until then, the honest trade for most is to watch the edge, not to front-run it.
Reading a range floor yourself, step by step
- Find the detected range edges and note the lower one; today that floor sits at $74,955.5 on our model.
- Mark where price sits inside the band, not just its distance from the low but its distance from the ceiling.
- Pull spot cumulative volume delta and futures delta separately, and read them against each other rather than as one line.
- Watch whether spot buying is absorbing futures selling at the edge, or whether both are leaving the floor together.
- Write down the daily close that would break the floor before you form any lean, not after.
The step people skip is the last one: setting the invalidating close before they have a view, so the level defines the lean instead of the lean excusing the level.
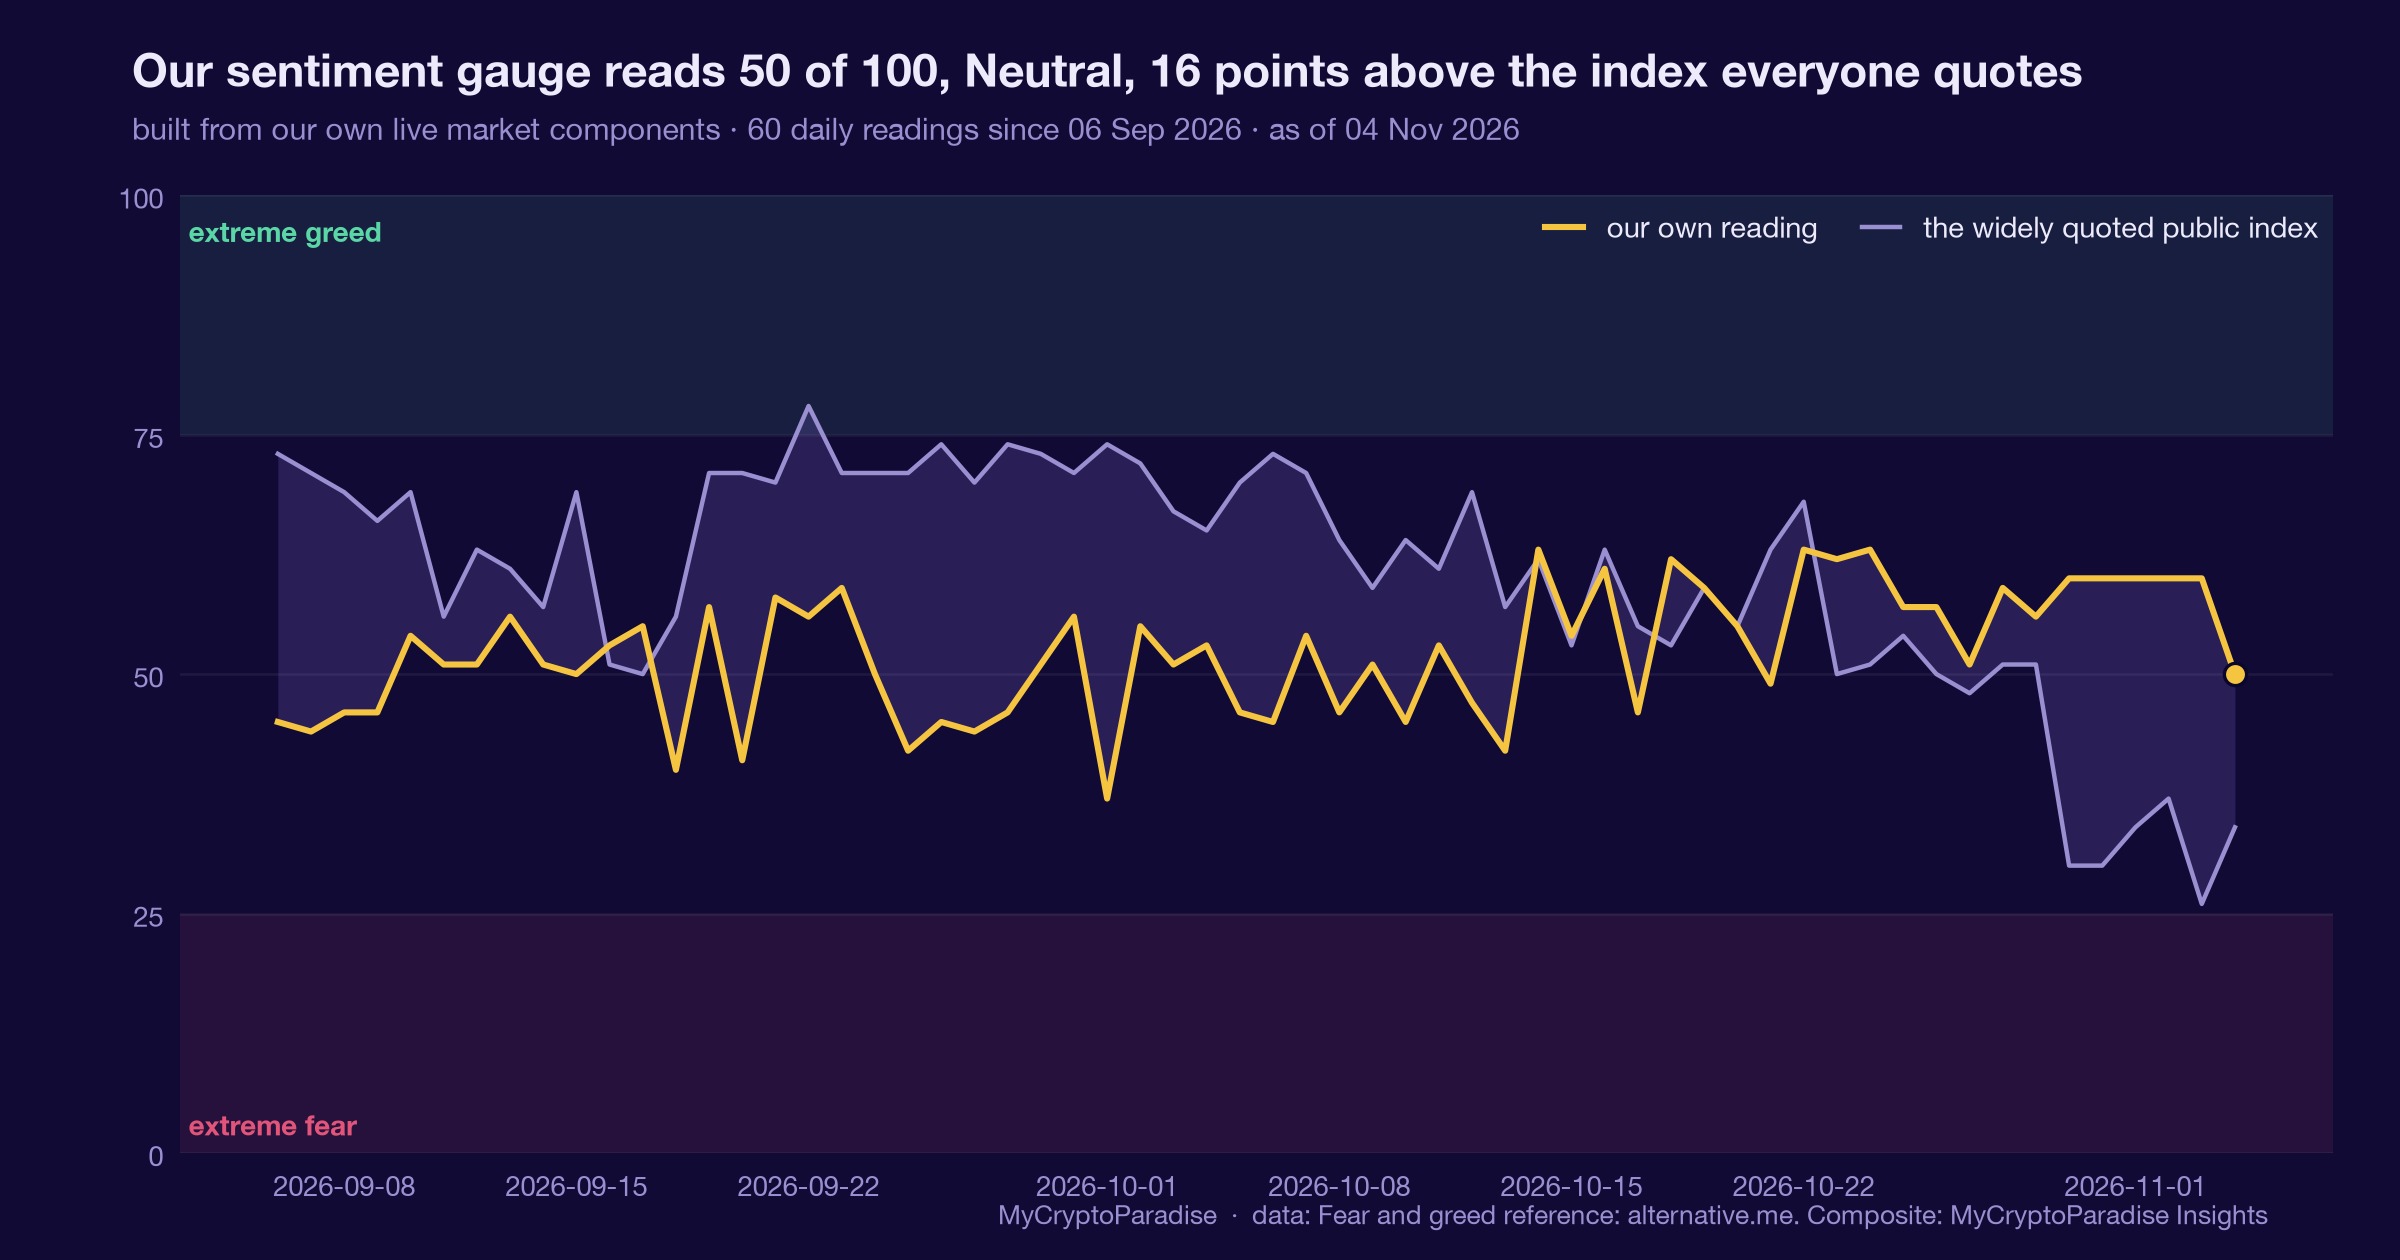
Every number above is checkable against the live data. Start with the MCP Insights hub, then cross-read the Crypto Fear and Greed Index and the live crypto funding rates.
Act and invalidate
| Scenario | What confirms it | What kills it |
|---|---|---|
| Floor holds, spot absorbs | Spot CVD turns back up at edge | Daily close below $74,955.5 |
| Chop in the lower third | Price caps under mid-band | Sustained push past $87,399 |
| Floor fails | Daily close below $74,955.5 | Reclaim and hold above $76,000 |
Posture: The constructive lean is a defensive one while price sits in the lower third of the range. The highest-probability stance for most is to watch the $74,955.5 floor, not to pre-position for a break either way.
Frequently asked questions
What is a detected trading range?
It is a price band our model marks once buyers and sellers repeatedly reverse at the same two edges. On 5 November it spans $74,955.5 to $87,399 for Bitcoin, and price sitting inside it says where, not which way.
What does the spot versus futures CVD split mean?
Cumulative volume delta measures whether market buyers or sellers dominate. Spot reads plus $222.4M while futures read minus $3.33B, so cash buyers are absorbing leverage sellers. When those two disagree, one cohort is paying to be on the other side.
Is the $75,700 bounce the cycle low?
We do not claim that. A bounce off $75,700 and net spot buying show the floor was defended once, not that it cannot break. Spot demand has already softened from plus $399.5M to plus $222.4M, which is why we size it as a lean.
What would invalidate the constructive lean?
A daily close below the lower range edge at $74,955.5. That close would drag the read from constructive to broken, regardless of where spot CVD prints, because the whole lean rests on the floor holding. One line, clearly drawn.
Why quote no historical frequency here?
The range and liquidation readings both carry a model-estimate flag that has not cleared calibration, and no base rate is wired for this setup. Quoting a frequency would dress an estimate as evidence, so we show the live geometry instead.
Crypto trading involves substantial risk and is not suitable for everyone. Nothing here is financial advice; it is education only. Never risk more than you can afford to lose.
The private Extras feed, where the range map, the spot-versus-futures order flow and the liquidation fuel update with their invalidation levels, is part of PRO Paradiser, the intelligence layer behind the ParadiseFamilyVIP strategies.









Join the discussion
No comments yet. Members, share how you are reading this.