

MCP Extras Free
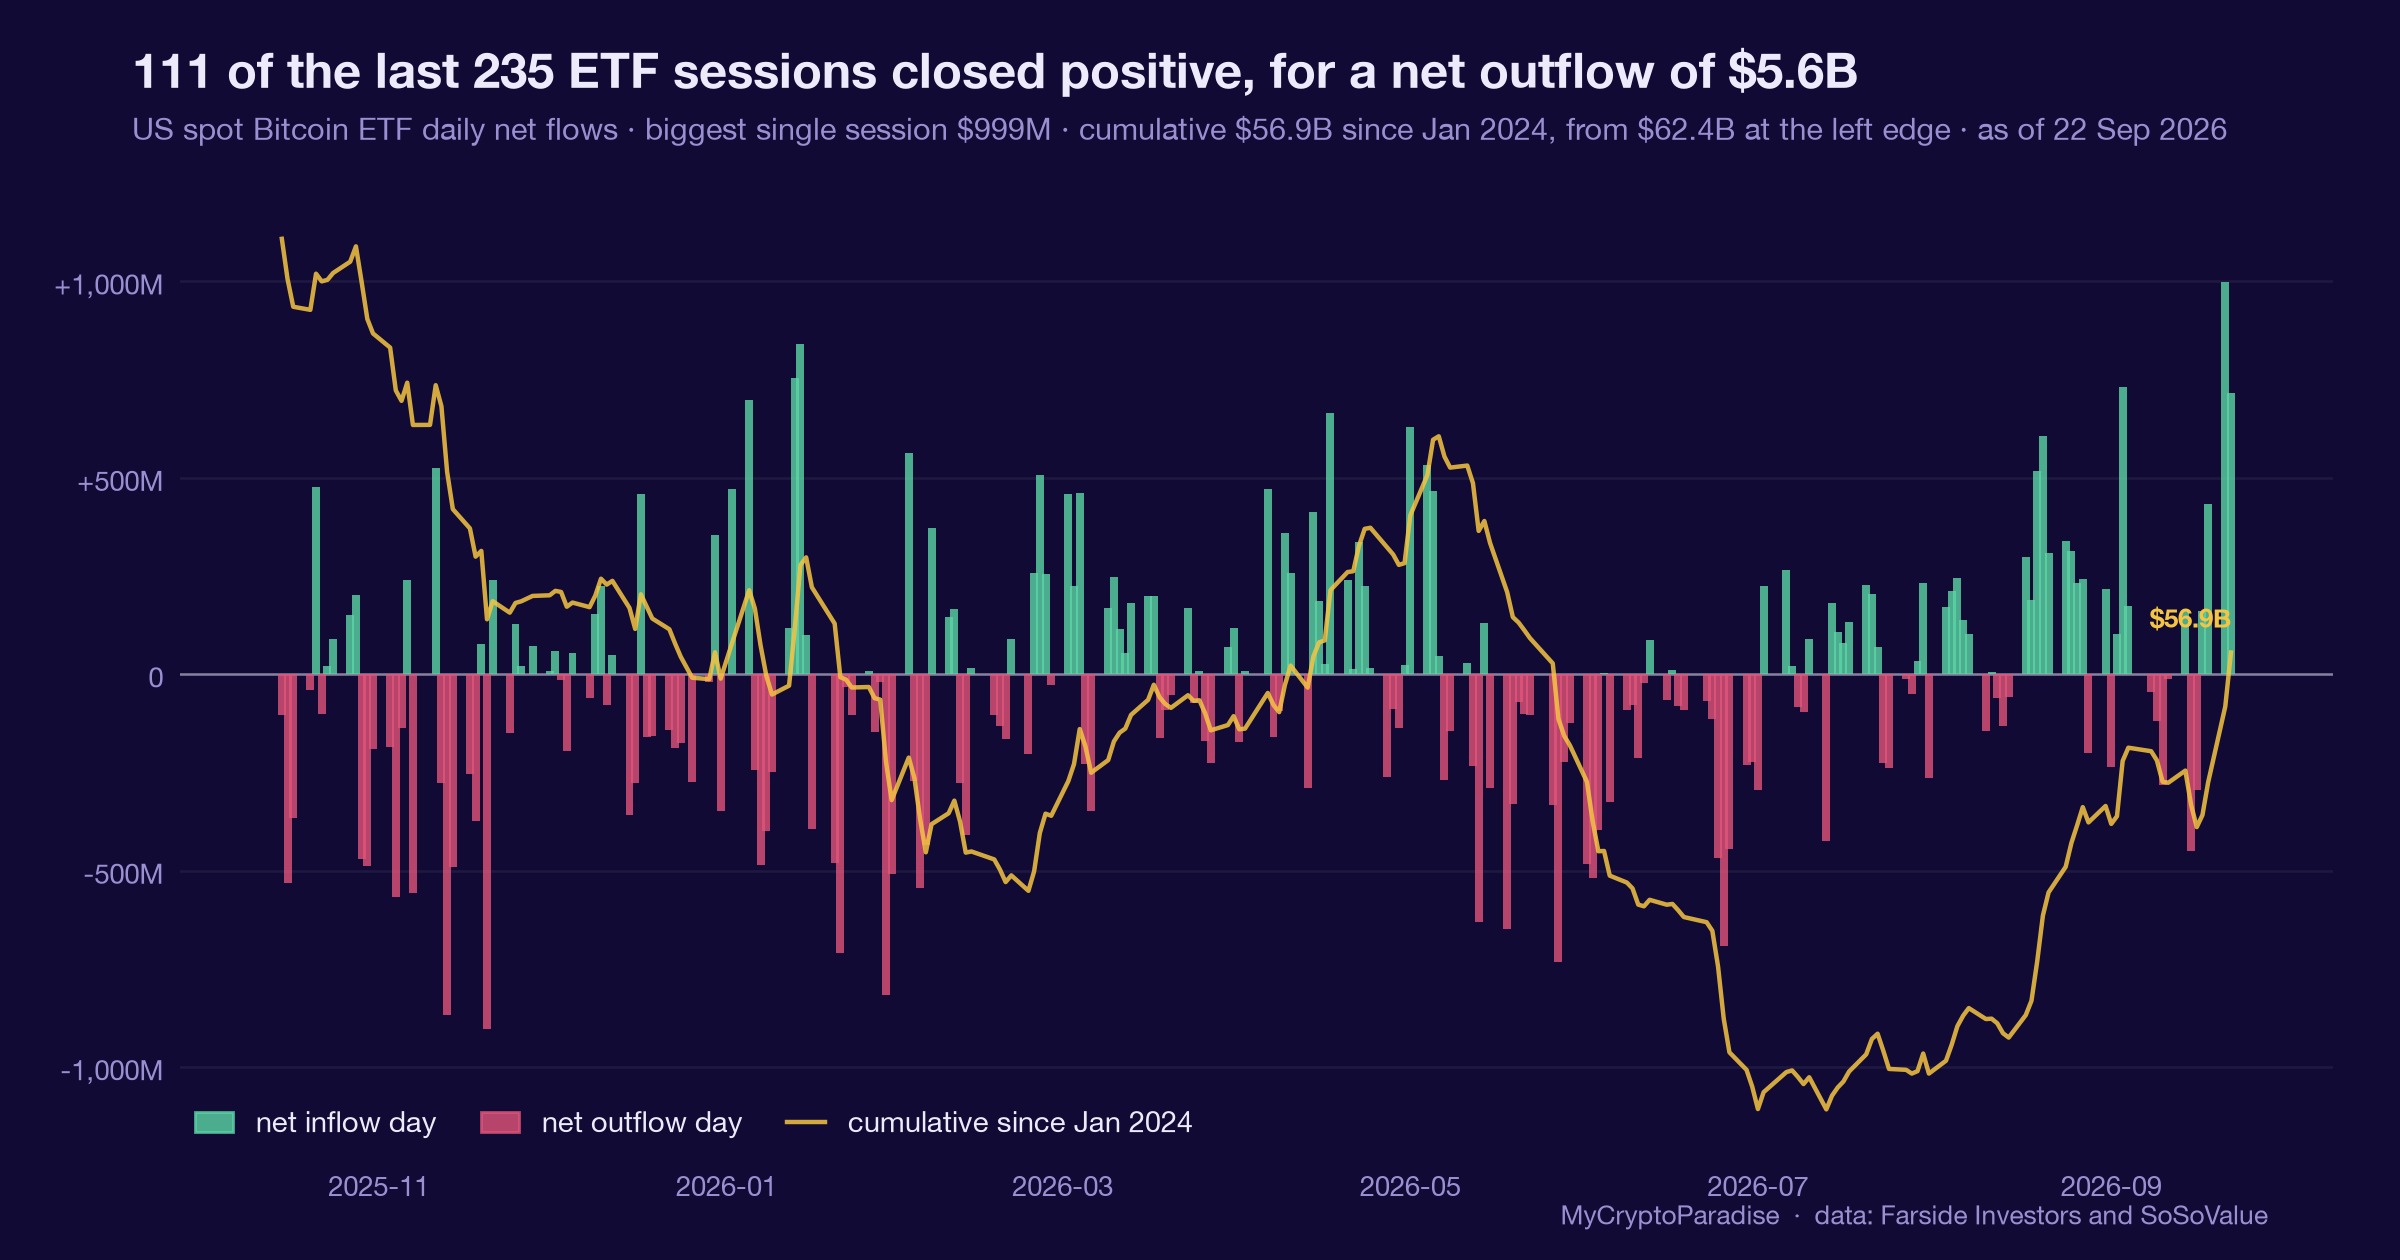
Bitcoin ETF inflows hit a 97th-percentile impulse: flows and price finally agree
Bitcoin ETF inflows hit a 97th-percentile impulse on 22 September, yet our tide grade holds at 53. How to read force versus a durable edge.
Bitcoin ETF inflows hit a 97th-percentile impulse on 22 September, yet our tide grade holds at 53. How to read force versus a durable edge.
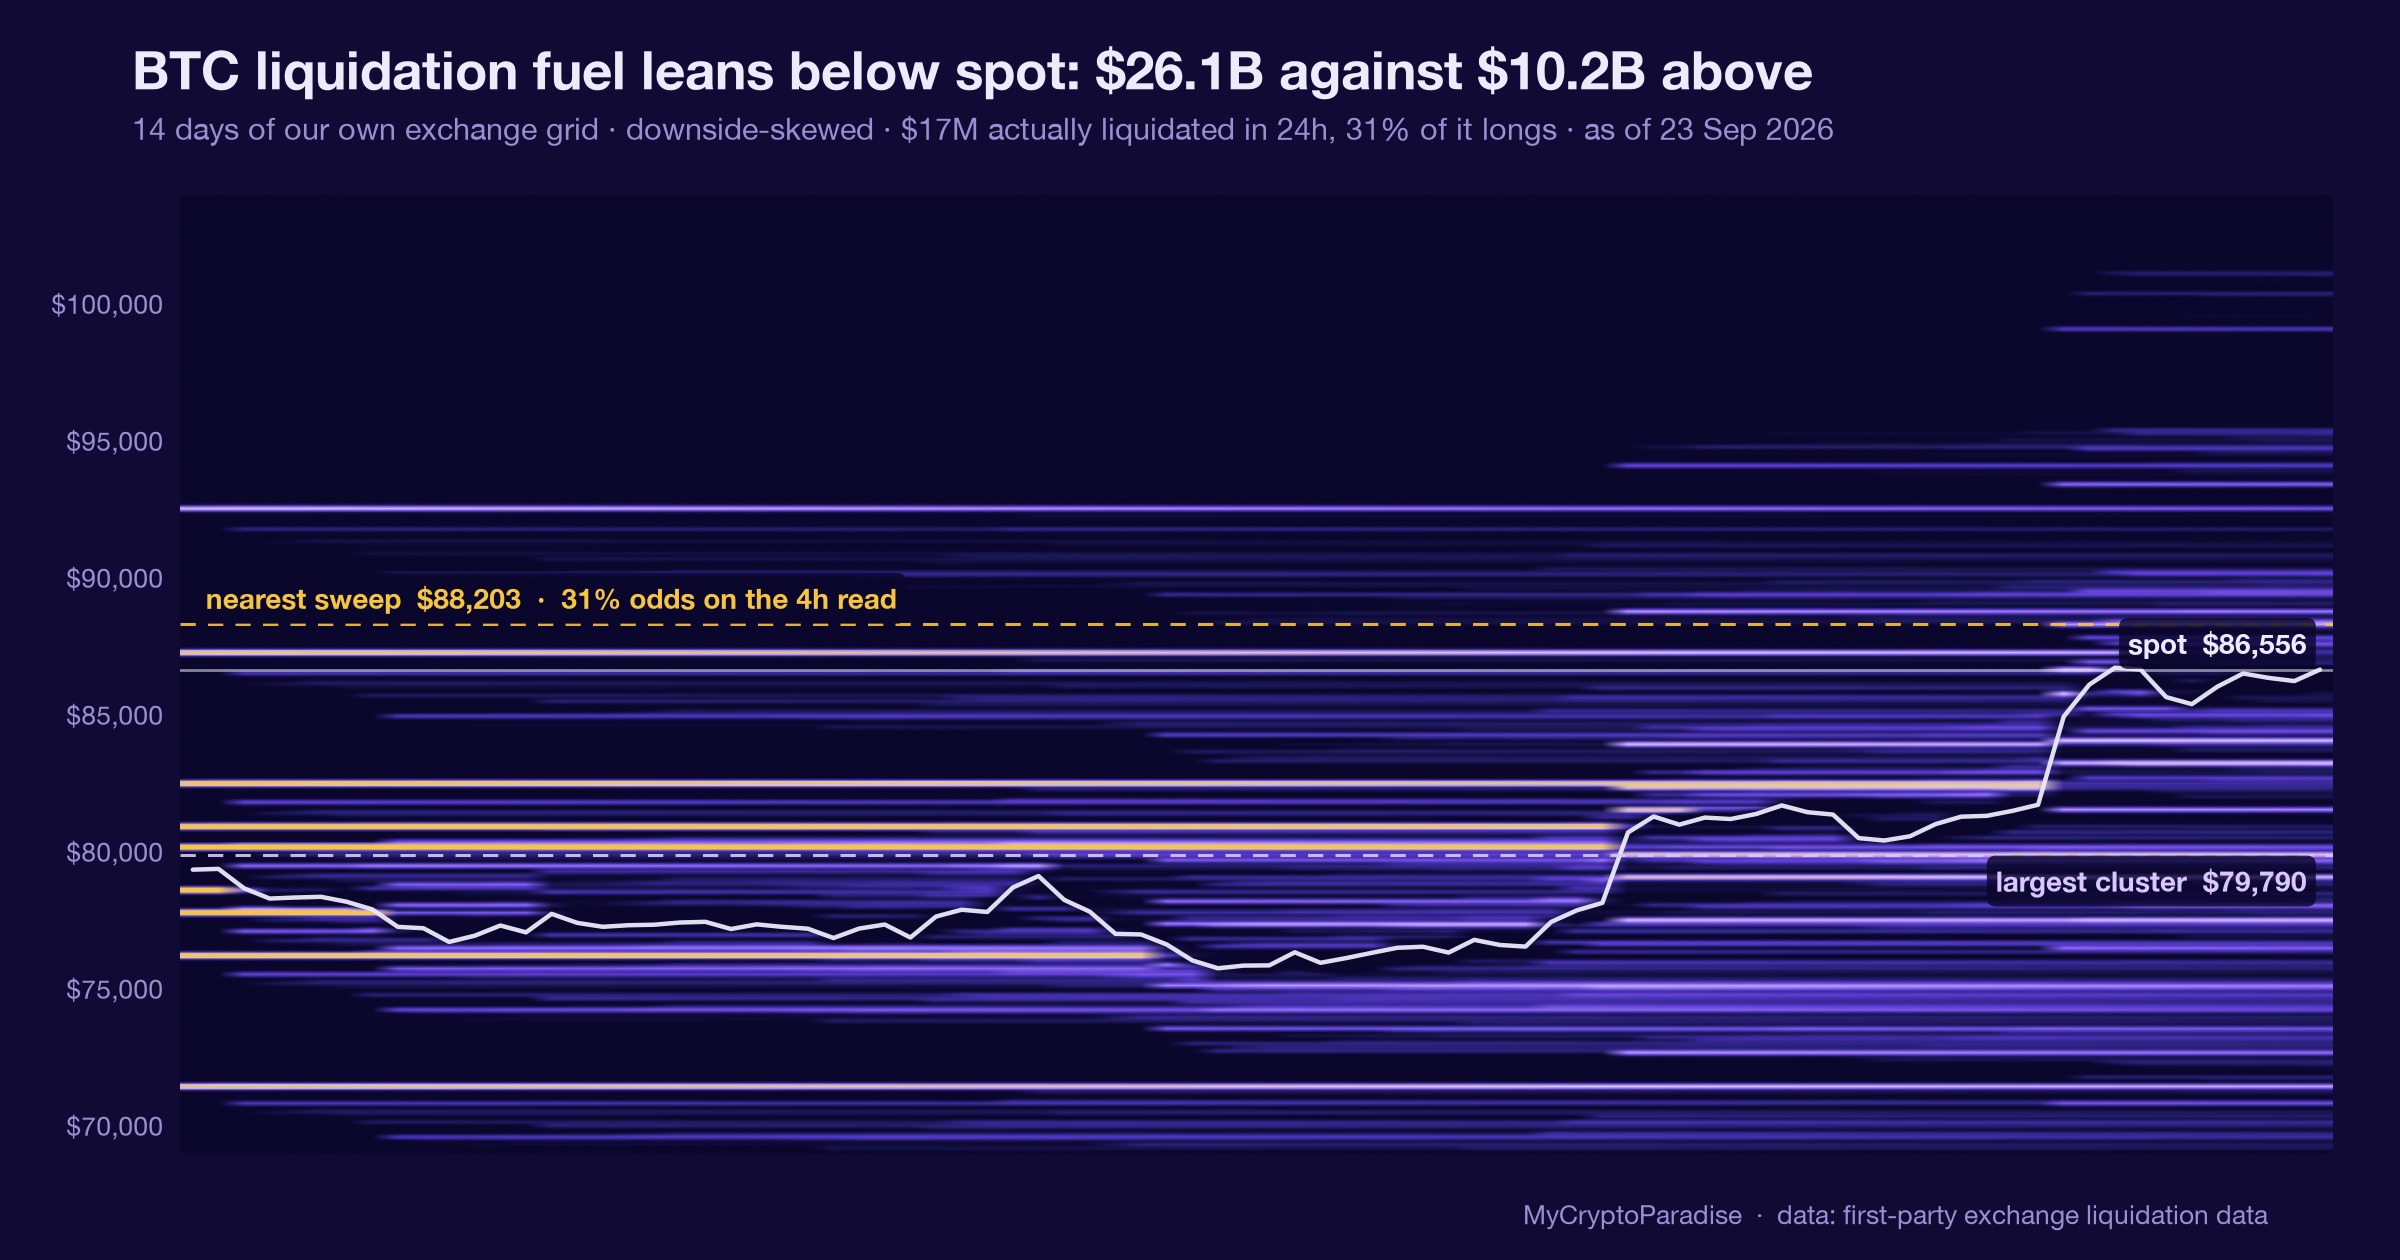
BTC liquidation fuel sits 2.5 to 1 below on 23 September 2026, a model estimate we read as defensive, with the level that flips it.
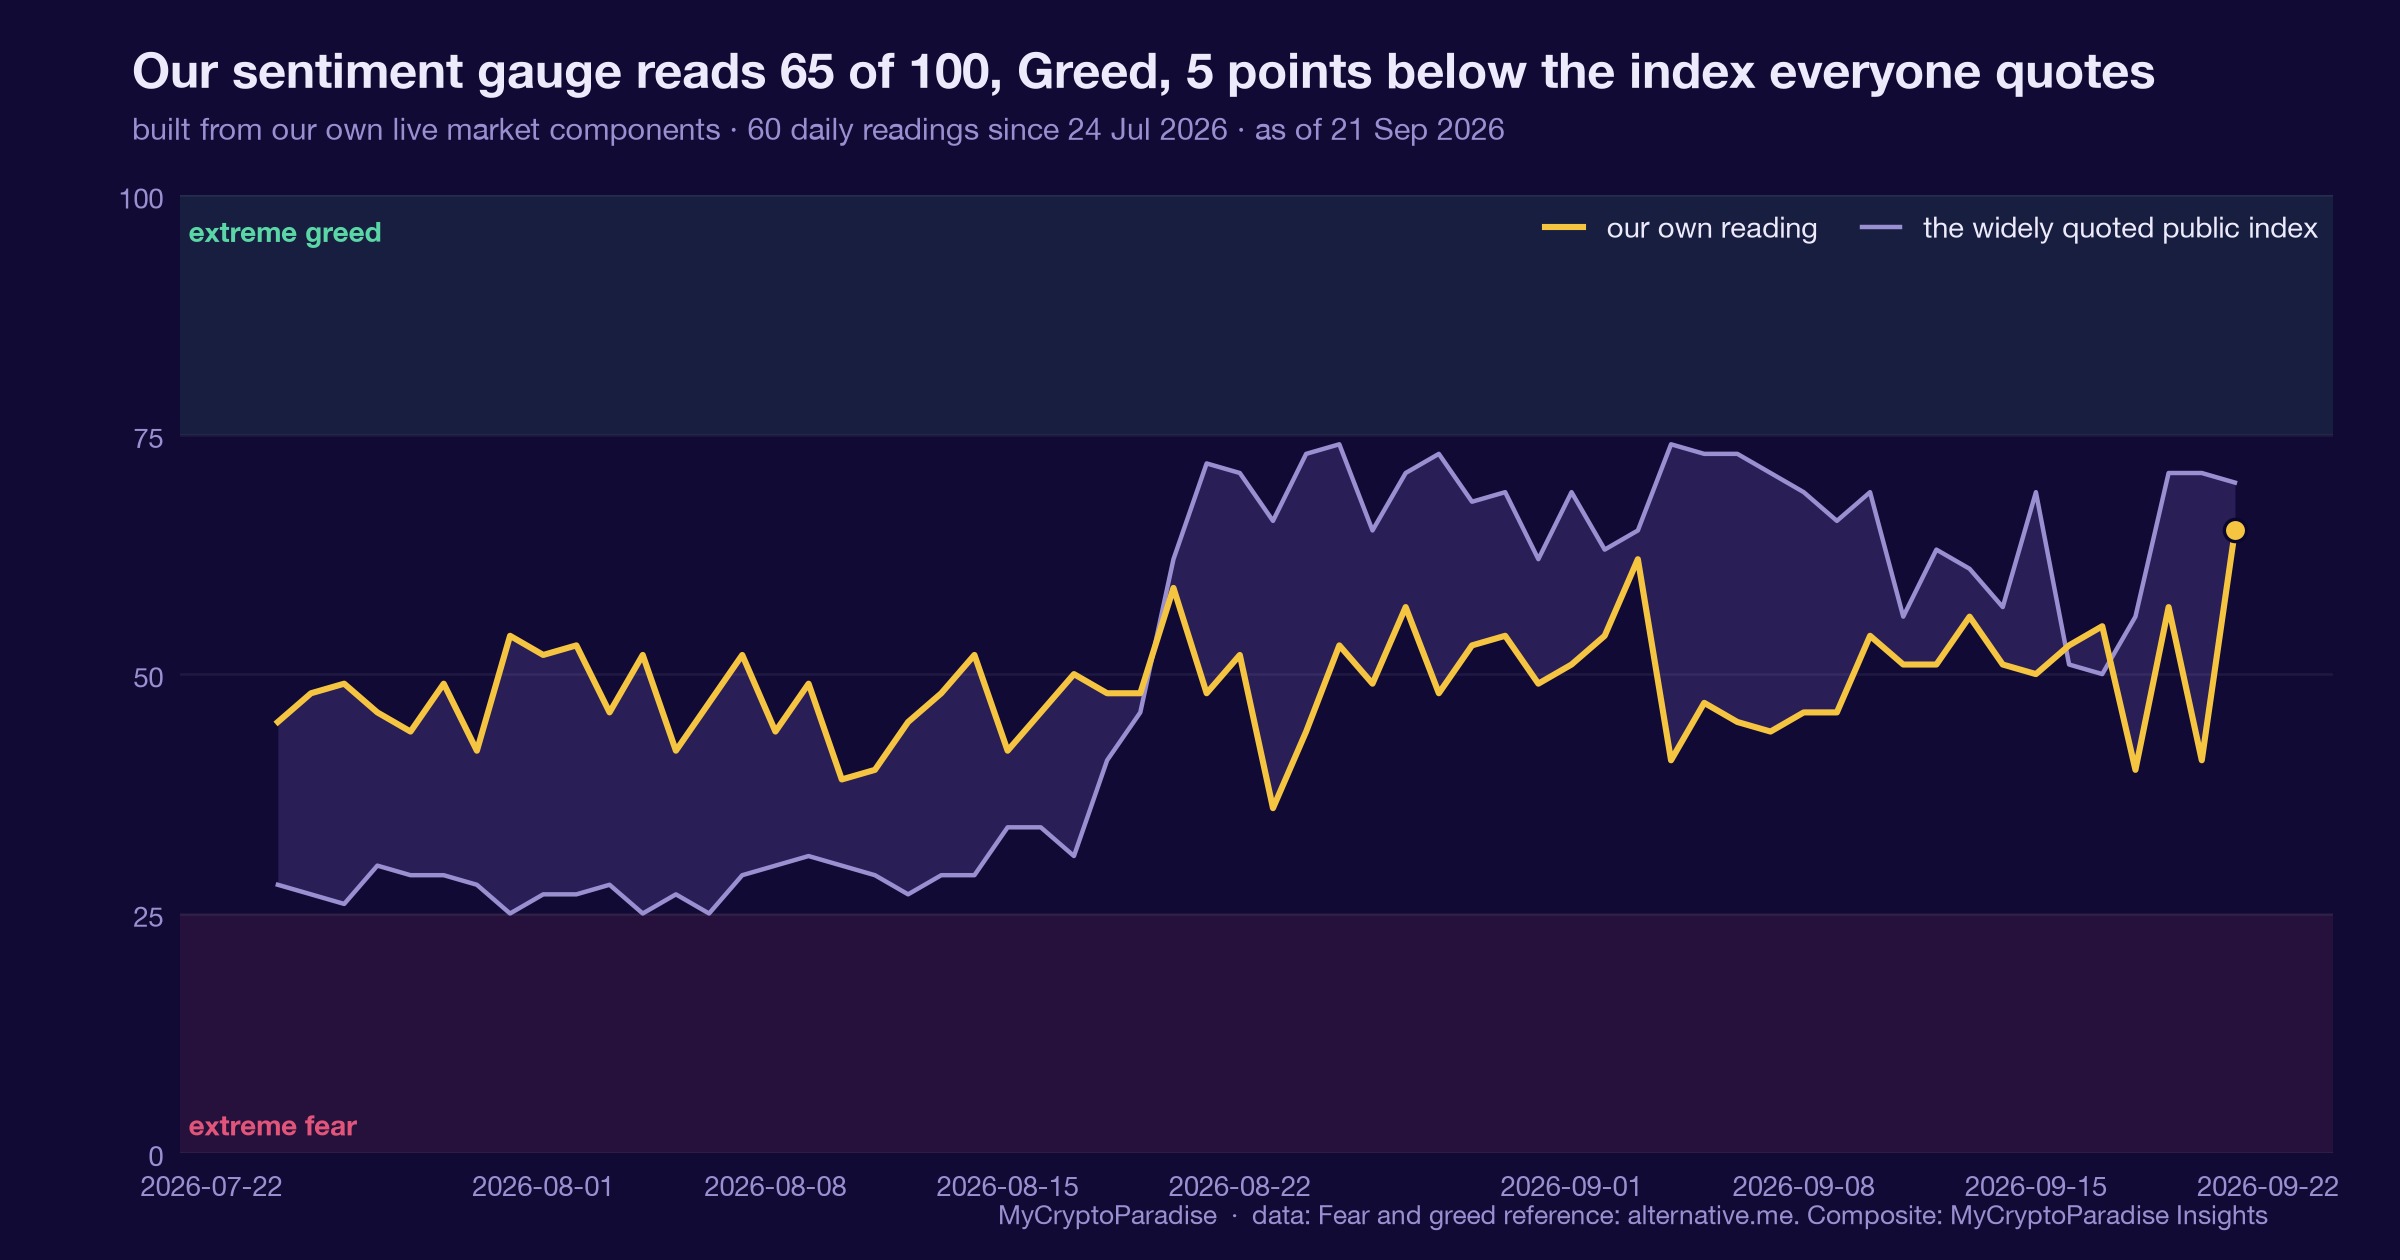
Bitcoin’s Fear and Greed Index hit 65 on 21 September 2026. Why mid-greed is the flattest band in the history, and how to read it.
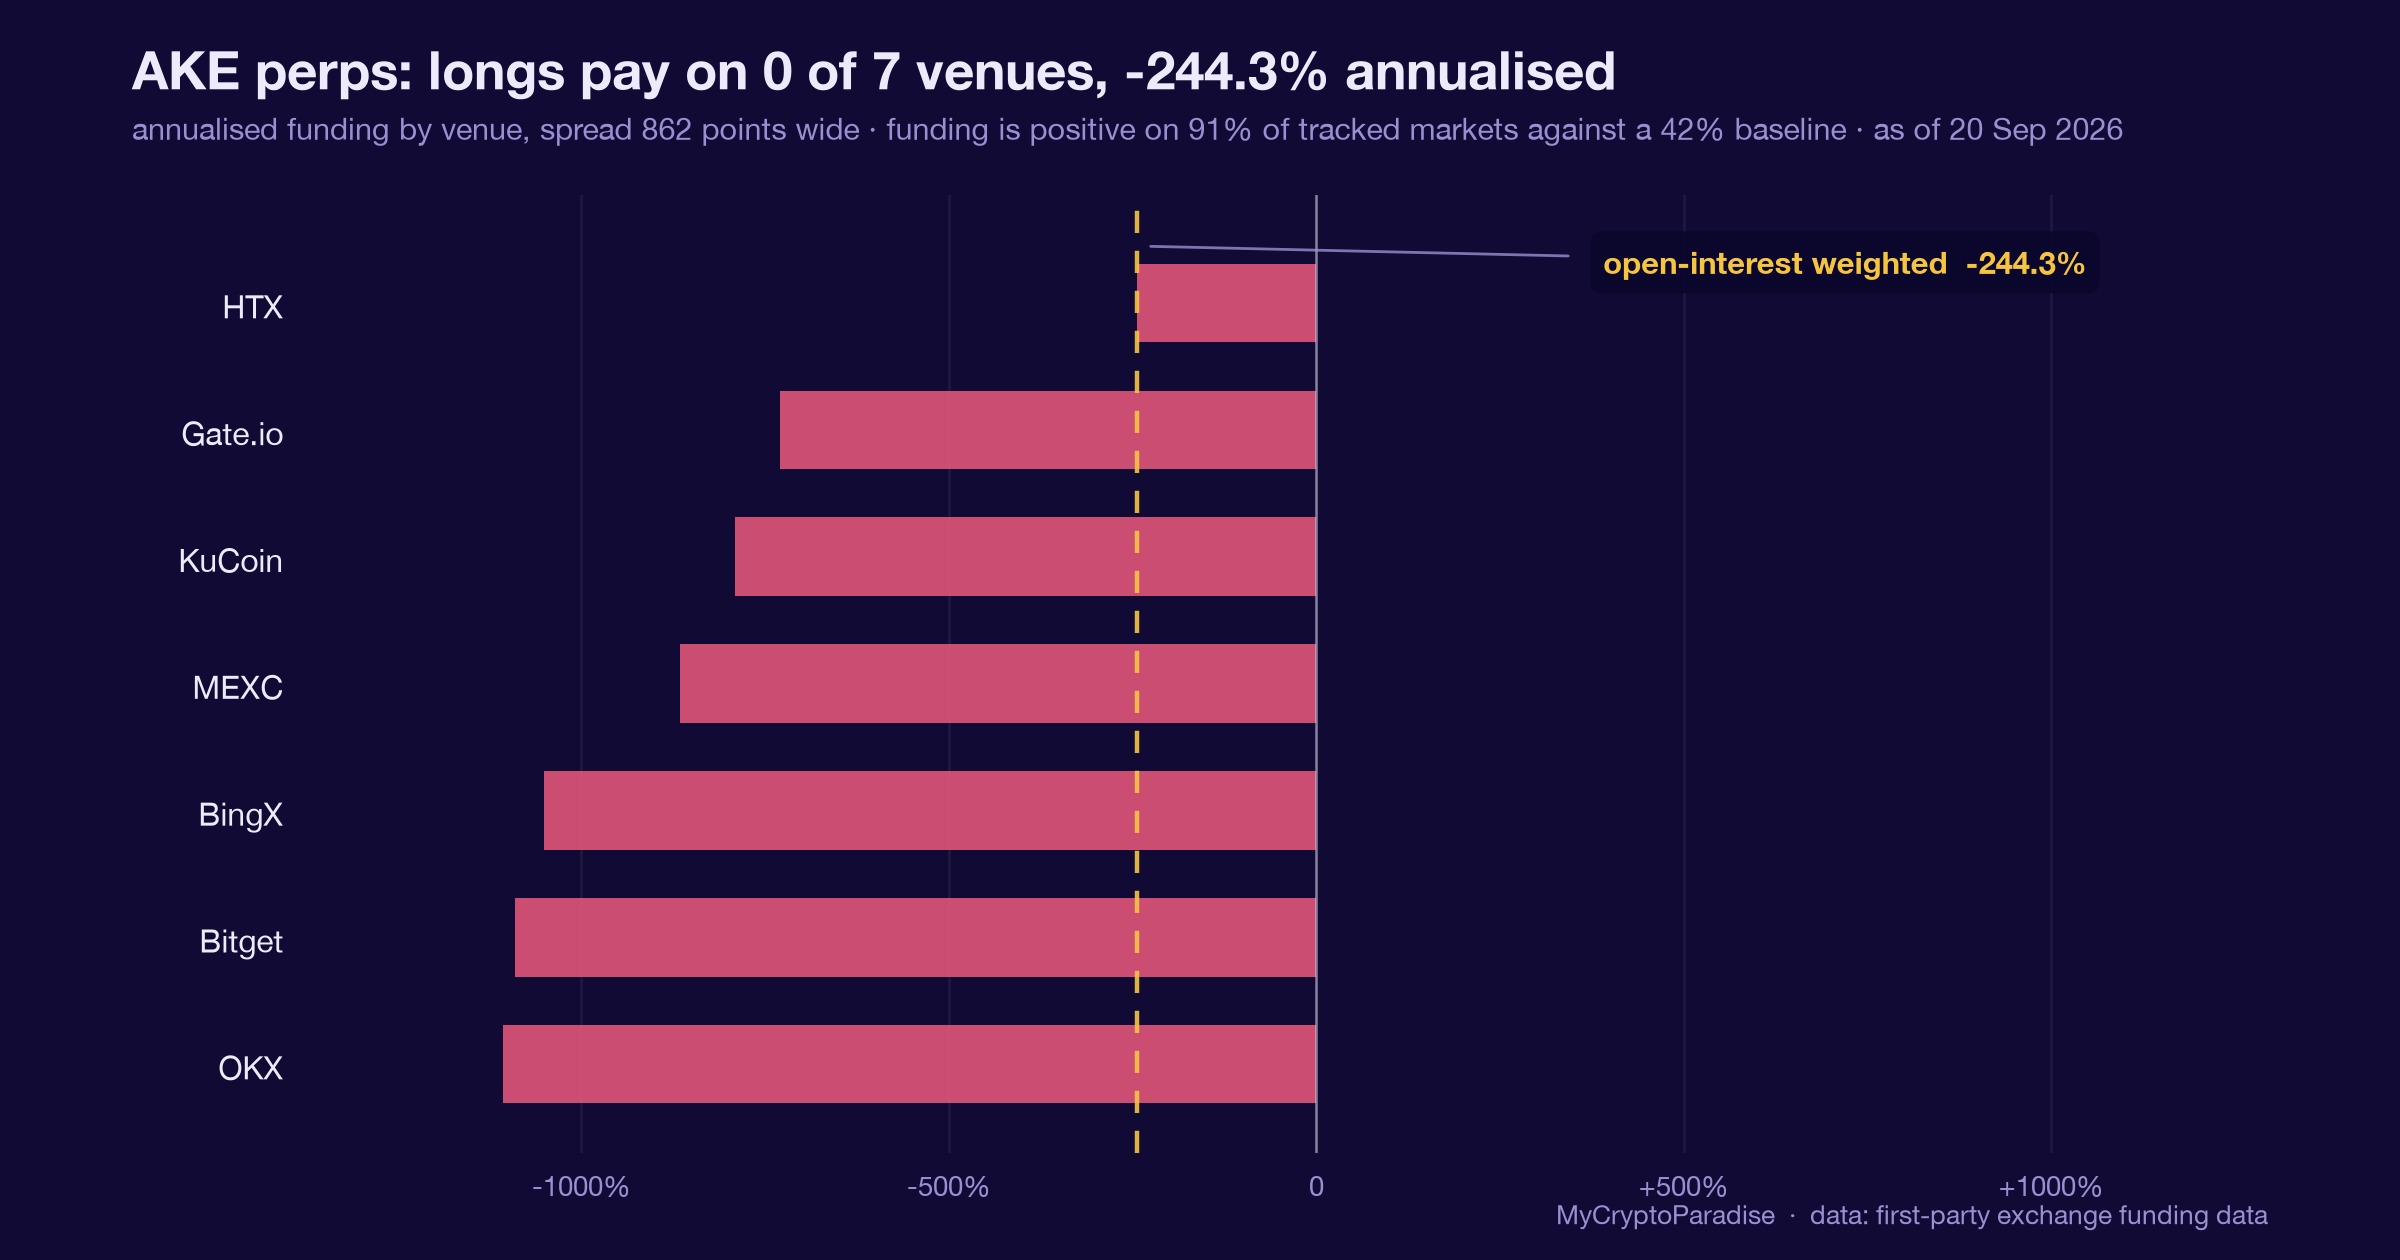
AKE printed the market’s most negative funding on 20 September 2026: minus 244 percent. How to read a funding extreme and what invalidates it.
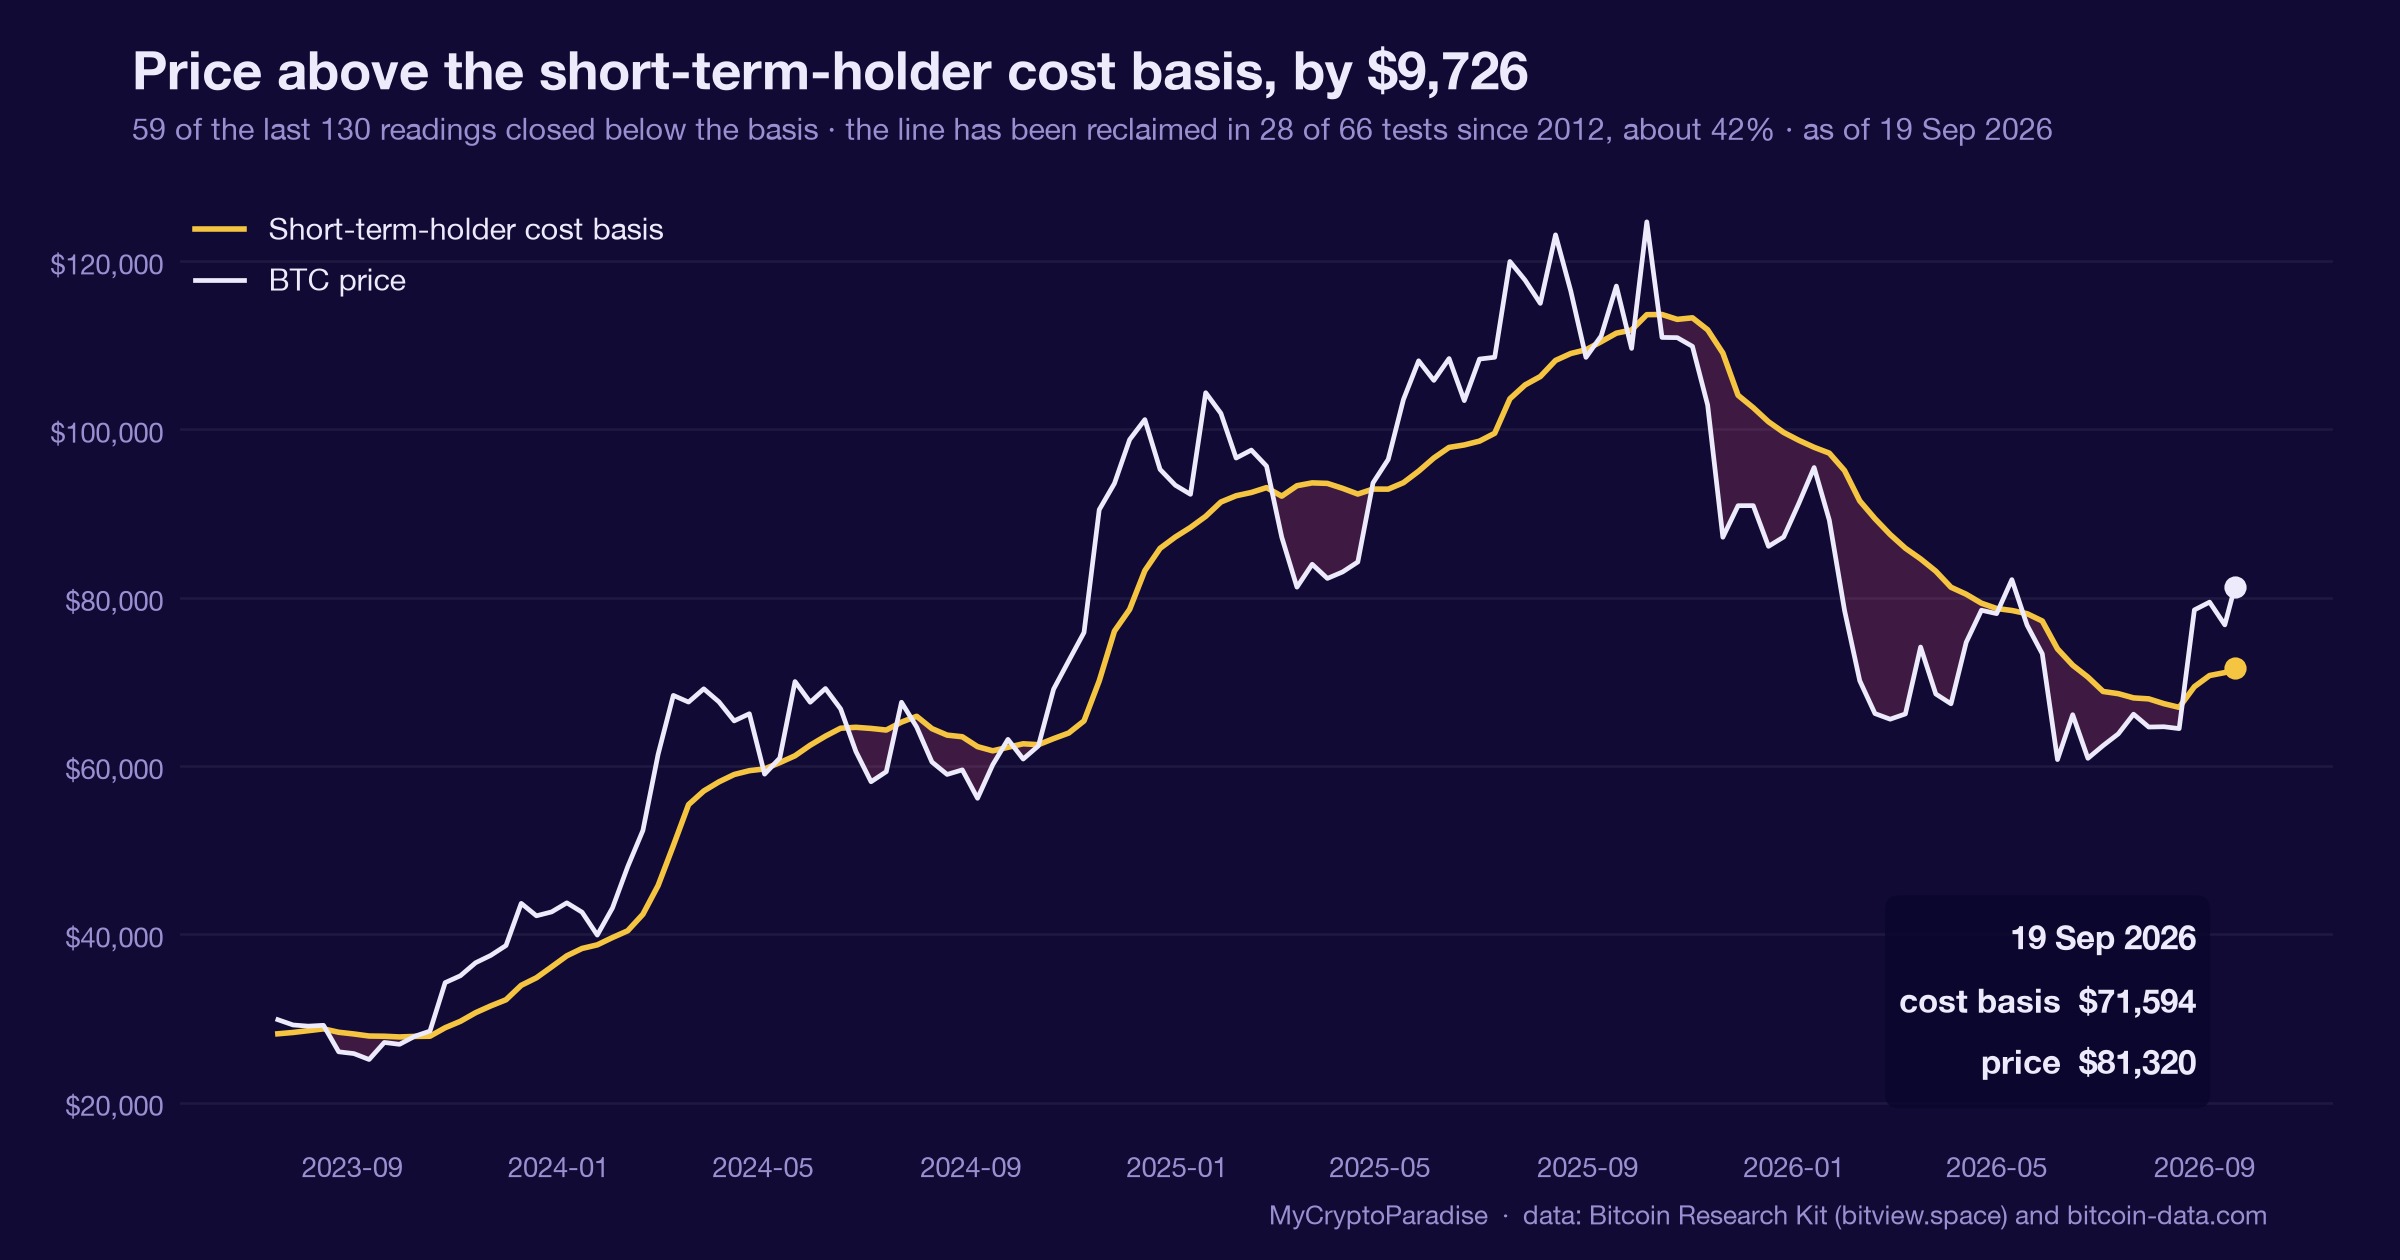
Bitcoin’s short-term cost basis sat 8.82 ATR below spot on 19 September 2026: how to read the cushion, the loss share and the SOPR caveat.
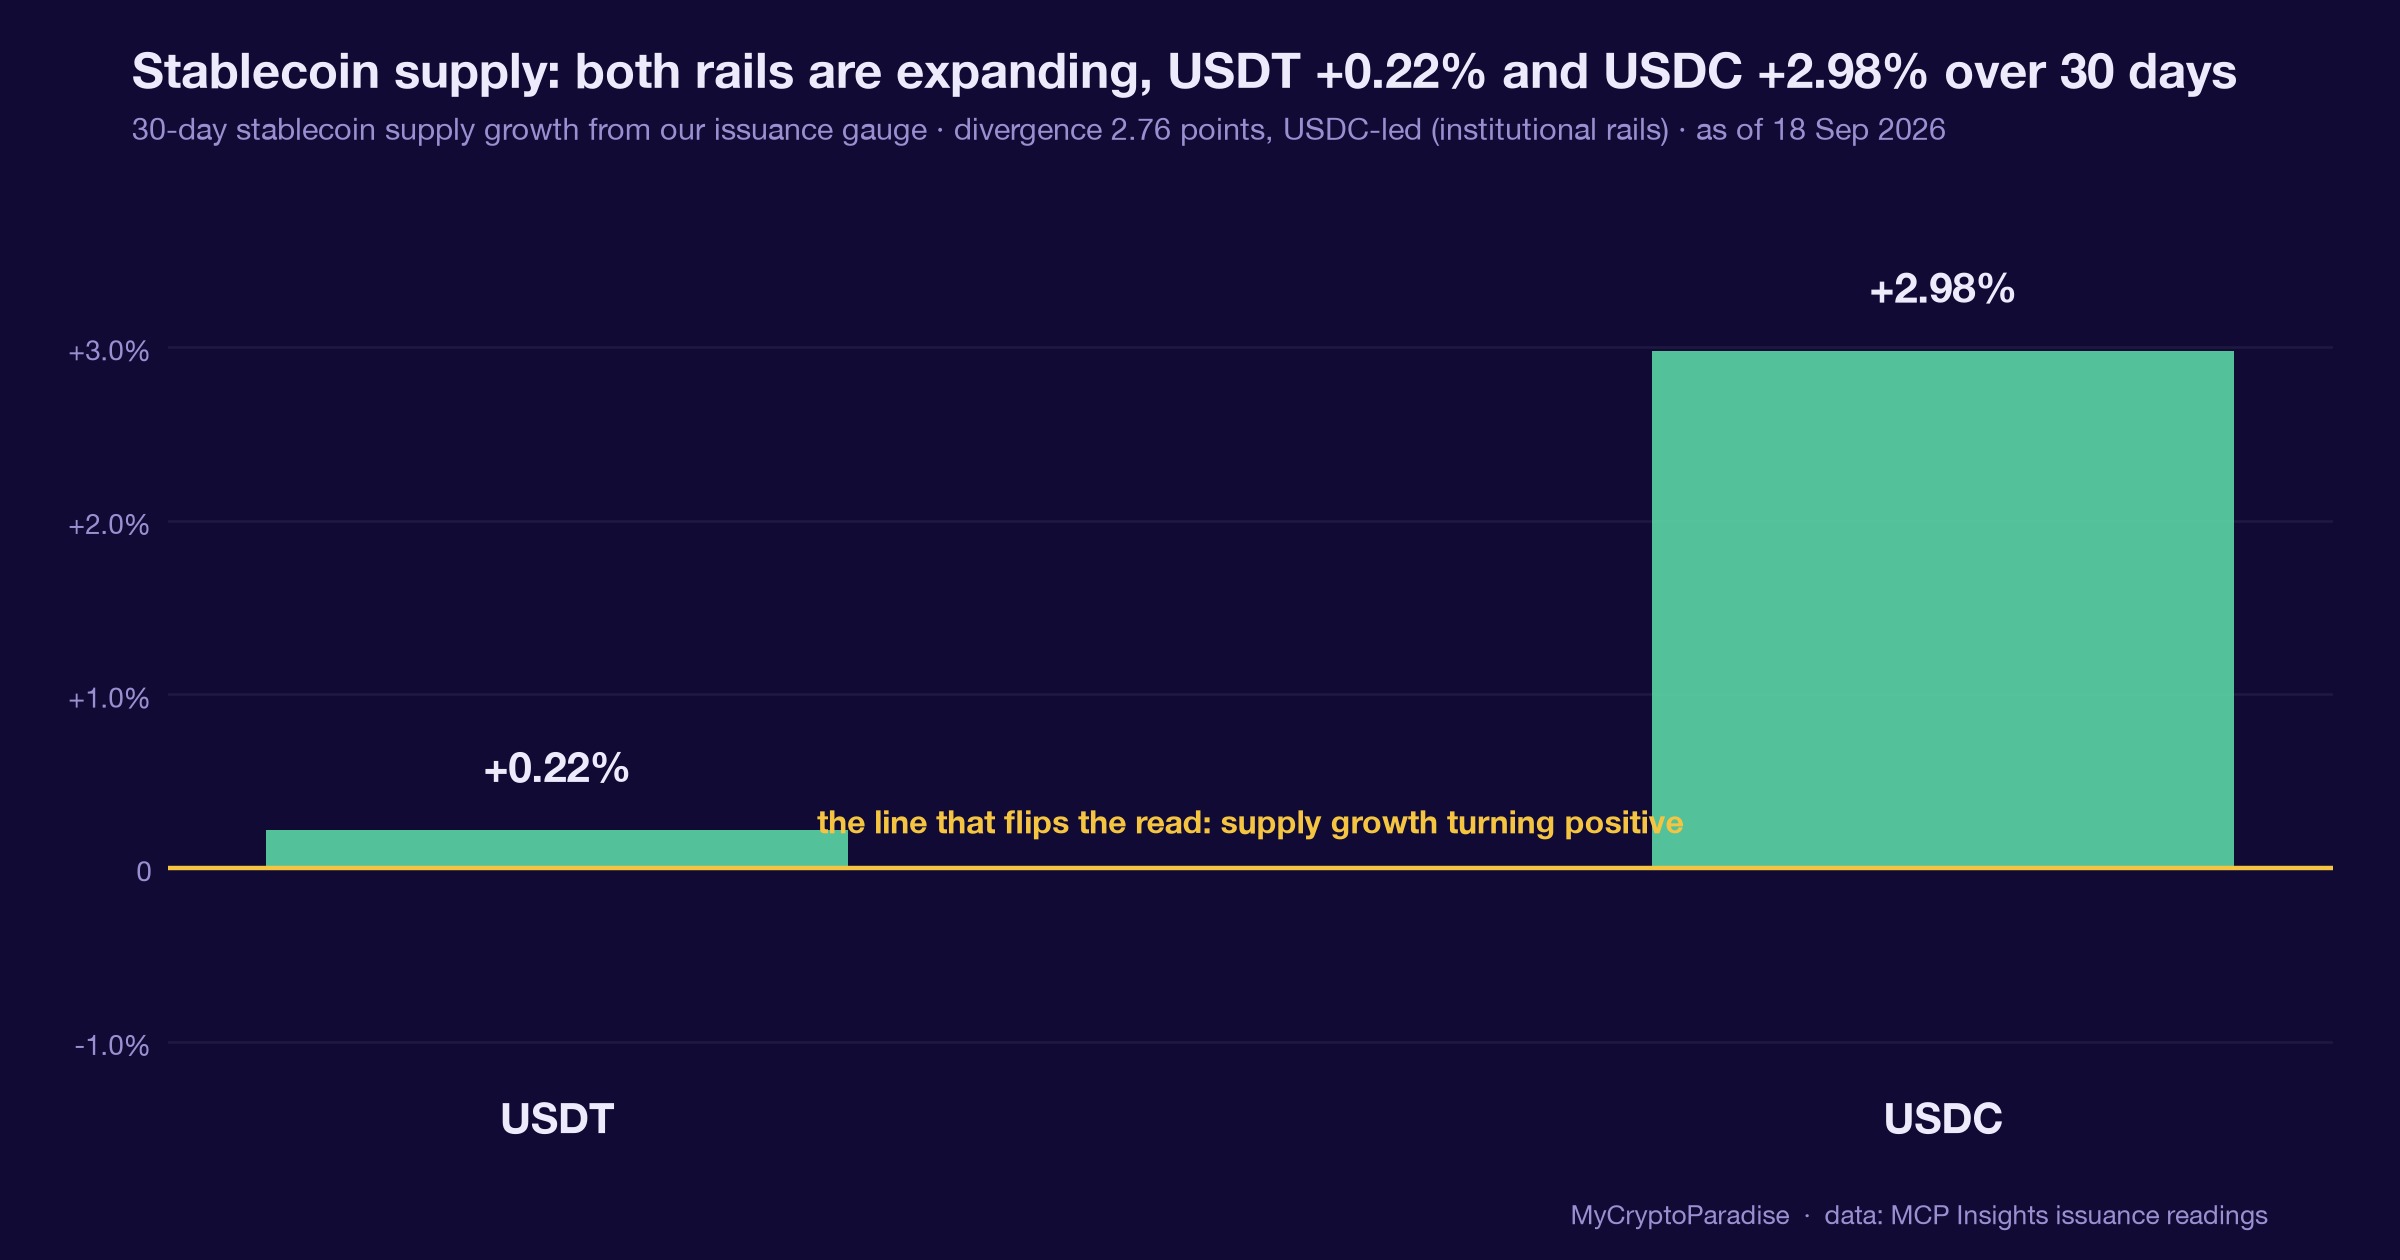
Stablecoin turnover is cooling while USDC supply keeps expanding. We read the split, name the invalidation, and refuse to call it a top.
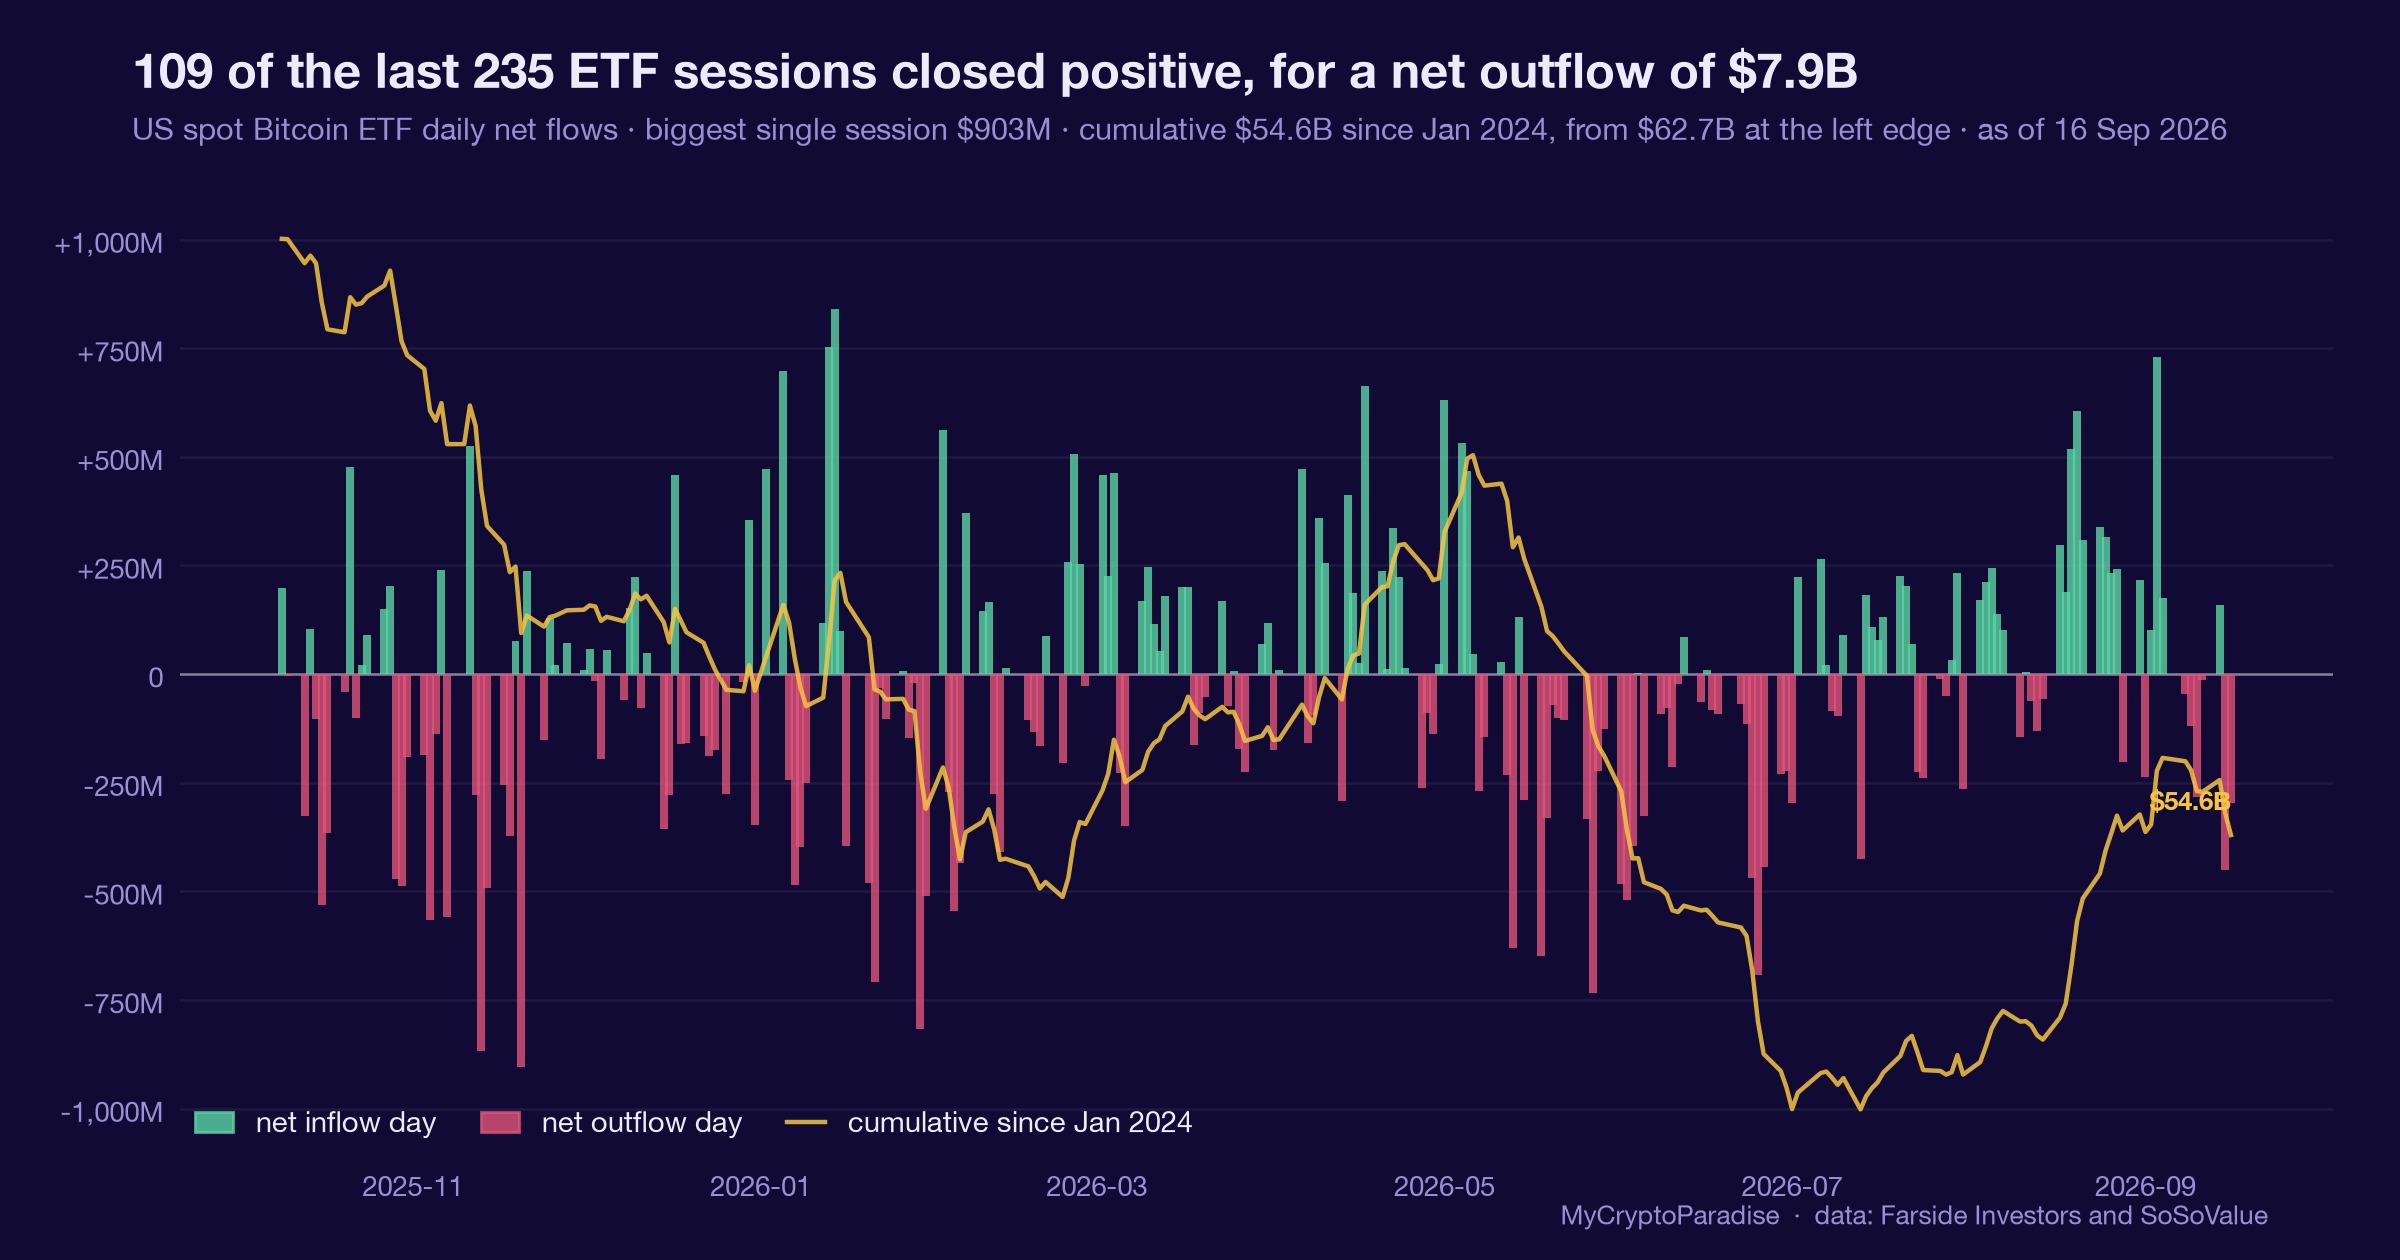
Bitcoin ETFs bled $296M on 16 September as BlackRock led the exit, but our ETF-tide grade slipped just three points to 47: a coin flip, not a top.
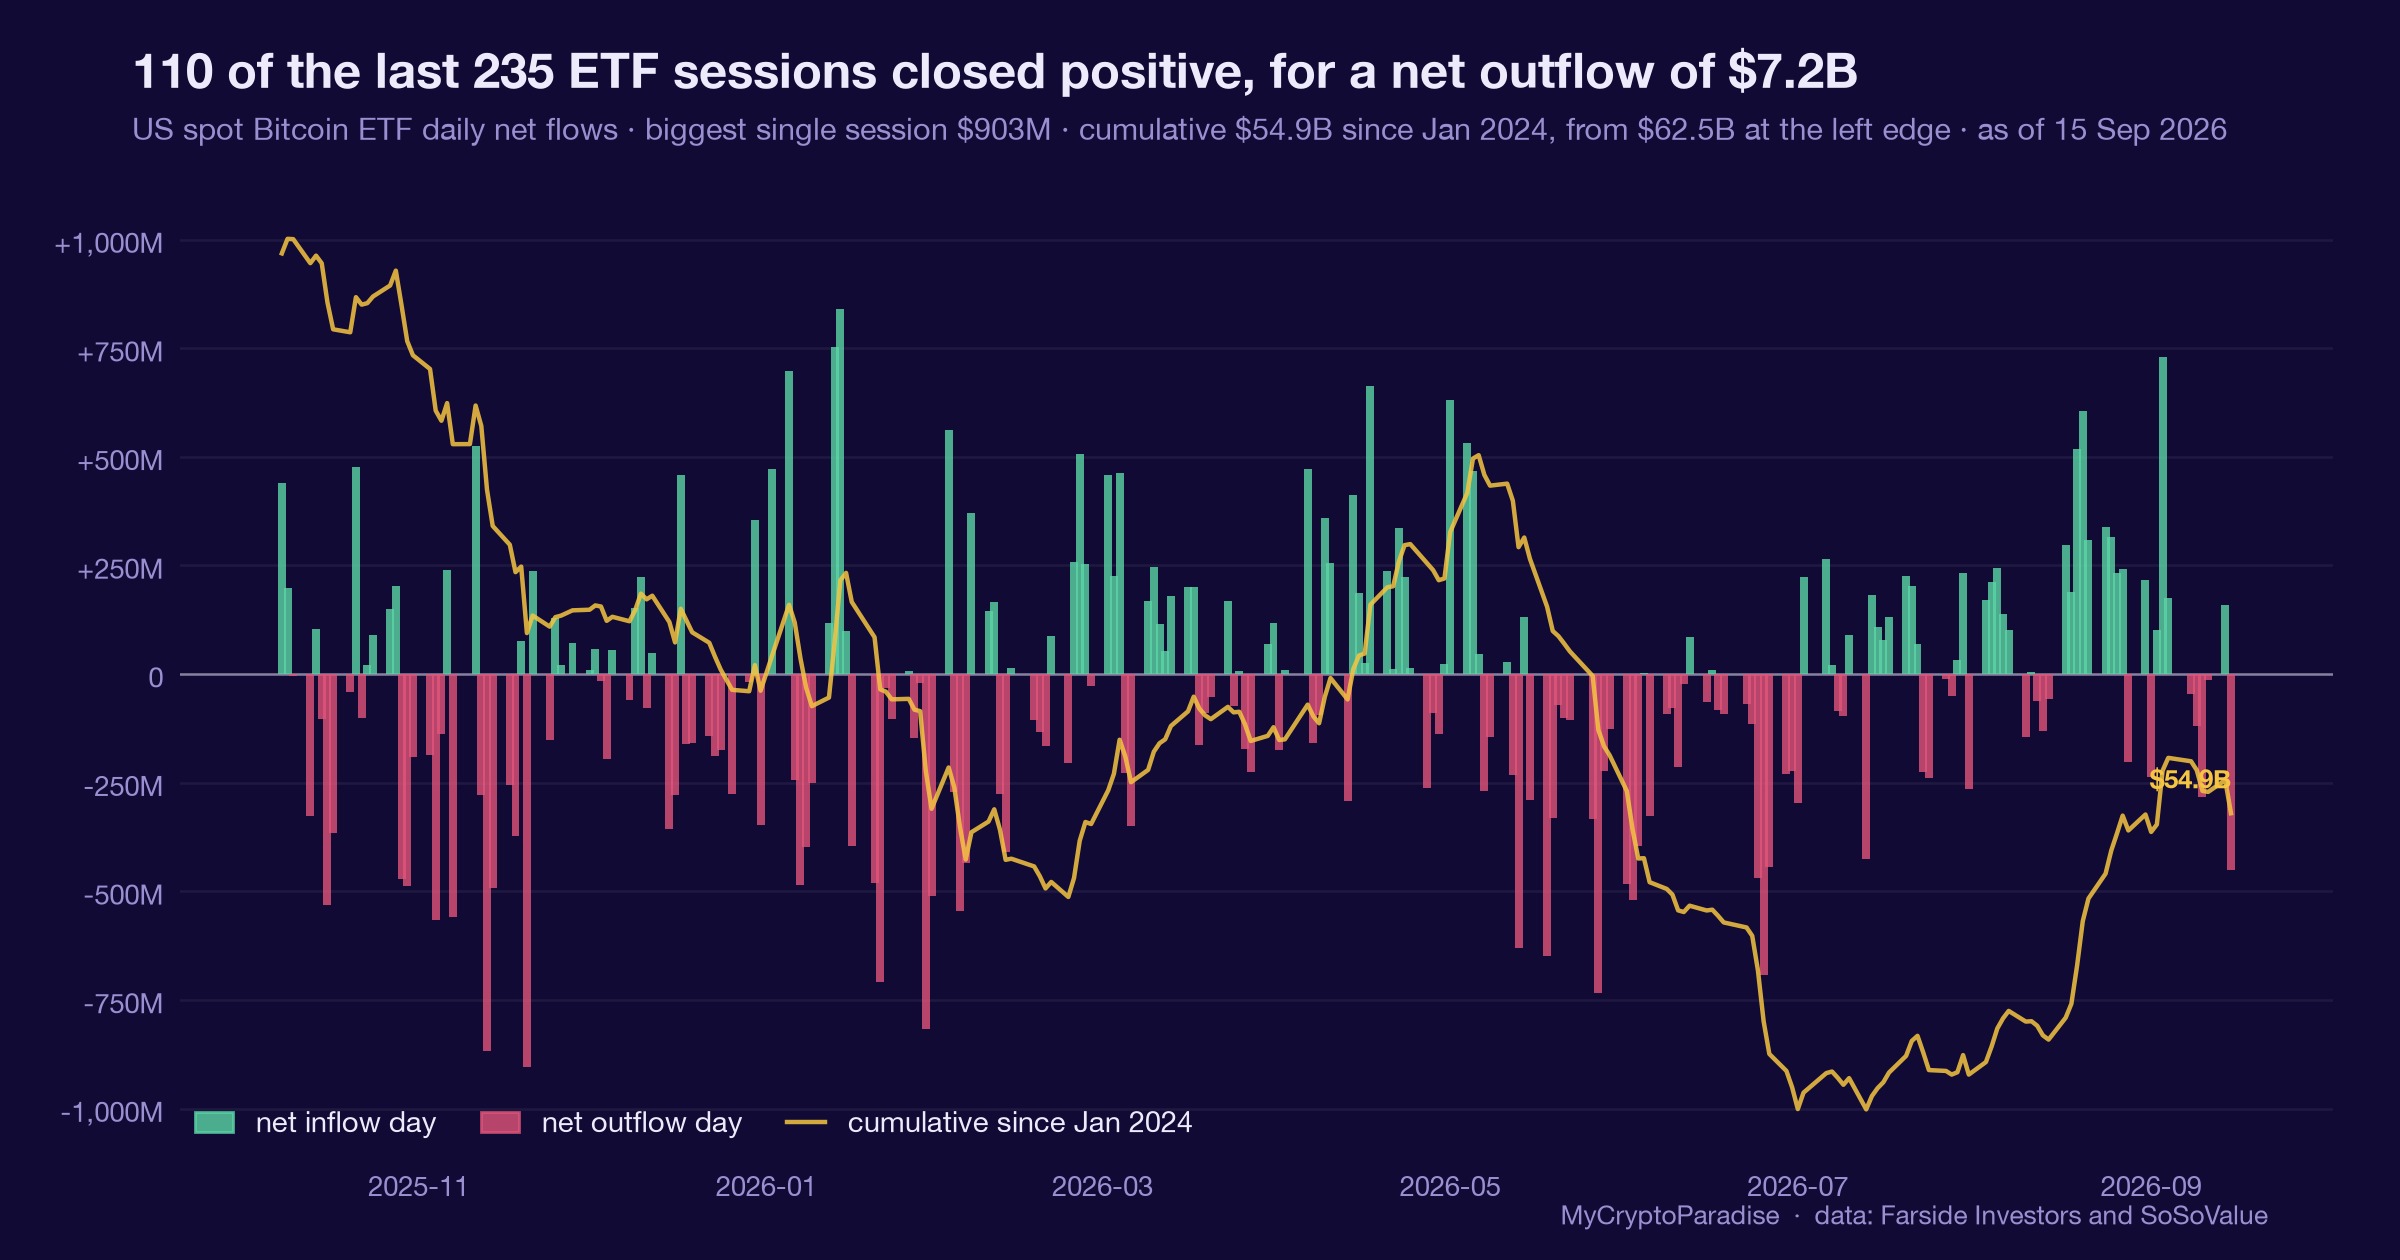
Bitcoin ETFs posted a one-day inflow, then our tide flipped to a 450M net outflow and a coin-flip grade of 50. Read ETF flows yourself.
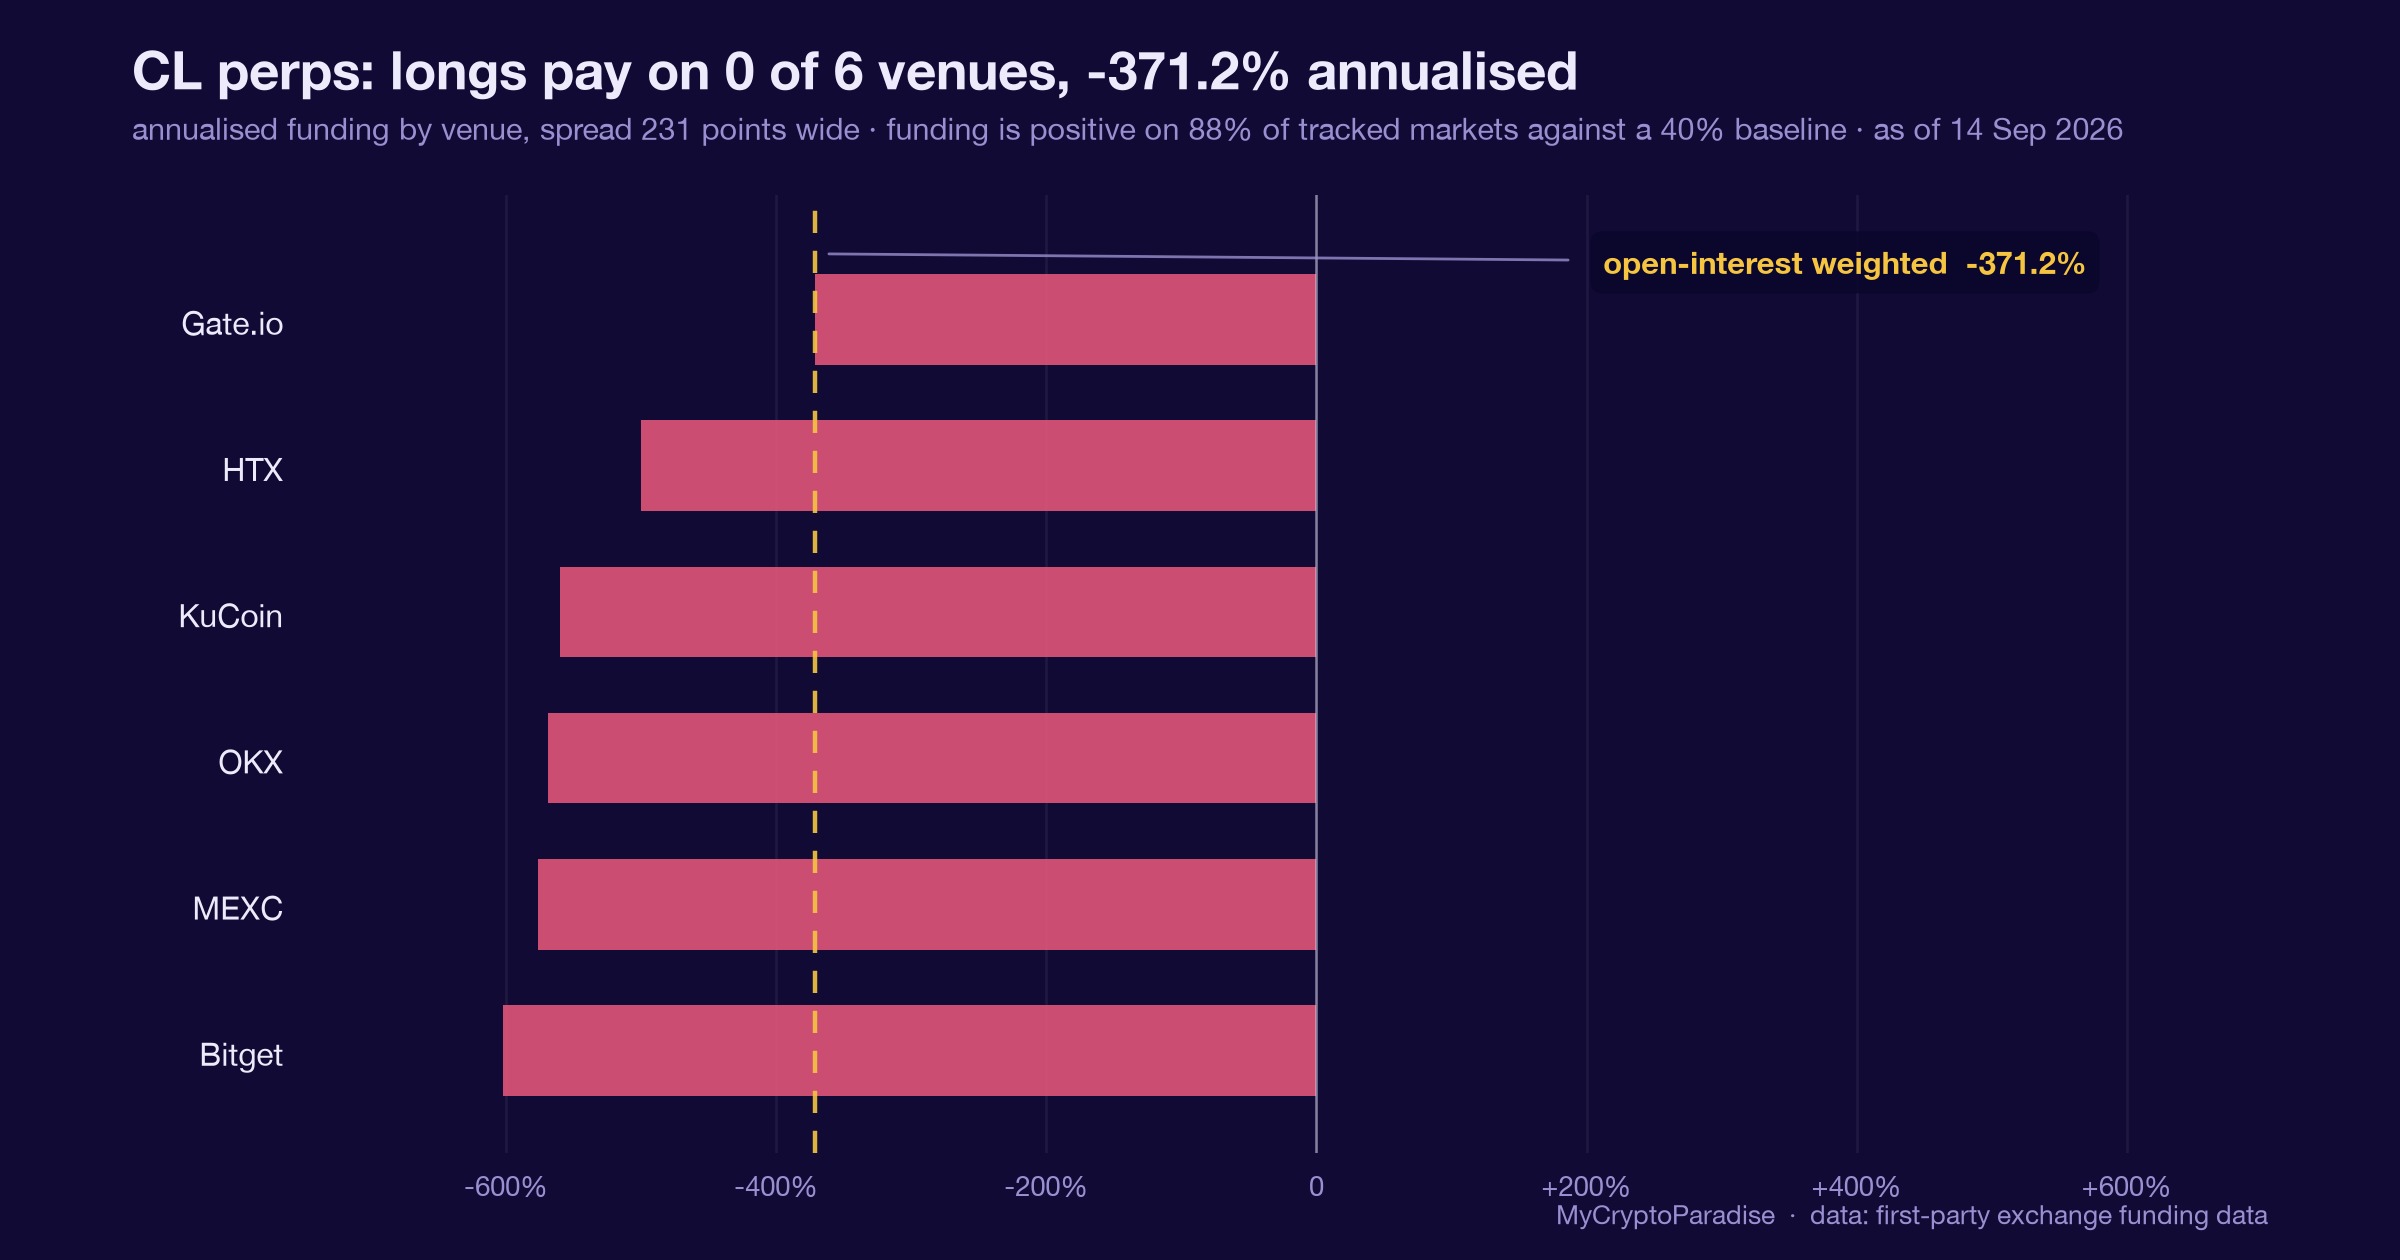
CL shorts are paying minus 385 percent APR, the most stretched funding in the market. Here is how to read a funding extreme, and where it misleads.
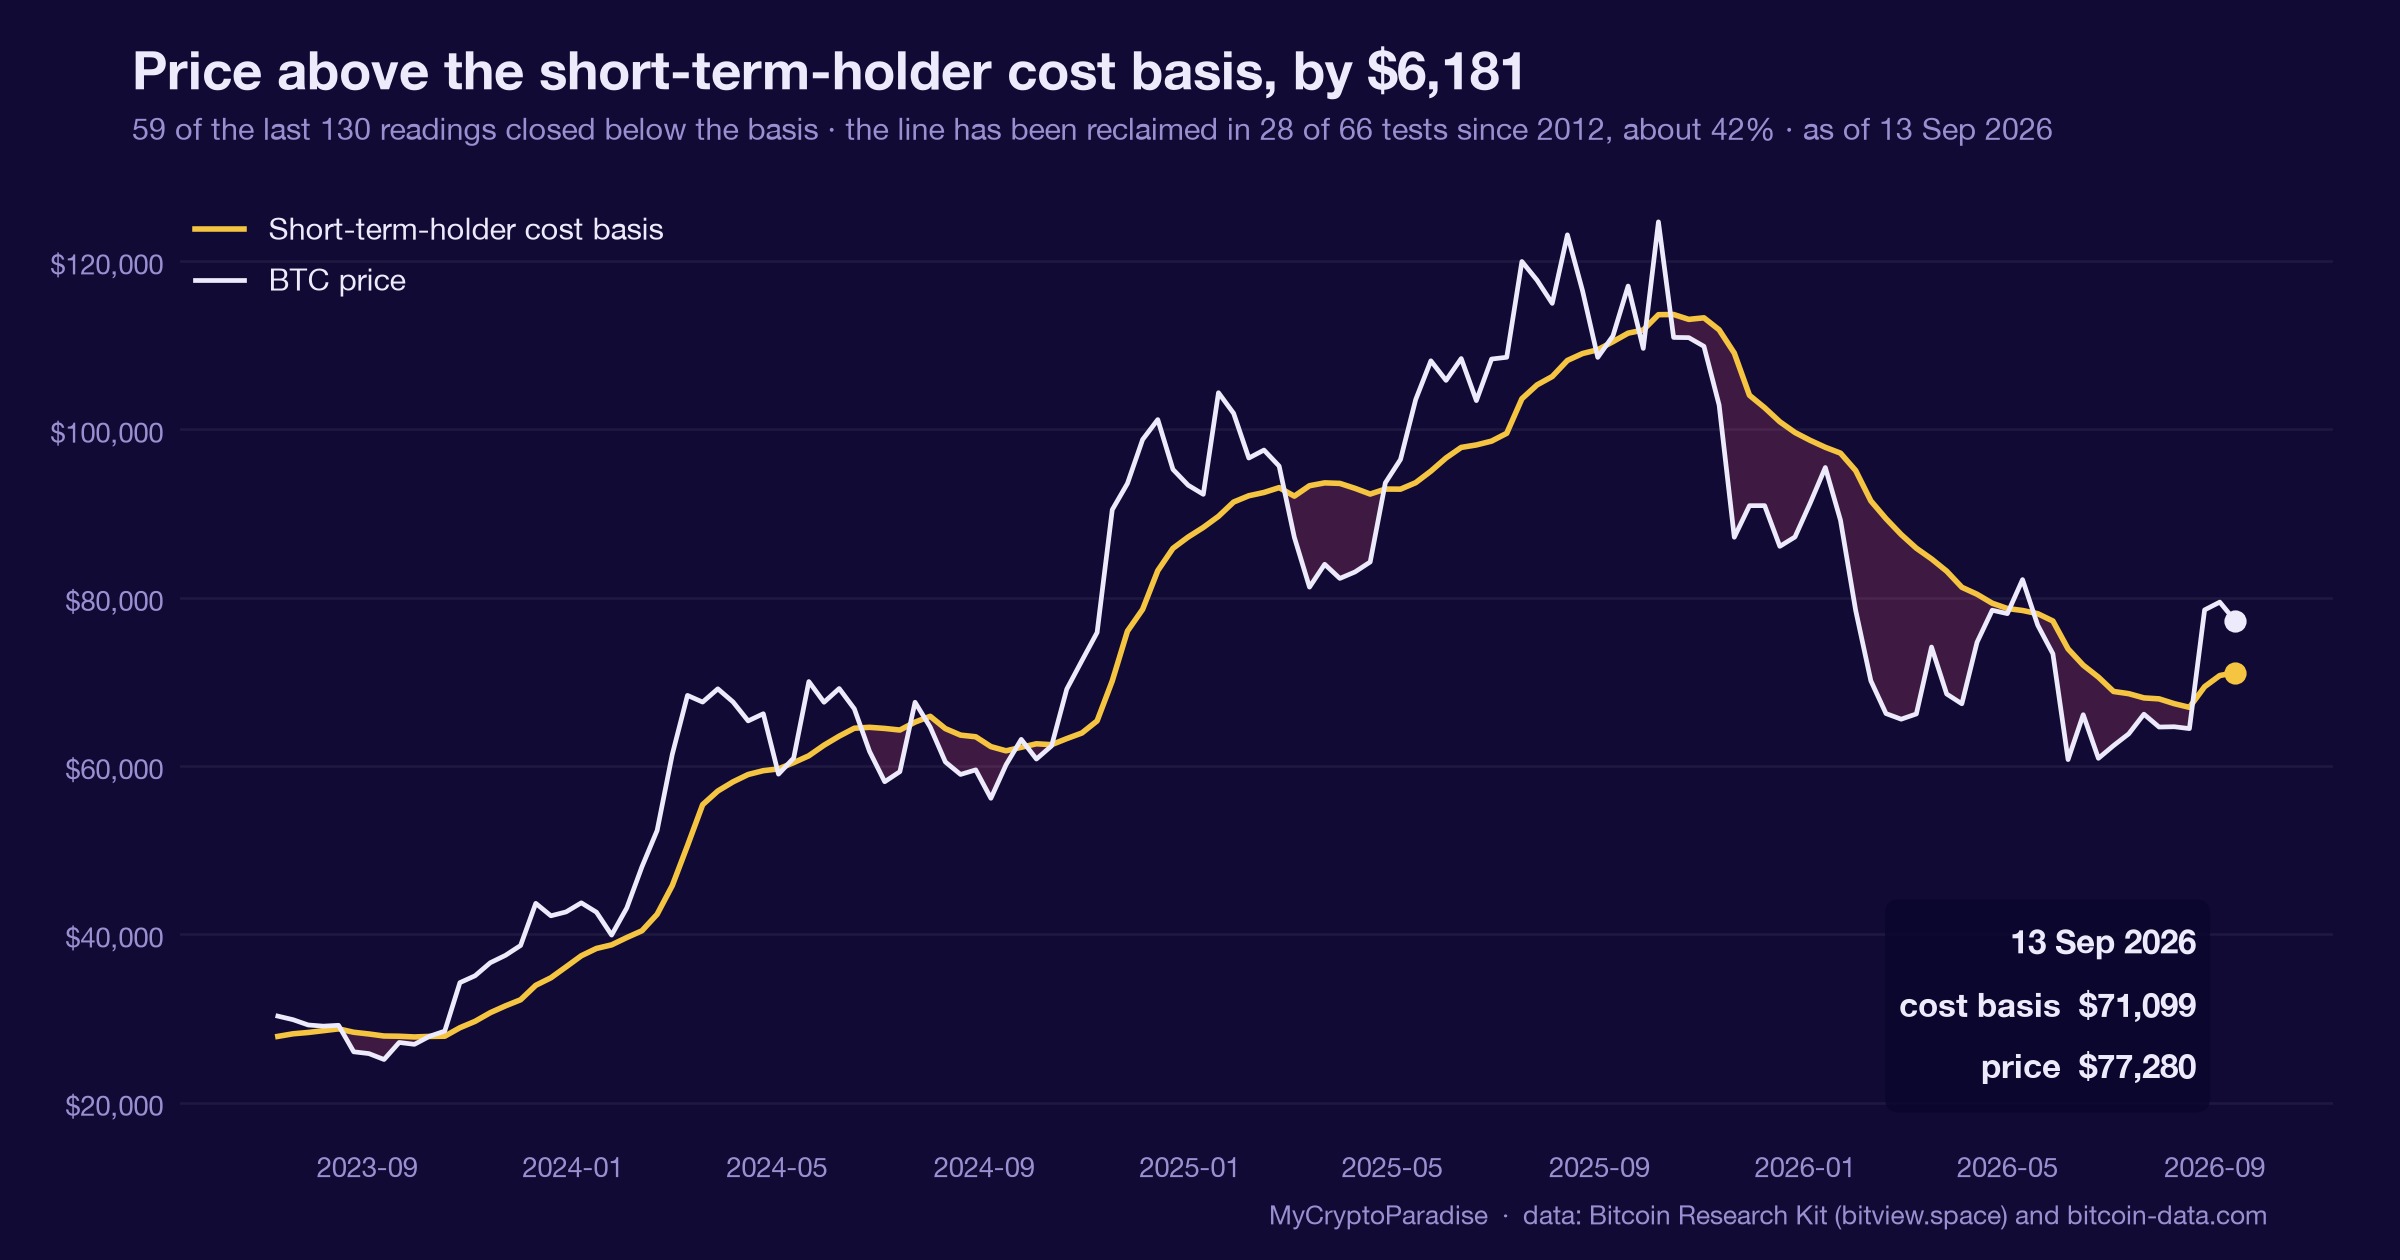
Bitcoin trades 45 percent above realized price on 13 September 2026, yet a third of short-term holders sit underwater. How to read the cushion.

US spot Bitcoin ETFs saw a third outflow day on 10 September 2026, yet the five-day tape stayed positive: how to read allocator absorption.
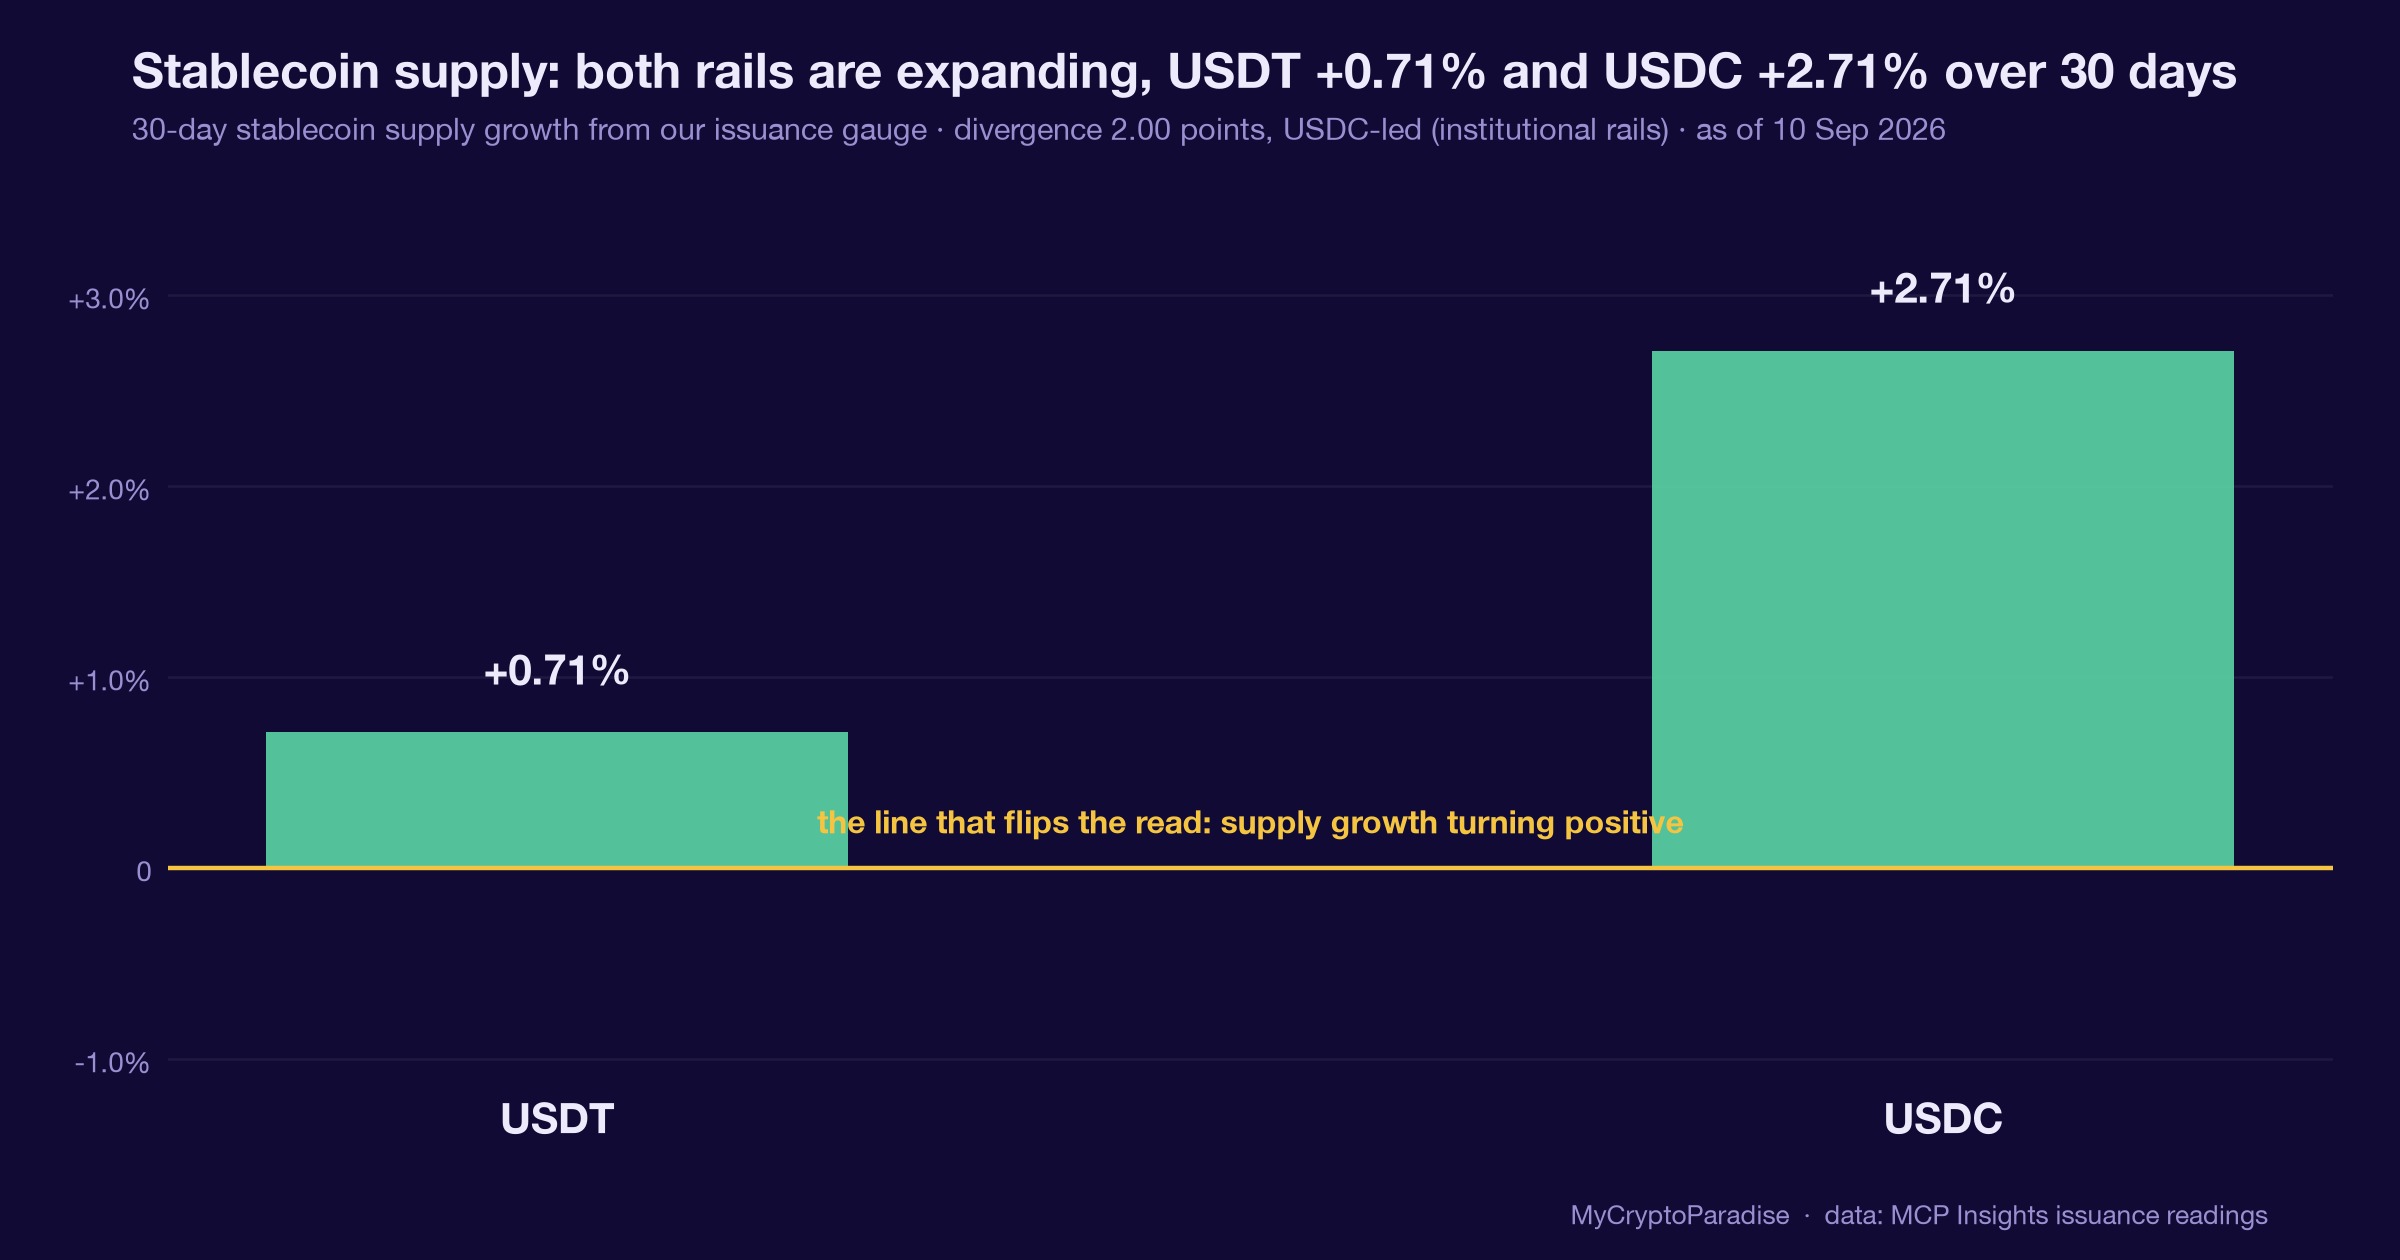
Bitcoin’s stablecoin reserves are refilling, but the 90-day change is still negative. How to read the demand vacuum and the Coinbase premium tell.
 Chat with one of our tradersChat with a trader