

In short
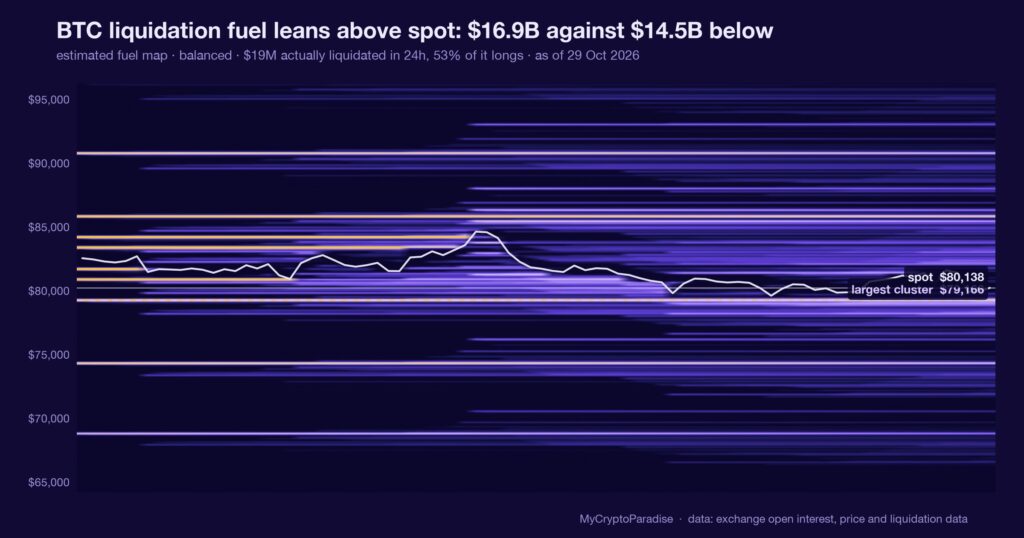
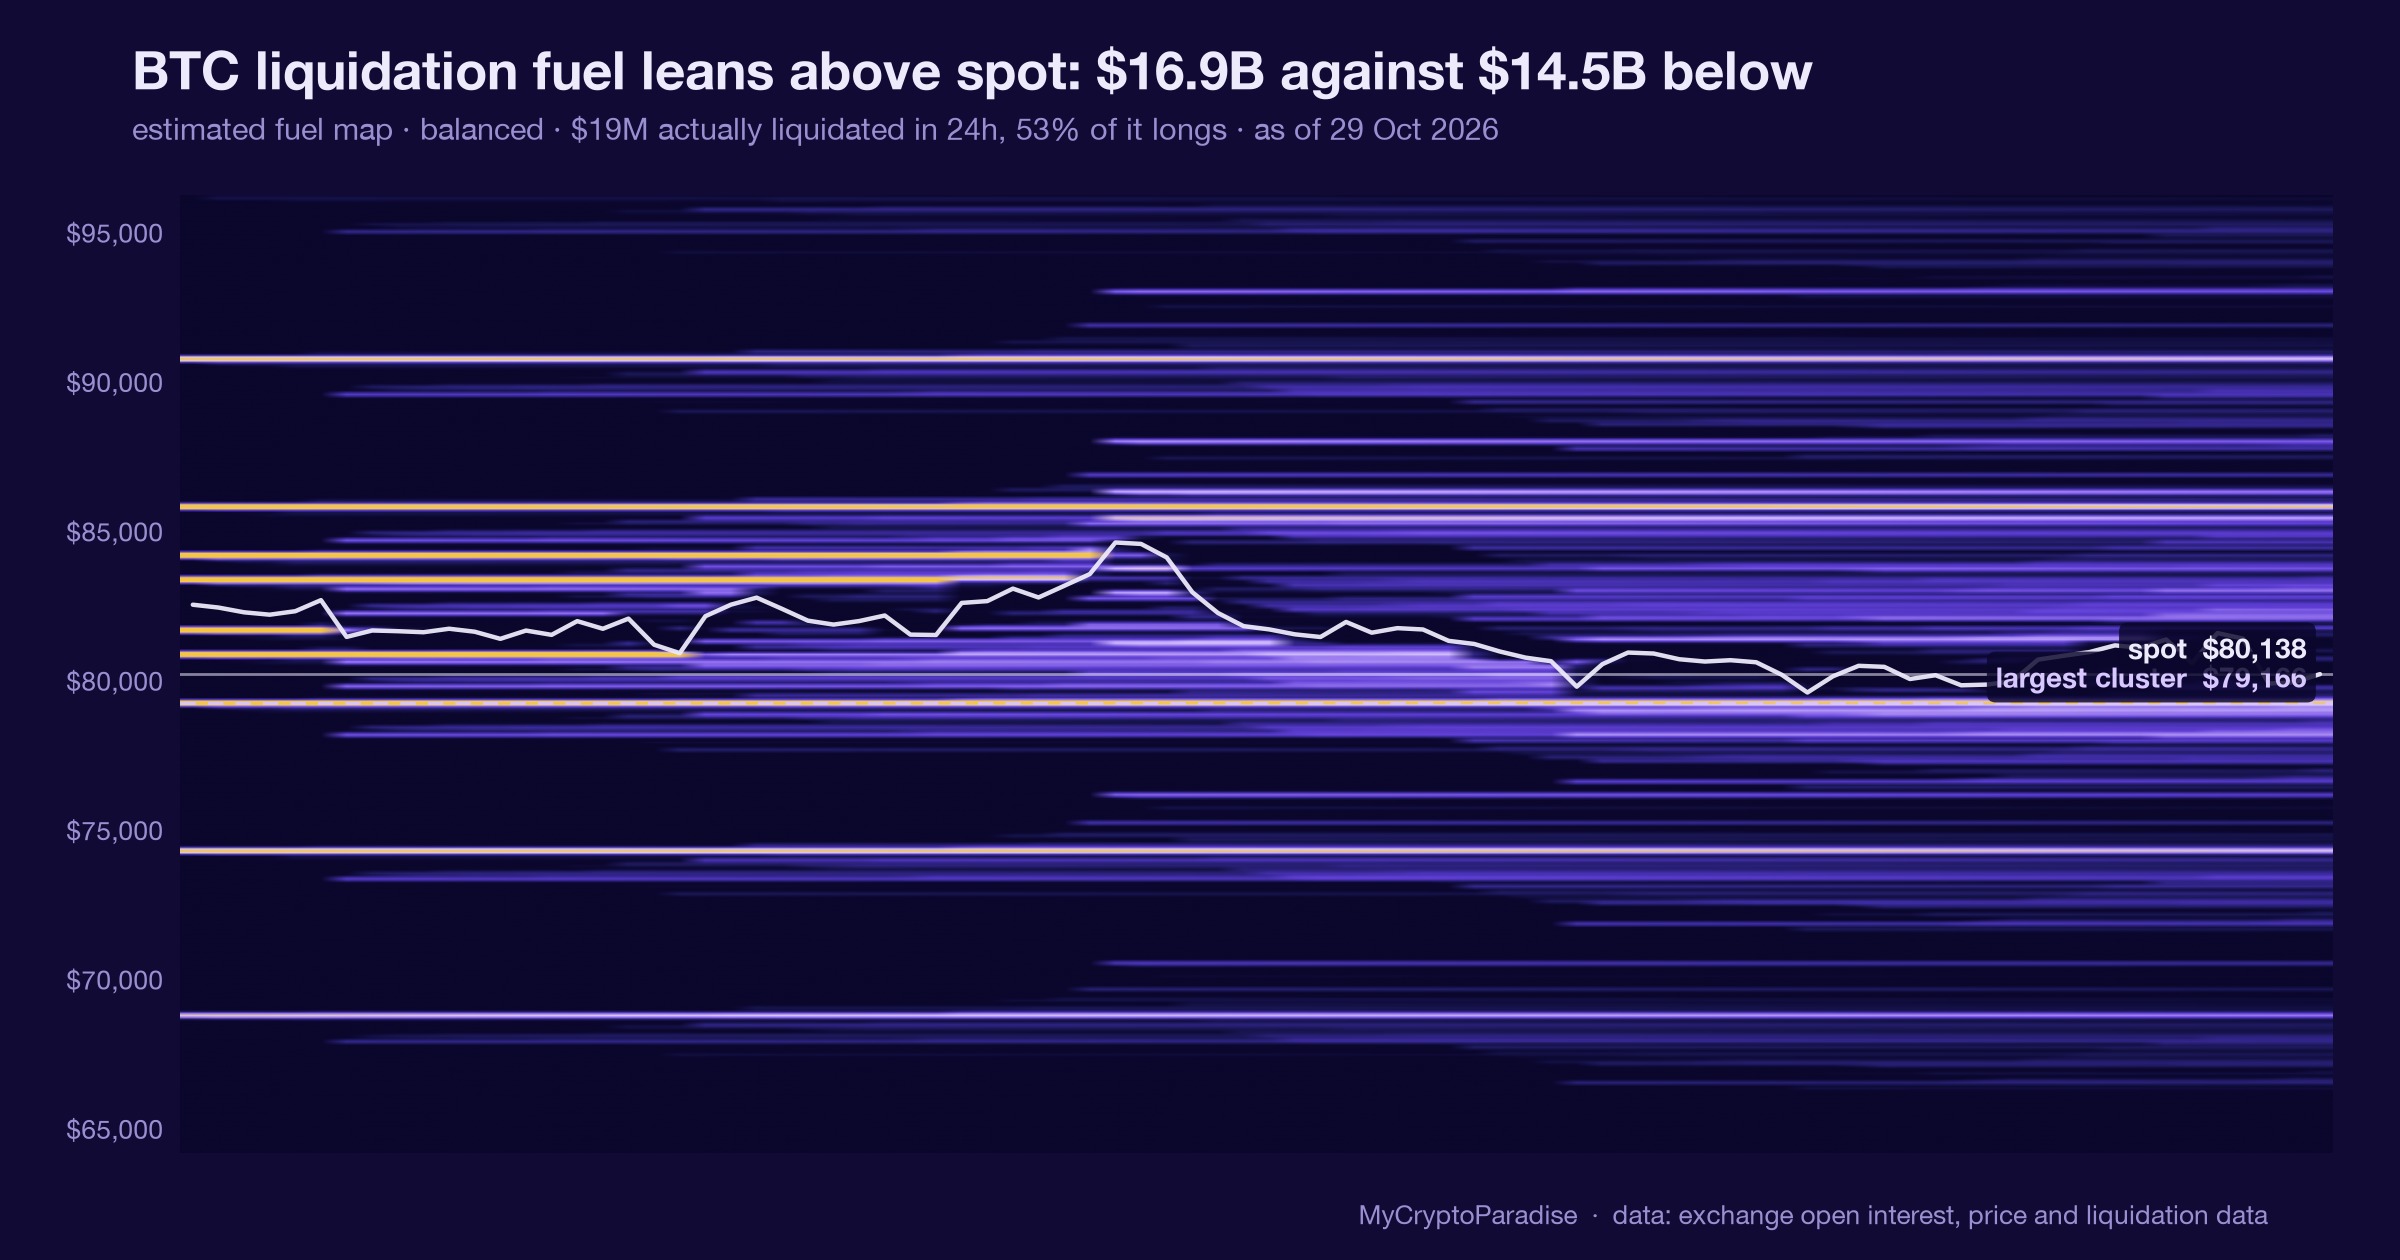
A liquidation fuel map estimates how much leveraged money would be force-closed at each price, the stops a move would detonate rather than the bids someone placed on purpose. On 29 October 2026 an alert crossed our feed claiming $12.11B of shorts above $90,000 against $5.16B of longs below $72,000, a 2.3-to-1 overhead threat. Our own MCP Insights fuel map, spot near $80,140, reads differently: $16.88B above against $14.49B below, an imbalance score of 8 that our grid labels balanced. We called it neutral, explicitly not a lean in either direction, because a 1.2-to-1 split is no edge. The map carries a model-estimate flag, so we quote it as a recon reading, never a calibrated frequency. This piece shows you how to read a liquidation map yourself, and why a balanced one is the honest answer.
Key facts
- BTC spot at the reading
- $80,138
- Estimated BTC liquidation fuel above spot
- $16.88B
- Estimated BTC liquidation fuel below spot
- $14.49B
- Fuel balance
- balanced, +8 points toward the heavier side
- What would prove this read wrong
- A daily close that drags the larger estimated pocket fully to one side of spot, or a sustained push toward the alert’s $90,000 or $72,000 triggers that begins converting one pocket.
- Reading taken
- 29 October 2026
- Source
- Our MCP Insights tools, from exchange data
A liquidation map counts forced exits, not intentions
A liquidation map estimates where leveraged positions get force-closed. When price reaches a level where enough margin breaks, the exchange closes those positions automatically, selling longs or buying back shorts, regardless of what the holder wants at that moment.
That makes it a map of fuel rather than of floors. A resting bid is liquidity someone chose to place and can pull in a second; a liquidation is liquidity that fires on its own when a threshold breaks.
Only one of them is a decision, and only one of them reliably brakes a move.
The distinction matters because the two are read very differently. Fuel tells you where a move might accelerate once it starts; resting bids tell you where someone is willing to catch it.
A gauge that maps what is forced tells you where a move speeds up, never where it chooses to stop.
Our grid reads balanced on 29 October
Per our MCP Insights liquidation data, with BTC spot near $80,140 on 29 October 2026, the fuel map holds $16.88B of estimated fuel above spot against $14.49B below. That is a 1.2-to-1 split and an imbalance score of 8, which our grid labels balanced across a price range from $64,111 to $96,166.
The alert that prompted this read told a louder story: $12.11B of shorts liquidated above $90,000 against $5.16B of longs below $72,000, a 2.3-to-1 overhead threat per the source feed. The gap is the thresholds. Two far-off trigger prices are not the whole distribution, and the whole distribution sits close to even.
The forced tape backs the balance. Our 24-hour liquidation flow totalled just $18.78M, split 53 percent longs and 47 percent shorts: small, two-sided, and nothing like a flush.
When the alarm and the map disagree, the reading that counts the whole grid wins.
What is different here
The ParadiseTeam does not take the loudest liquidation number at face value: we read the whole grid before we quote a ratio. An alert can pick two far-off trigger prices and call it a threat; our map weighs every level between $64,111 and $96,166 and reports what it finds.
Balanced is a reading, not a missing one
The obvious misreading is to treat a balanced map as noise and reach for the scarier number instead. The alert’s 2.3-to-1 is more quotable than our 1.2-to-1, and that is exactly why it travels further than it should.
A balanced fuel map is still saying something precise: neither side is stacked, so forced flow is unlikely to be the thing that moves price next. That is a conclusion, not an absence of one.
This is one input, and today it is the one that disagrees with the alarm.
It sits alongside our order book walls, where resting bids within 2 percent of spot total $1.21B against $0.97B of asks, a net ratio of 0.554 tilted gently to the bid. Our order-flow absorption gauge sits at the 37th percentile, in a zone it openly calls no-edge.
A gauge that admits it has no edge is more useful than one that always finds a signal elsewhere.
The resting book is not arguing with the map
Two of our three microstructure reads point the same way today. The fuel map is balanced, and the visible book is stable: zero spoofed walls and zero iceberg orders flagged near price, with bids within 2 percent modestly outweighing asks.
That agreement is itself the finding. When forced liquidity is even and chosen liquidity leans slightly to the bid, there is no asymmetry large enough to lean a position on, which is a different statement from not knowing.
The one caveat is the flag. Our map carries a model-estimate marker and has not cleared its calibration gate, so we read it as recon, not as a historical rate.
Three gauges quietly agreeing on no edge is a cleaner read than one gauge shouting.
What would tip the map off balance
Balance is not a permanent state. The skew flips when a daily close drags the larger estimated pocket fully to one side of spot, or when the resting book thins on one side and lets a move run into the fuel instead of into bids.
The alert’s levels are the ones to watch for that, even if its ratio overstated the case. A sustained push toward $90,000 would start converting the overhead pocket; a break toward $72,000 would do the same below. Neither is near spot today.
The highest-probability action, when the fuel sits evenly on both sides, is usually no action at all.
Reading a liquidation map yourself, step by step
- Start with spot, then read the fuel above and below it separately: you want the ratio between the two pockets, not either raw number.
- Check the imbalance label before the figures: a score near balanced means the two sides are close enough that forced flow has no clear direction.
- Note the price range the grid covers, so you know whether a quoted trigger sits near spot or far out at the edge.
- Cross-read it against the resting order book: fuel that is forced and bids that are chosen are two different liquidities, and they can disagree.
- Check for a model-estimate or calibration flag, and if one is set, treat the map as recon rather than a historical frequency.
The step most people skip is the price range: a $12 billion pocket means nothing until you know it sits twelve percent away from spot.
Every number above is checkable against the live data. Start with the crypto liquidation heatmap, then cross-read the MCP Insights hub and the Crypto Fear and Greed Index.
Act and invalidate
| Scenario | What confirms it | What kills it |
|---|---|---|
| Balanced, forced flow has no edge | Imbalance score stays near 8 | Daily close shifts a pocket to one side |
| Overhead pocket starts to activate | Sustained push toward $90,000 | Price rejects, bids hold below spot |
| Downside pocket starts to activate | Break toward $72,000 | 24h forced flow stays small, two-sided |
Posture: Patience while the fuel sits evenly and the book stays stable. There is no asymmetry here worth sizing a position against today.
Frequently asked questions
What does a balanced liquidation map mean?
It means the estimated fuel above and below spot is roughly equal, so neither side is stacked with forced exits. Balance implies that leveraged liquidations are unlikely to be the dominant force on price in the near term, which is a finding, not a blank.
Why did the alert and your map disagree?
The alert quoted two far-off trigger prices, $90,000 and $72,000, and framed them as a 2.3-to-1 threat. Our grid weighs every level near spot and across the full range from $64,111 to $96,166, and that fuller picture reads close to even.
Can a liquidation map predict price direction?
No. It maps where leveraged positions would be force-closed, which tells you where a move might accelerate once it starts, not where price goes next. It is one probability input among several, never a direction on its own.
What is the model-estimate flag on this reading?
It marks a figure produced by our recon model that has not yet cleared its calibration gate. We quote such a reading as an estimate, never as a calibrated historical frequency, and we weight it accordingly inside any wider bias.
What would flip this balanced read?
A daily close that drags the larger estimated pocket fully to one side of spot would do it, as would the resting book thinning on one side. A sustained push toward the alert’s trigger levels would also start converting a pocket overhead or below.
Crypto trading involves substantial risk and is not suitable for everyone. Nothing here is financial advice; it is education only. Never risk more than you can afford to lose.
The private Extras feed, where the fuel map, the order book walls and the absorption gauge update intraday with their invalidation levels, is part of PRO Paradiser, the intelligence layer behind the ParadiseFamilyVIP strategies.










Join the discussion
No comments yet. Members, share how you are reading this.