

In short
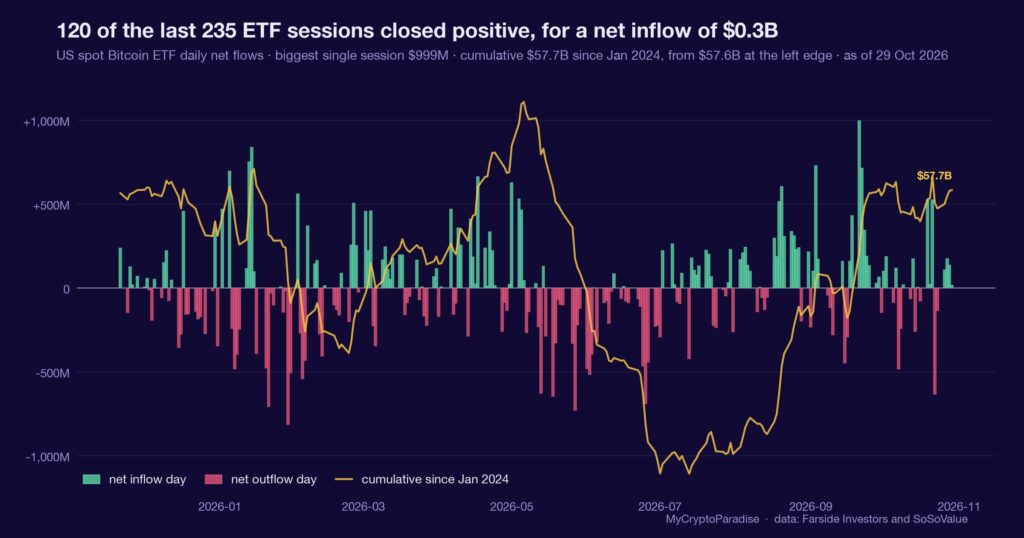
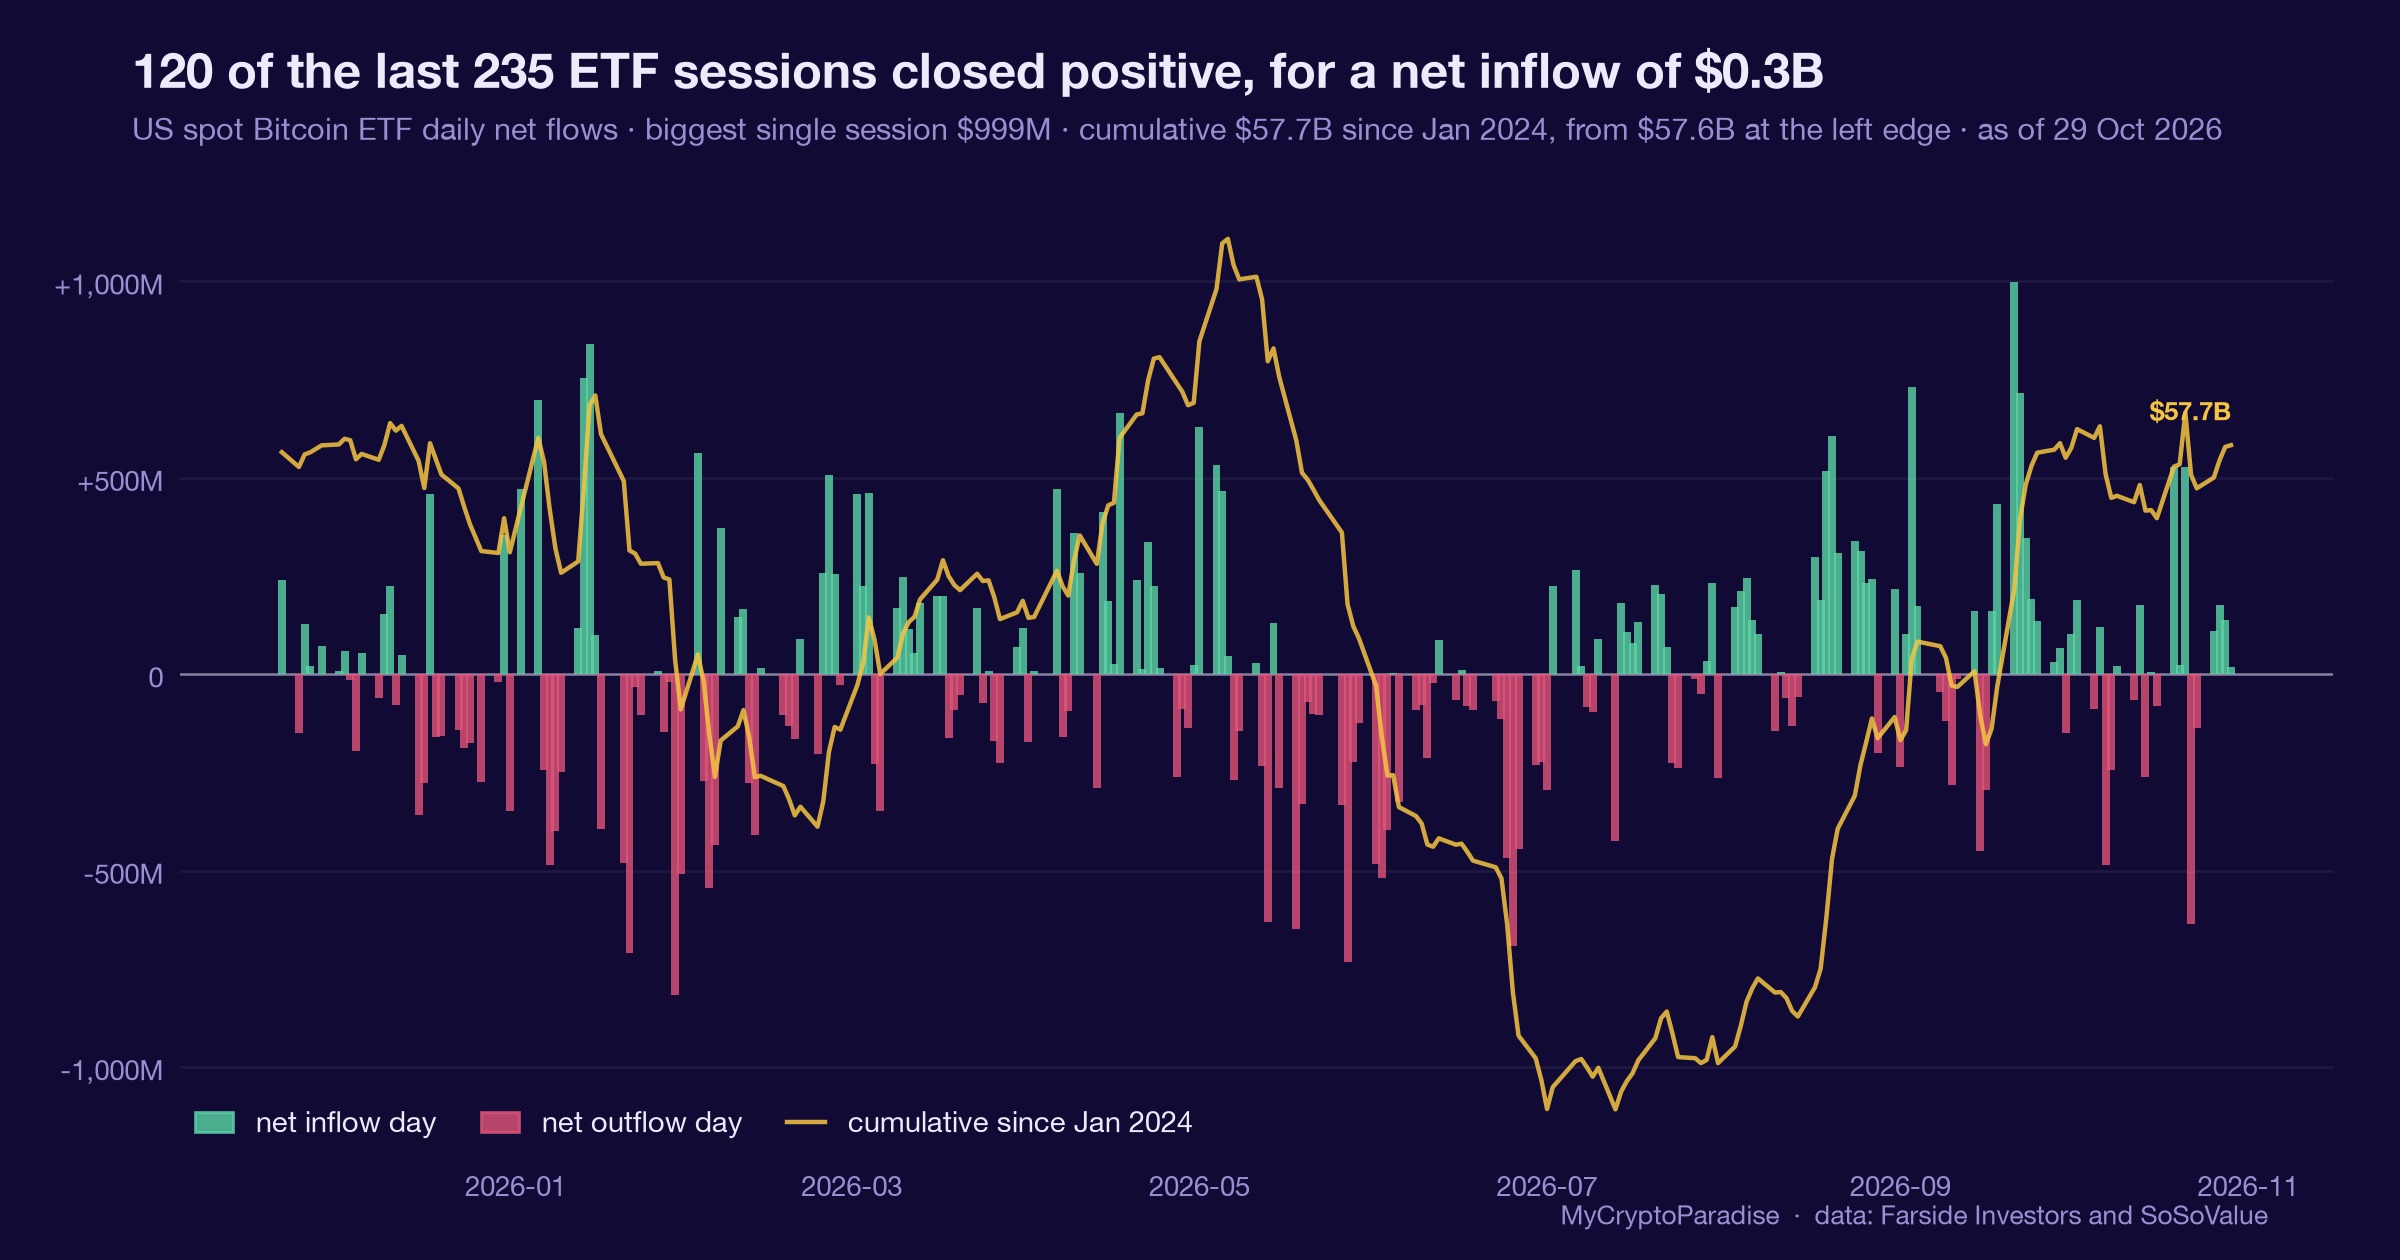
A Bitcoin exchange-traded fund (ETF) net flow is the daily net dollars that US spot funds add to or pull from the asset, and it is our cleanest read on allocator appetite. On 29 October 2026 the funds took in a net $17.1 million, the fourth straight inflow day, and $302.8 million across the last five sessions, our recon reading. Over those same five days spot fell 3.55 percent: allocators bought a dip. We called this neutral, not a bottom, because the figure carries a model-estimate flag and our tide gauge assigns no edge. The 30-day net is still a negative $20.4 million, so the absorption has not yet turned the longer tape. No calibrated base rate is wired, so we quote no historical frequency. This piece shows you how to read ETF flows yourself, without mistaking a dip-buy for a reversal.
Key facts
- Latest session net flow
- $17.1M
- Net flow over the last five sessions
- $302.8M
- Cumulative net flow since January 2024
- $57.69B
- What would prove this read wrong
- A single net outflow day that ends the four-day inflow streak, or the week-to-date net sliding below zero while the 30-day net stays negative.
- Reading taken
- 29 October 2026
- Source
- Our MCP Insights tools, from Farside Investors and SoSoValue. Upstream data published by Farside Investors
Net flow measures appetite, not direction
A spot Bitcoin exchange-traded fund (ETF) is a vehicle that holds coins and issues shares, so its daily net flow is the dollar value allocators add or redeem. It is a demand gauge, not a price forecast.
When price falls while net flow stays positive, the two series disagree. Someone is selling into the market, and someone with a fund wrapper is buying what they sell. We call that absorption.
Absorption tells you who is on the other side of weakness. It does not tell you the weakness is over. A buyer can absorb a dip for days and still be early.
The 29 October tape: flows up, price down
On 29 October 2026 US spot Bitcoin ETFs logged a net $17.1 million inflow, the fourth consecutive inflow day, per our MCP Insights ETF flow recon reading. The five-day net is a positive $302.8 million.
Over those same five sessions, spot fell 3.55 percent. BlackRock’s fund led with $12.8 million on the day and a positive $1,156.3 million over 30 days; Fidelity’s took $10.5 million on the day but sits at negative $679.1 million over the month. Grayscale’s mini fund shed $15.3 million.
The week to 29 October runs to a positive $440.7 million and is incomplete, against a positive $304.8 million the week before. Yet the full 30-day net is negative $20.4 million, and our tide gauge reads a 71 percent inflow impulse with no assigned edge.
A streak of green days and a red month are both true at once, which is exactly what a divergence looks like from the inside.
What is different here
The ParadiseTeam does not read a green streak as a bottom. We separate the four inflow days from the negative 30-day net, flag the model estimate, and cross the flow against funding and the premium before sizing anything. The divergence is the input, not the verdict.
Absorption is not a bottom signal removed
The tempting read is that institutional buying into a 3.55 percent drop marks a floor. It does not. Net flow carries a model-estimate flag and has not cleared its calibration gate, so the figure is our recon reading, not a measured probability.
The 30-day net turning negative while the four-day streak runs green is the honest shape here. Allocators are buying this week; they were net sellers across the month. Both halves size the risk.
Our Bitcoin ETF flow tracker lays the daily prints, the streak and the cumulative curve side by side, which is where this divergence is easiest to see.
This flow read is one input. It sits alongside funding, open interest and the Coinbase premium, and today it is the one leaning most constructive while the others stay flat.
A read that only quotes the green days is marketing. The red month is what keeps the size small.
What funding and the premium add
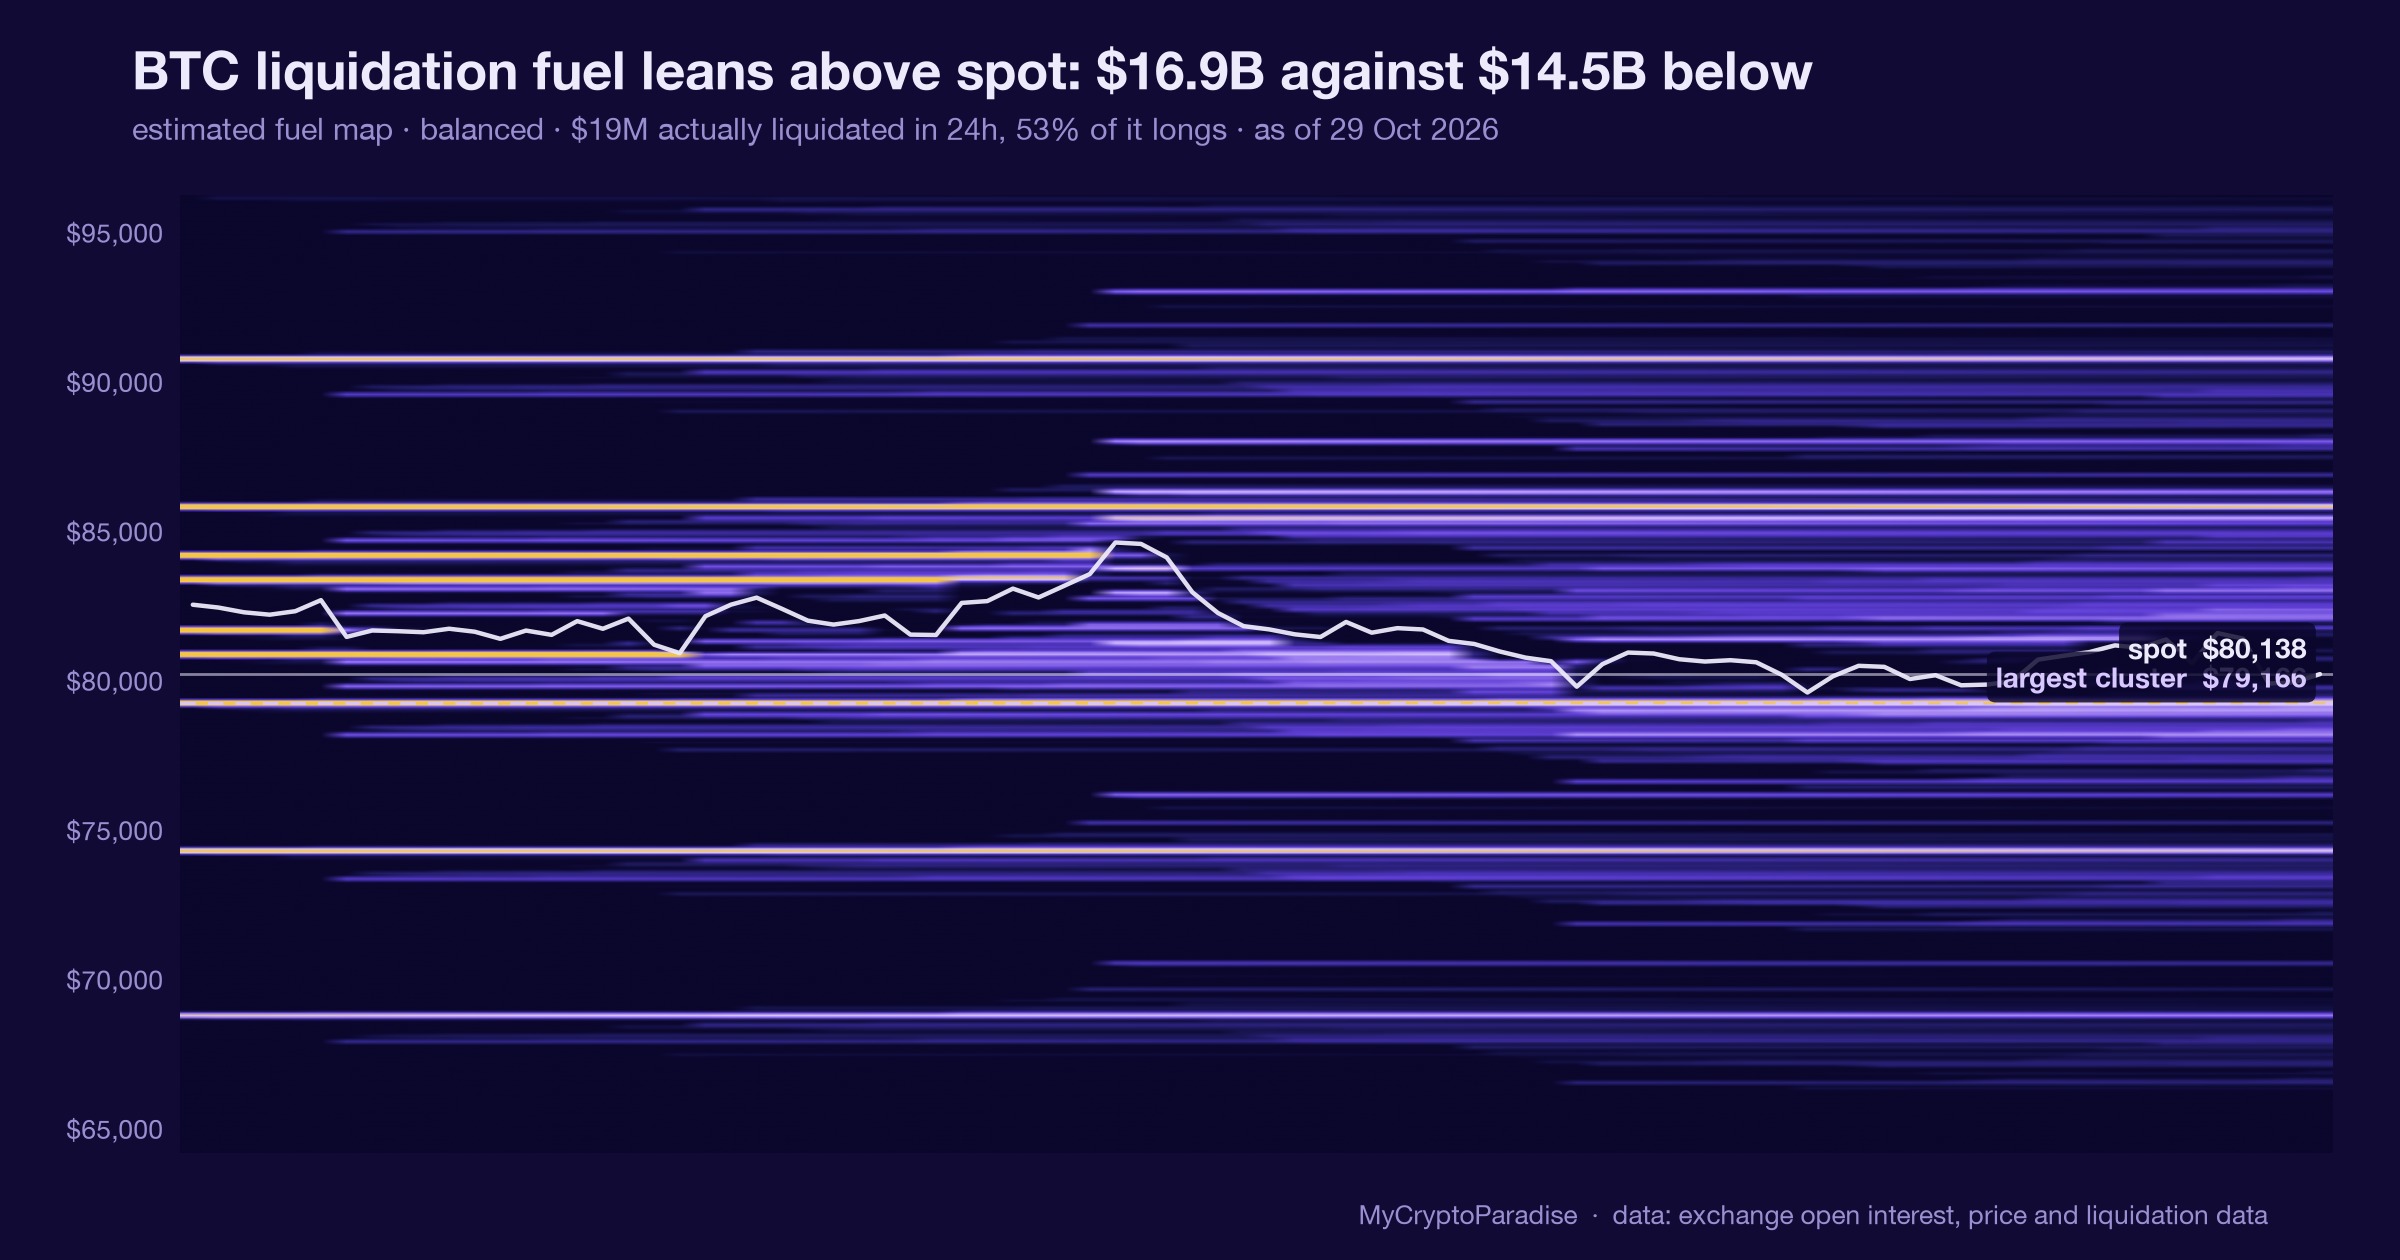
Our own exchange grid puts perpetual funding near 10.97 percent annualized with longs paying, so leverage still tilts long into the weakness. That is not a crowded extreme, but it is not fuel for a squeeze higher either.
The Coinbase premium, the US spot price measured against offshore venues, sits at negative 0.099 percent, a sixth straight session where offshore led. US demand is not front-running this absorption; the buying is patient, not urgent.
Open interest stands near $31.3 billion, and the order-flow state reads as churn, between clear regimes, which fits a market that is absorbing rather than trending.
Patient absorption and offshore-led pricing can coexist for weeks. Neither is a timer.
The calendar does not buy the dip
The source note frames this through a 1,370-day cycle: 365 days of pain, then 1,005 of gains. The pattern is tidy. It is also a calendar, and a calendar does not place a bid.
What placed the bid on 29 October was $302.8 million of fund flow over five days, and what pulled it back was a negative 30-day net. Those are allocators acting on price, not a date on a schedule.
The honest counter is that ETFs, concentrated in one dominant fund, have changed who buys and why. A model fit to three prior cycles has three data points. Three is not a distribution.
A pattern that has repeated three times is a story worth watching, not a frequency you can trade.
Reading ETF net flow yourself, step by step
- Pull the daily net flow for US spot Bitcoin ETFs and note whether today adds to or breaks the inflow streak.
- Compare the five-day net against the five-day price return: agreement is trend, disagreement is absorption or distribution.
- Check the 30-day net, because a green week inside a red month is a divergence, not a reversal.
- Read the issuer split: one dominant fund carrying the whole net is a narrower base than it first looks.
- Cross the flow against funding and the Coinbase premium to see whether leverage and US spot confirm or fade it.
Most people stop at the daily headline and miss the 30-day net, which is the line that tells you whether this week’s buying is a trend or a blip.
Every number above is checkable against the live data. Start with the Bitcoin ETF flow tracker, then cross-read the MCP Insights hub and the Crypto Fear and Greed Index.
Act and invalidate
| Scenario | What confirms it | What kills it |
|---|---|---|
| Allocators keep absorbing | Fifth straight inflow day | A net outflow day |
| Dip-buy marks a low | Spot reclaims as flows rise | 30-day net stays red |
| Buying fades into the month | Week-to-date turns negative | Streak extends past prior week |
Posture: Neutral with a mild constructive lean while the inflow streak holds. No trade is the honest default until the 30-day net turns positive or spot reclaims with flows rising.
Frequently asked questions
What is a Bitcoin ETF net flow?
It is the daily net dollar value that US spot Bitcoin exchange-traded funds add or redeem. A positive figure means allocators bought more than they sold that session. We read it as an appetite gauge, not a price forecast.
What does absorption mean here?
Absorption is when price falls while net flow stays positive, so fund buyers are taking the coins that others sell into weakness. On 29 October 2026 the funds added $302.8 million over five days as spot fell 3.55 percent.
Is this a bottom for Bitcoin?
We do not read it as one. The flow carries a model-estimate flag, the 30-day net is a negative $20.4 million, and the buying is concentrated in one dominant fund. Absorption shows who is bidding, not that the low is in.
Why does the 30-day net matter more than today?
A single green day is noise; the 30-day net shows the trend behind it. On 29 October the daily print was positive while the month sat at negative $20.4 million, so this week’s buying had not yet turned the longer tape.
What would change this read?
A net outflow day ending the four-day streak would weaken it, while the week-to-date net sliding below zero would break it outright. A fresh calibrated flow print replacing the model estimate would let us quote a real frequency.
Crypto trading involves substantial risk and is not suitable for everyone. Nothing here is financial advice; it is education only. Never risk more than you can afford to lose.
The private Extras feed, where the ETF net-flow recon, the absorption divergence and the funding read update intraday with invalidation levels, is part of PRO Paradiser, the intelligence layer behind the ParadiseFamilyVIP strategies.












Join the discussion
No comments yet. Members, share how you are reading this.