

MCP Extras Free
BTC’s liquidation fuel flipped overhead: reading a near-balanced heatmap
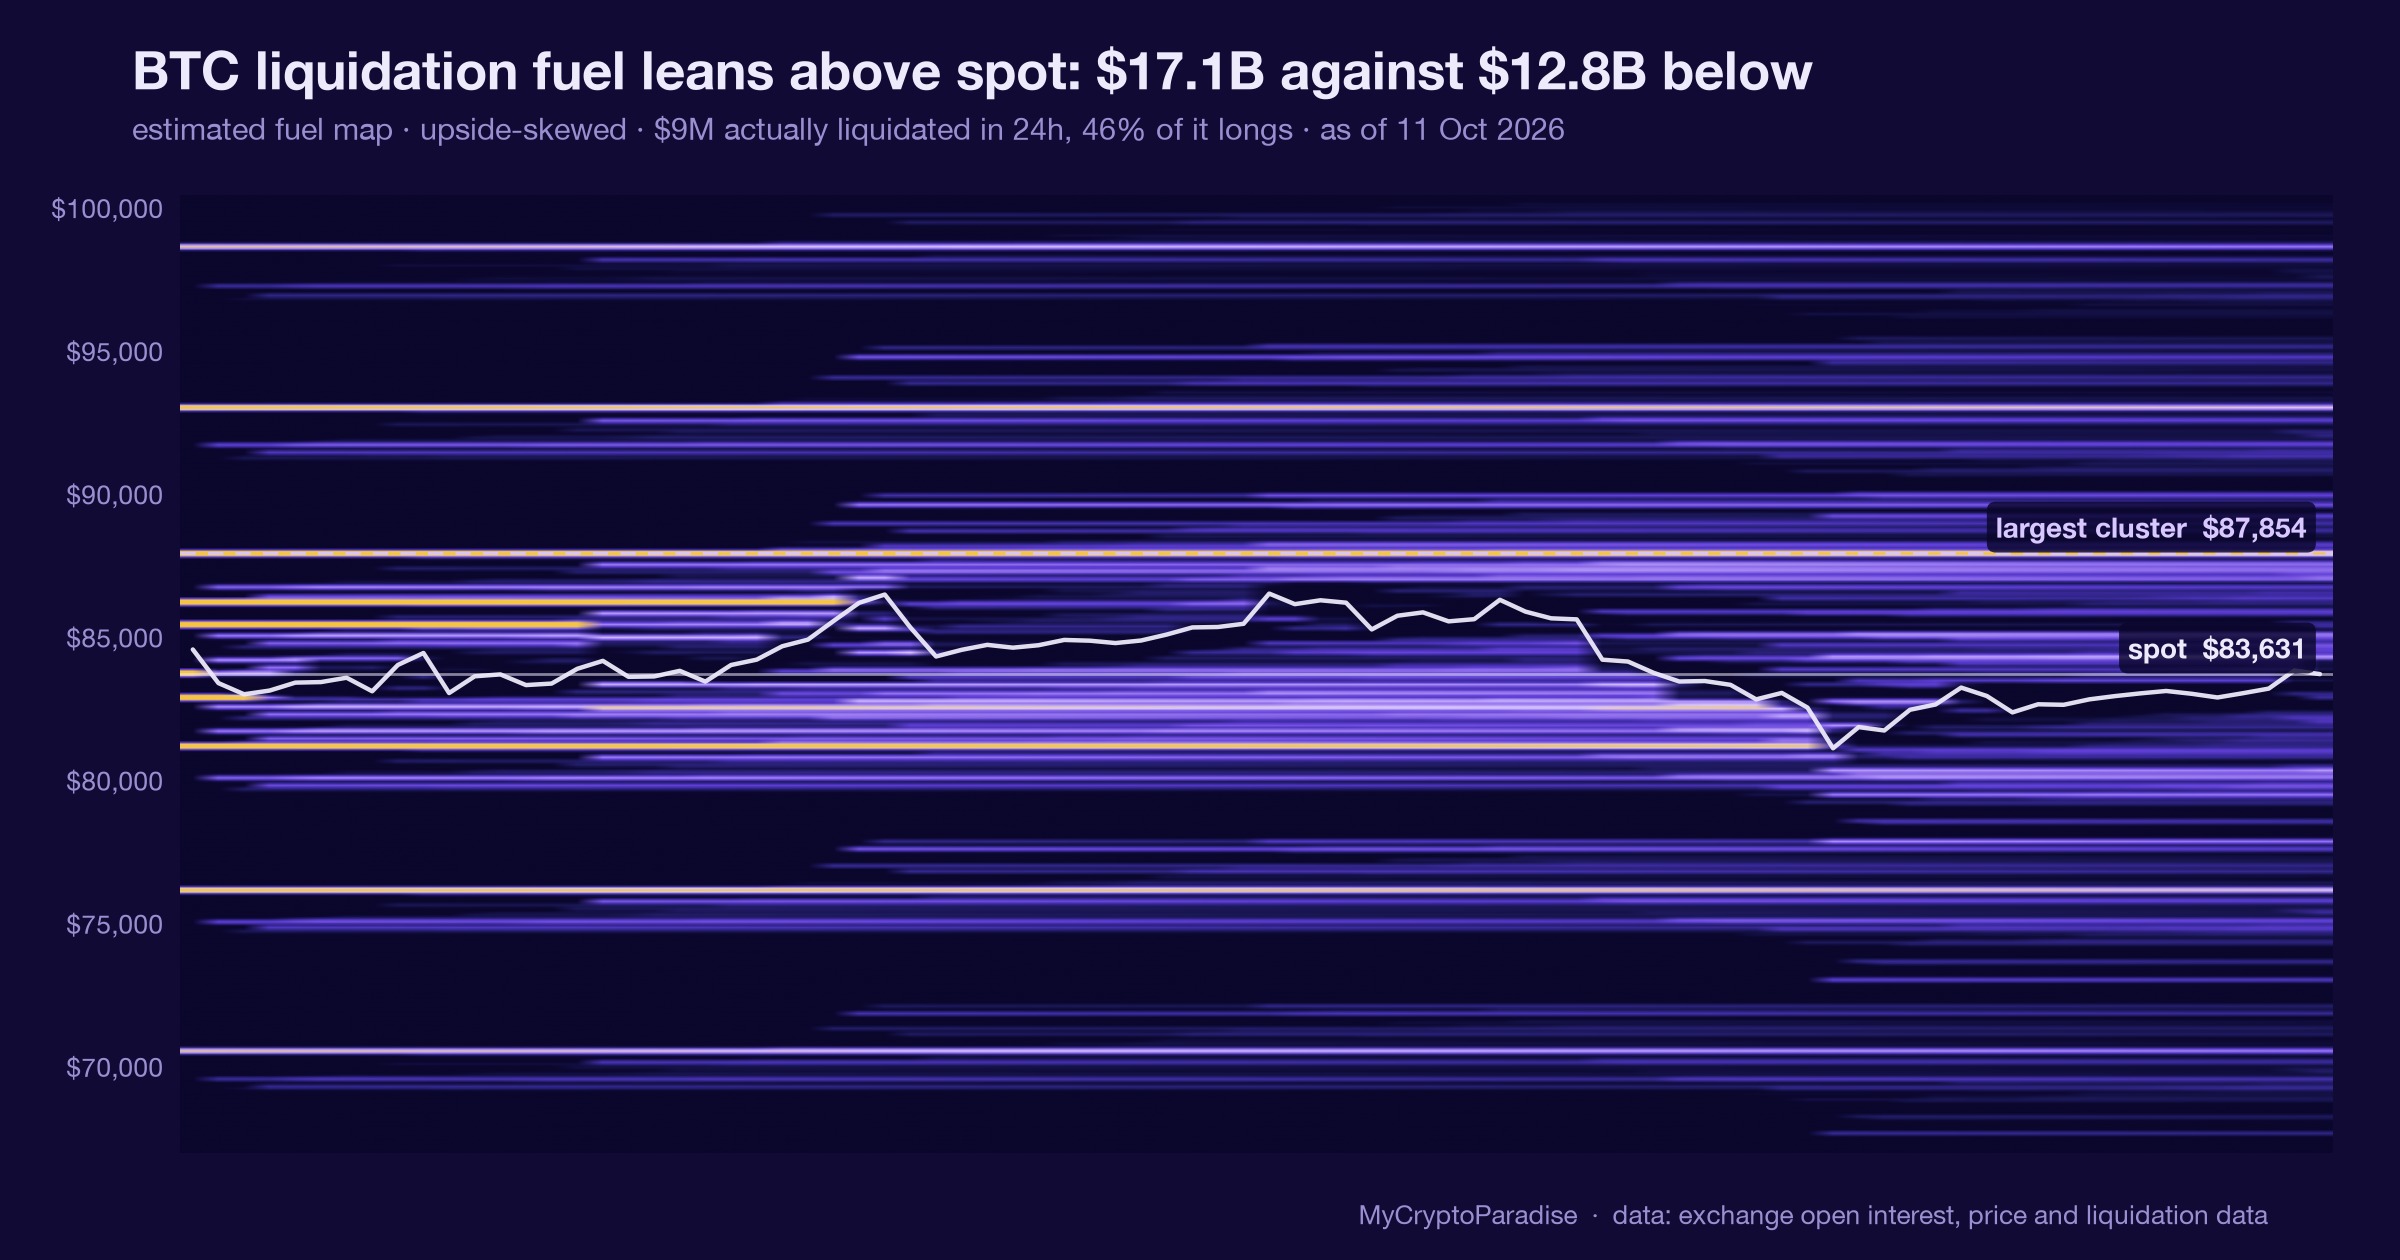
BTC’s liquidation heatmap flipped upside-skewed on 11 October: $17.1B fuel above spot, $12.8B below. How to read it, and where it stops.
BTC’s liquidation heatmap flipped upside-skewed on 11 October: $17.1B fuel above spot, $12.8B below. How to read it, and where it stops.
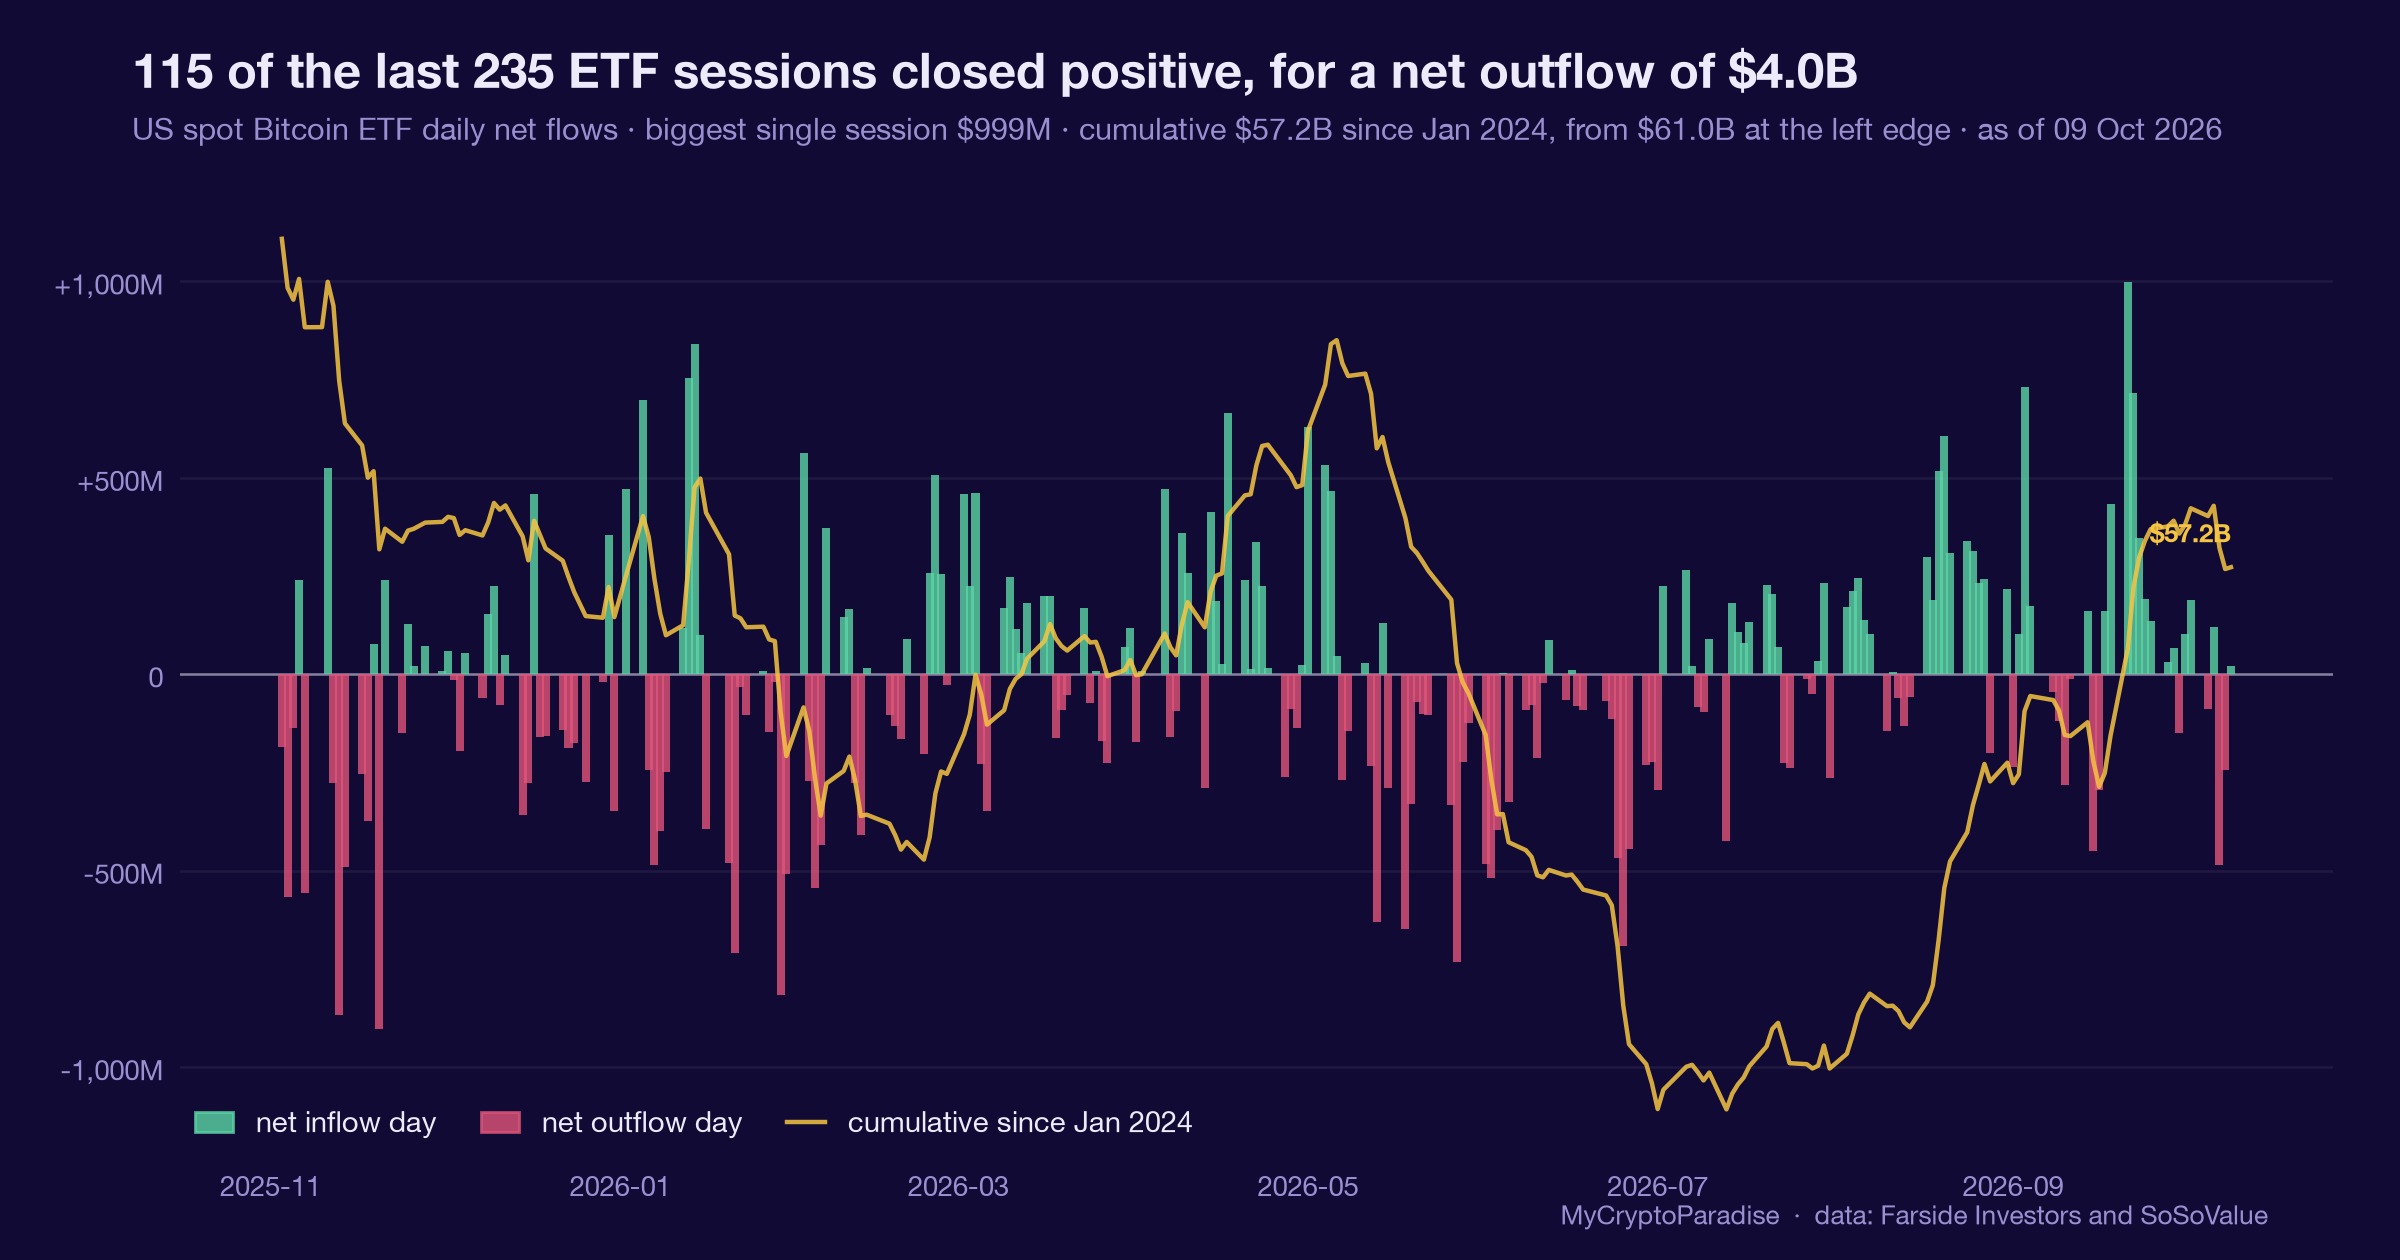
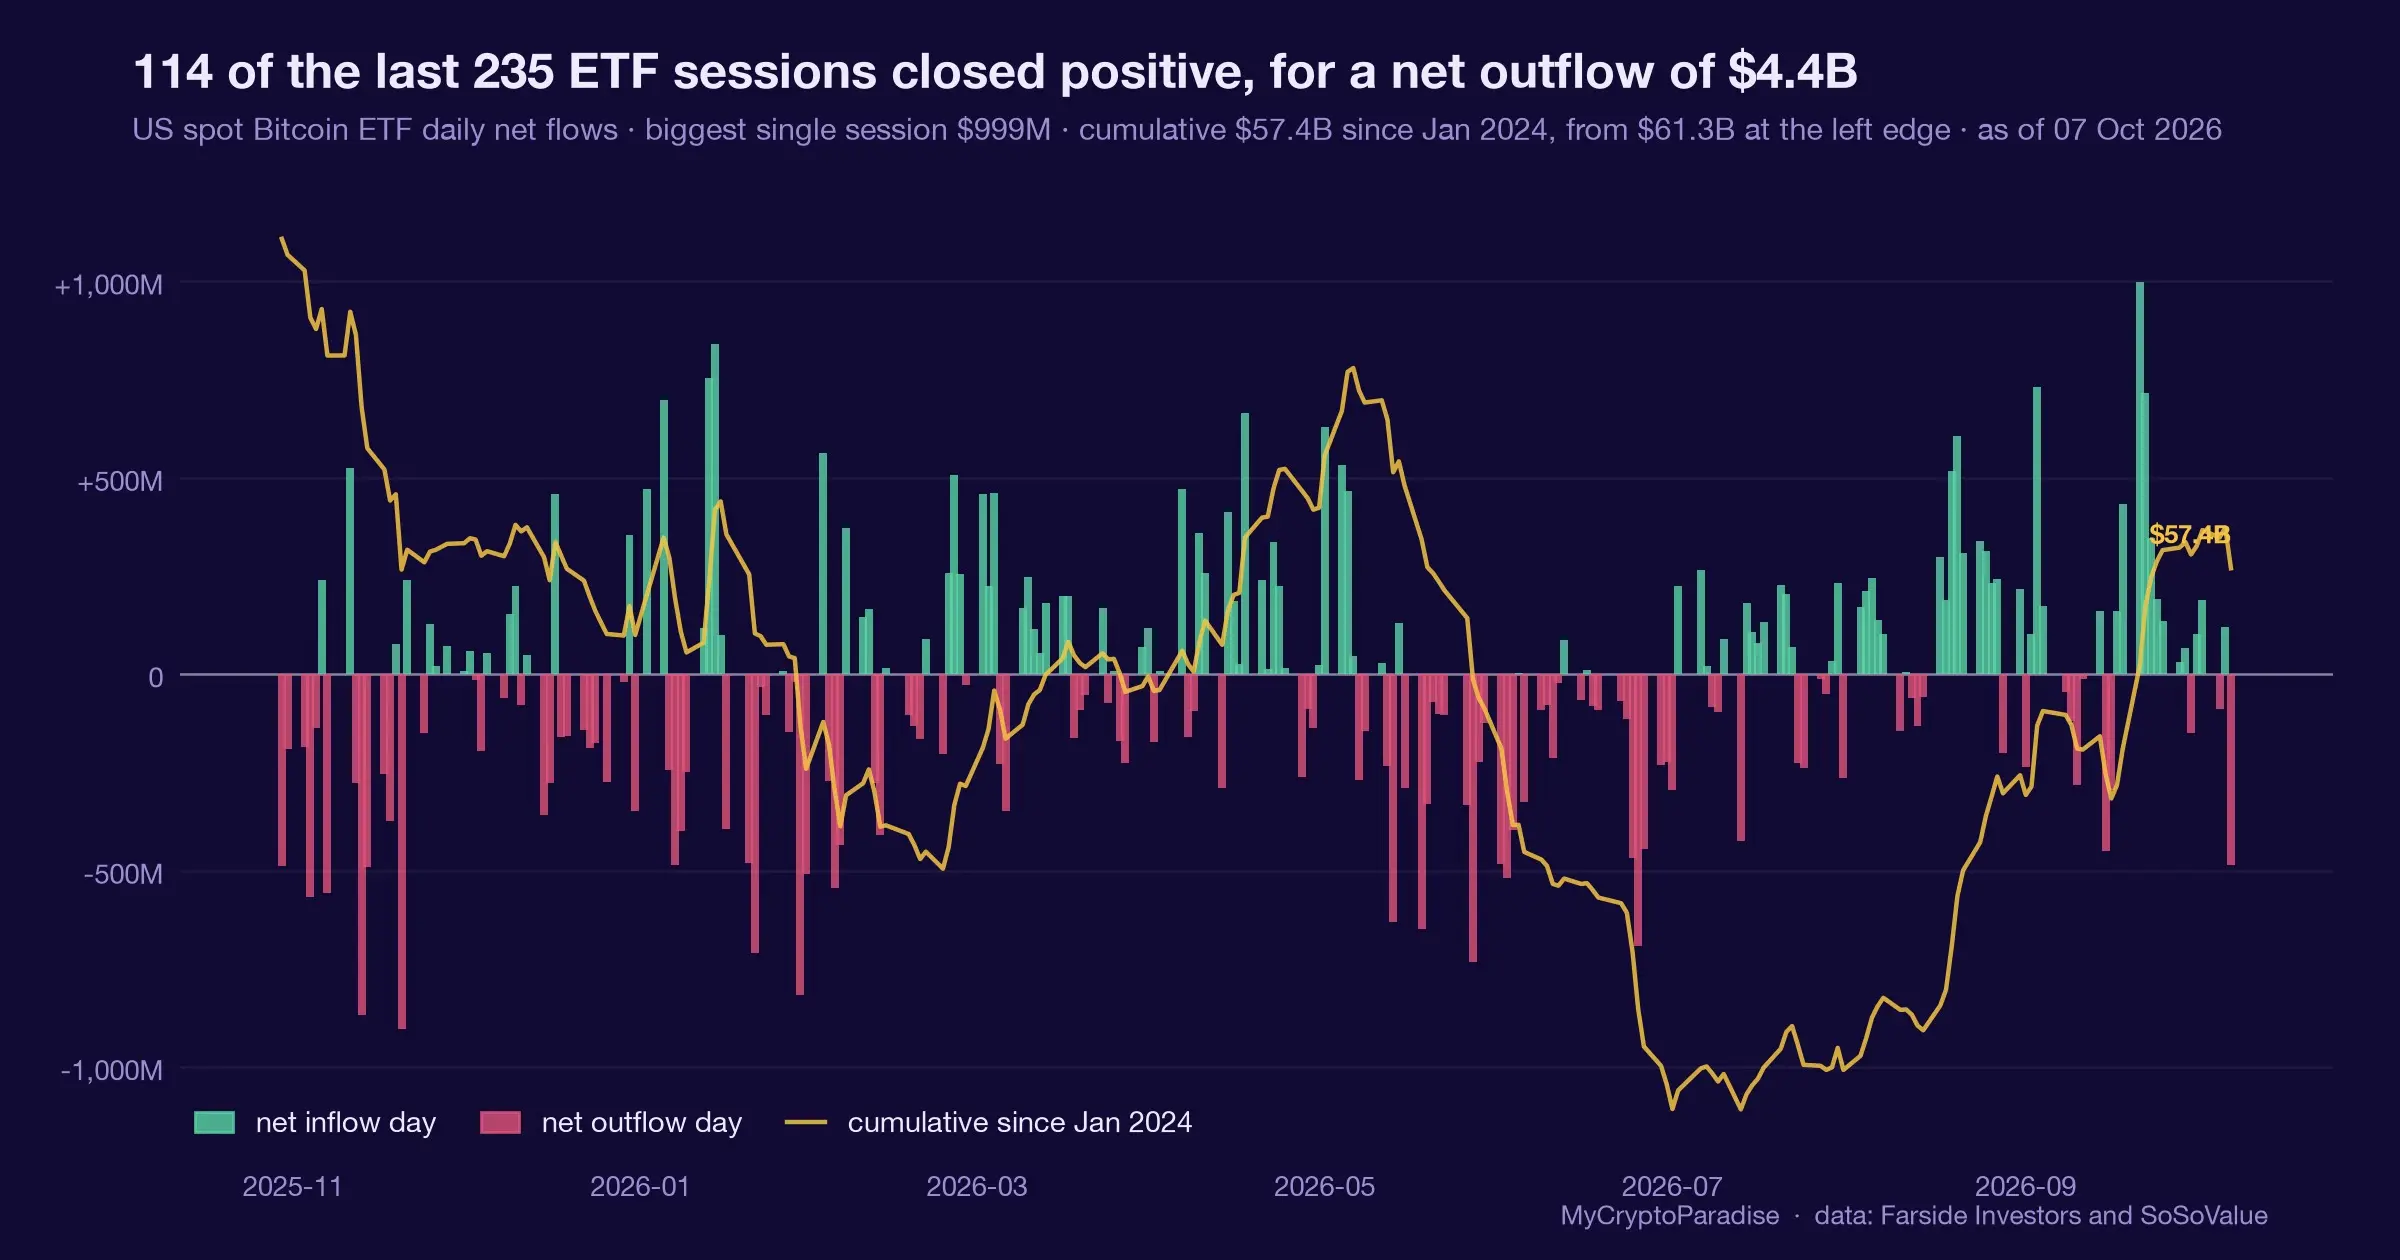
Bitcoin ETFs lost $681.1M over five sessions to 9 October, yet the outflow ranks only in the 26th percentile and the 30-day net stays positive.
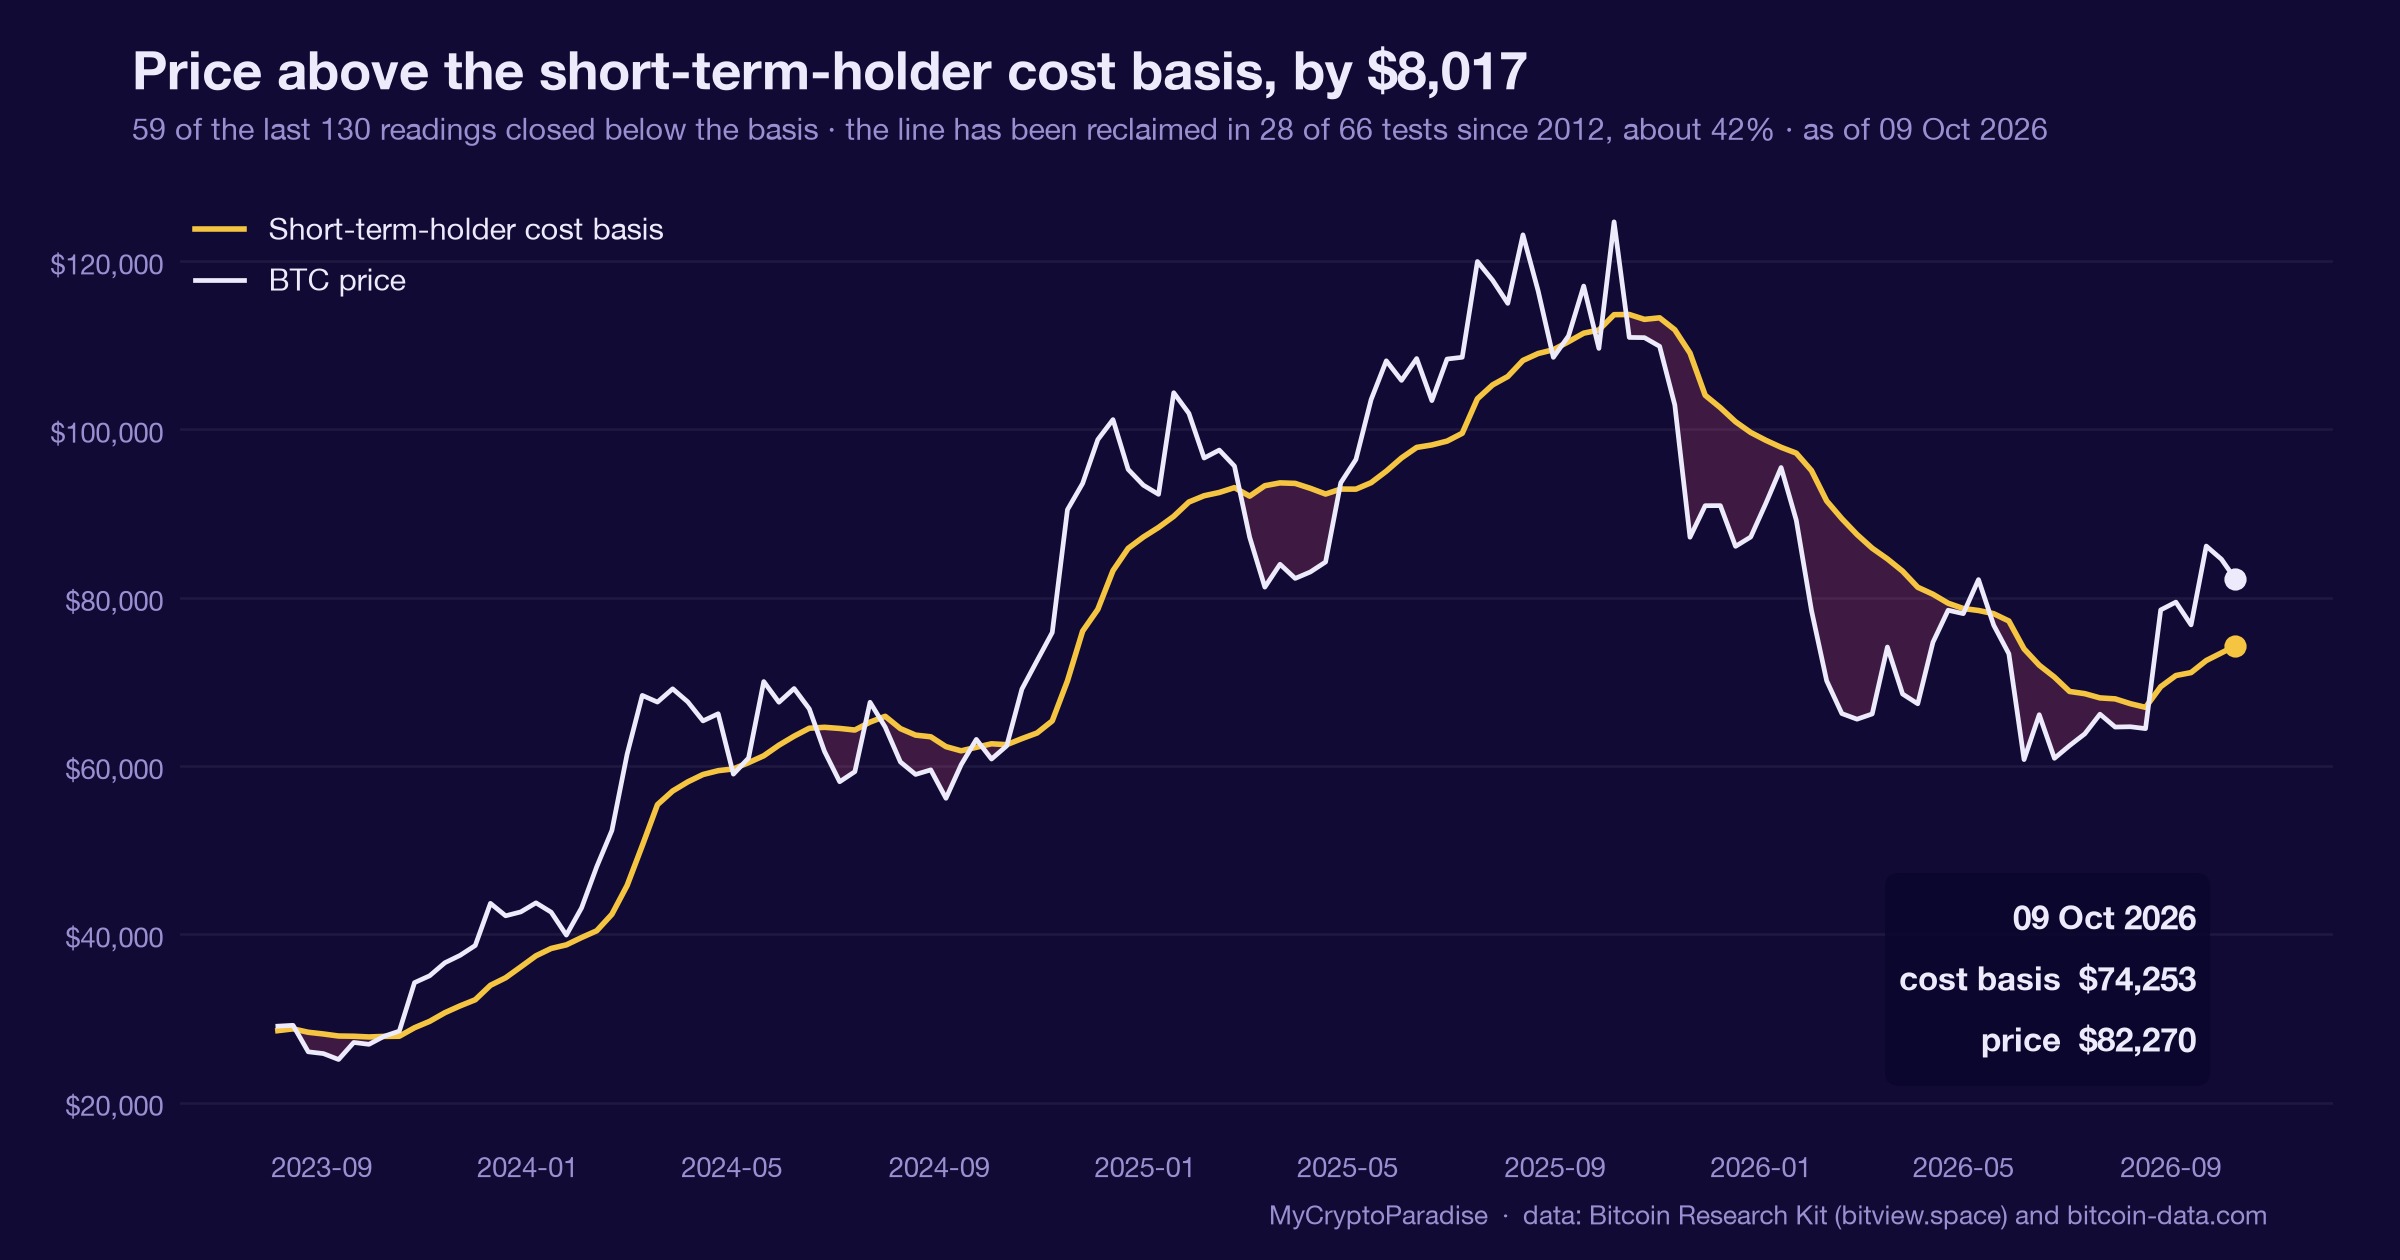
Bitcoin trades 53% above its realized price, yet 31% of supply is underwater. How to read the cohort cost-basis split and its invalidation level.
Bitcoin’s two biggest buyer cohorts share a break-even floor. How to read ETF cost basis, and the level that flips the read.
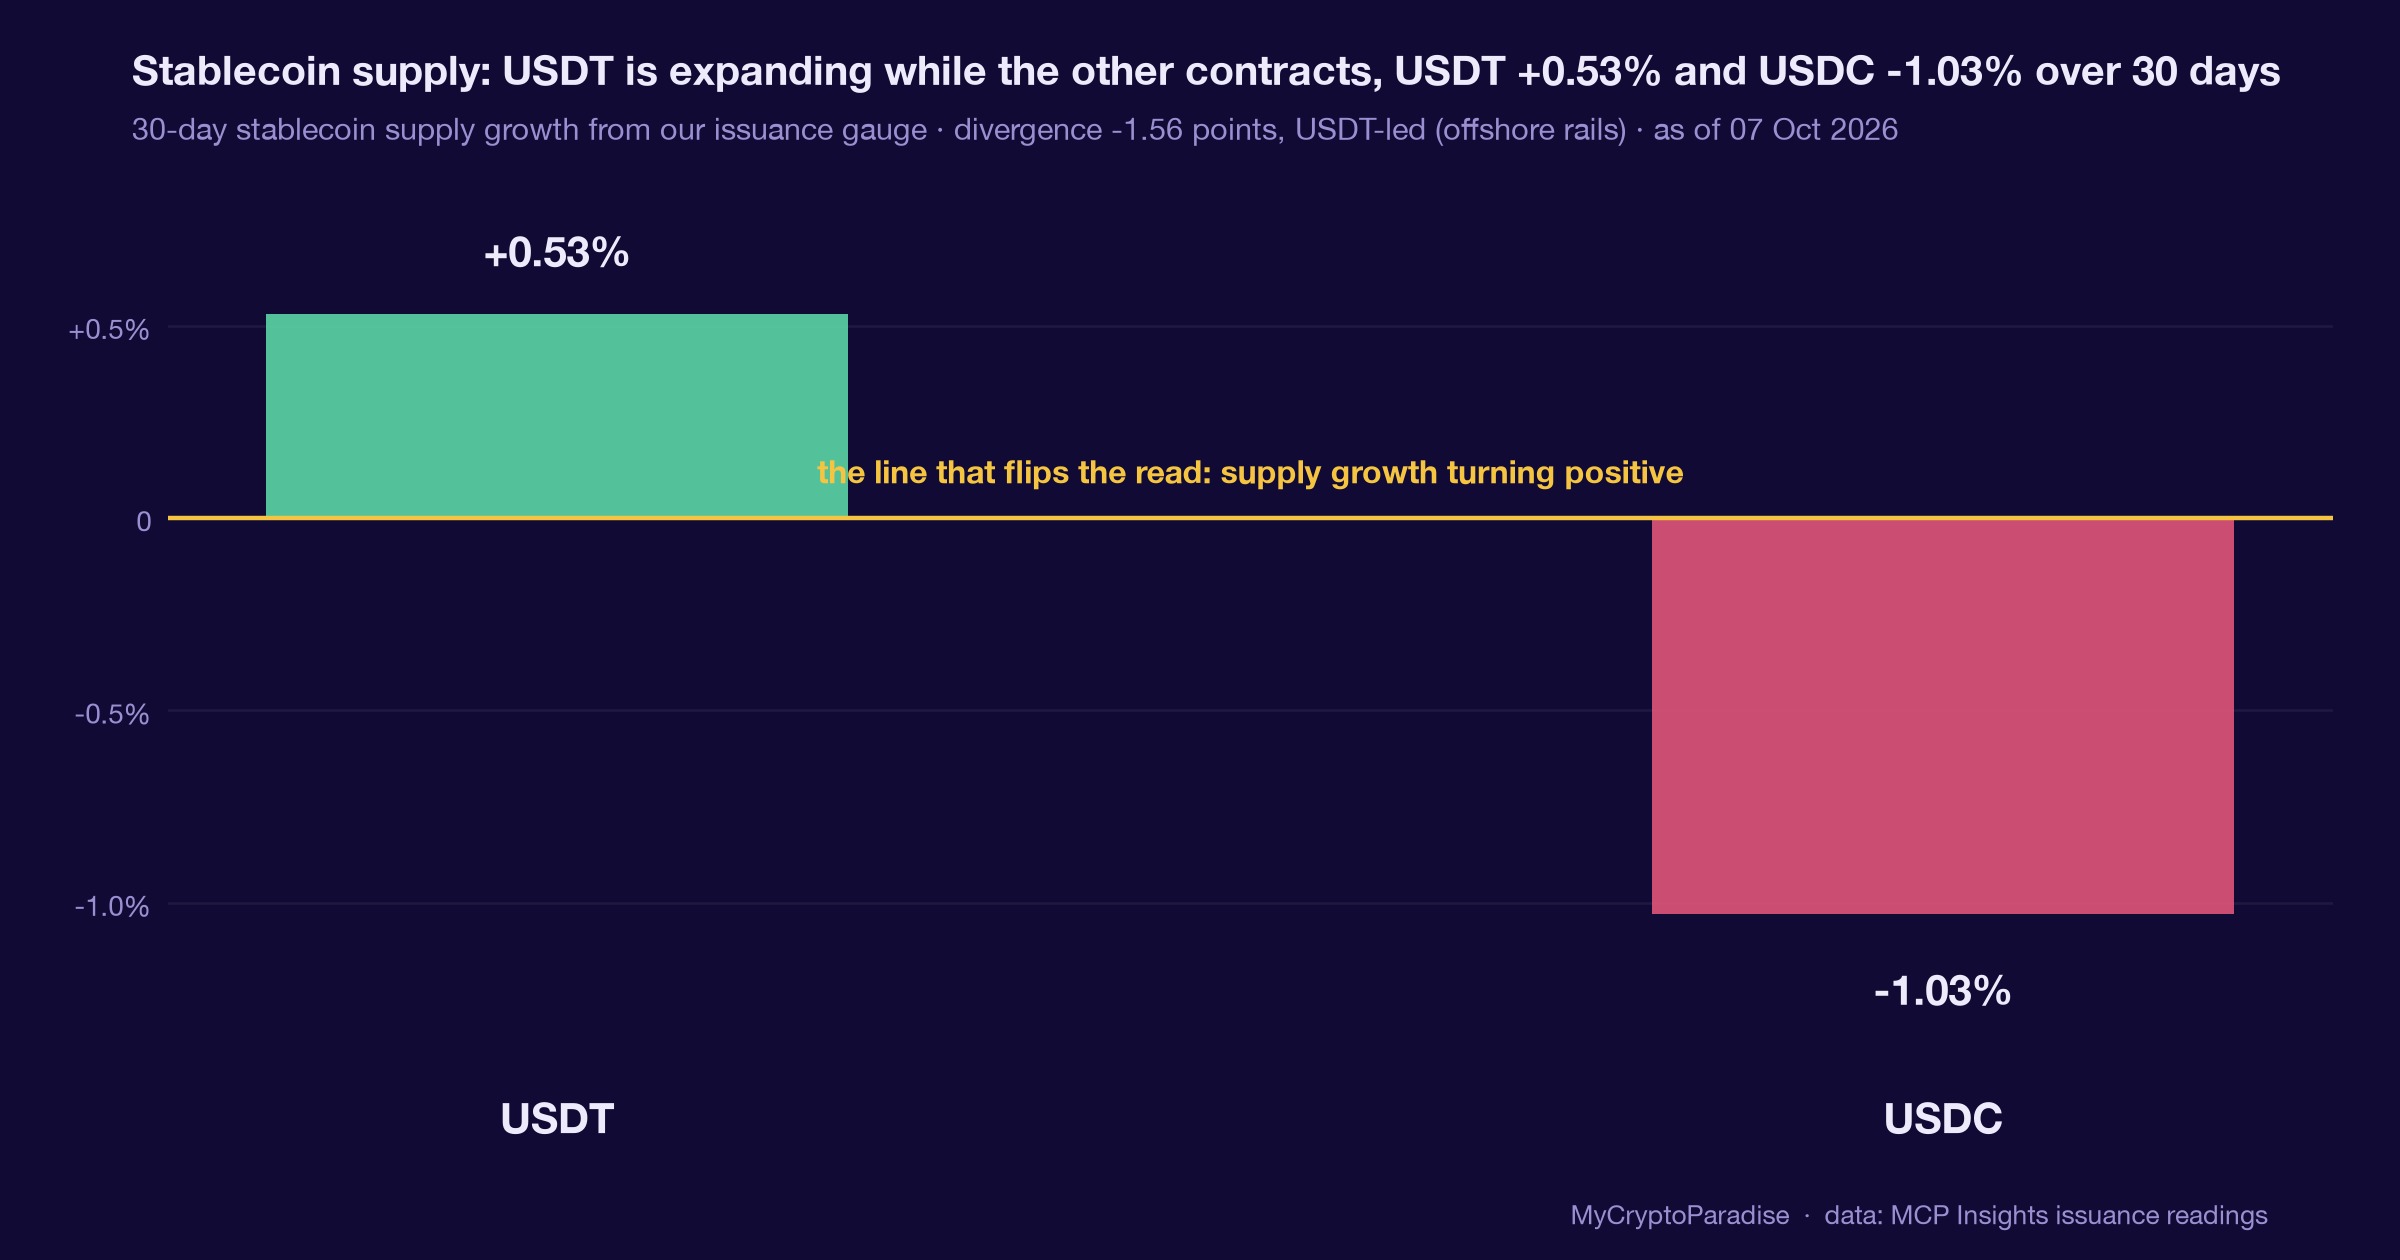
The US Government parked $471.7M of seized coins at Coinbase Prime while Korea’s premium hit the 99th percentile and US spot distributed.
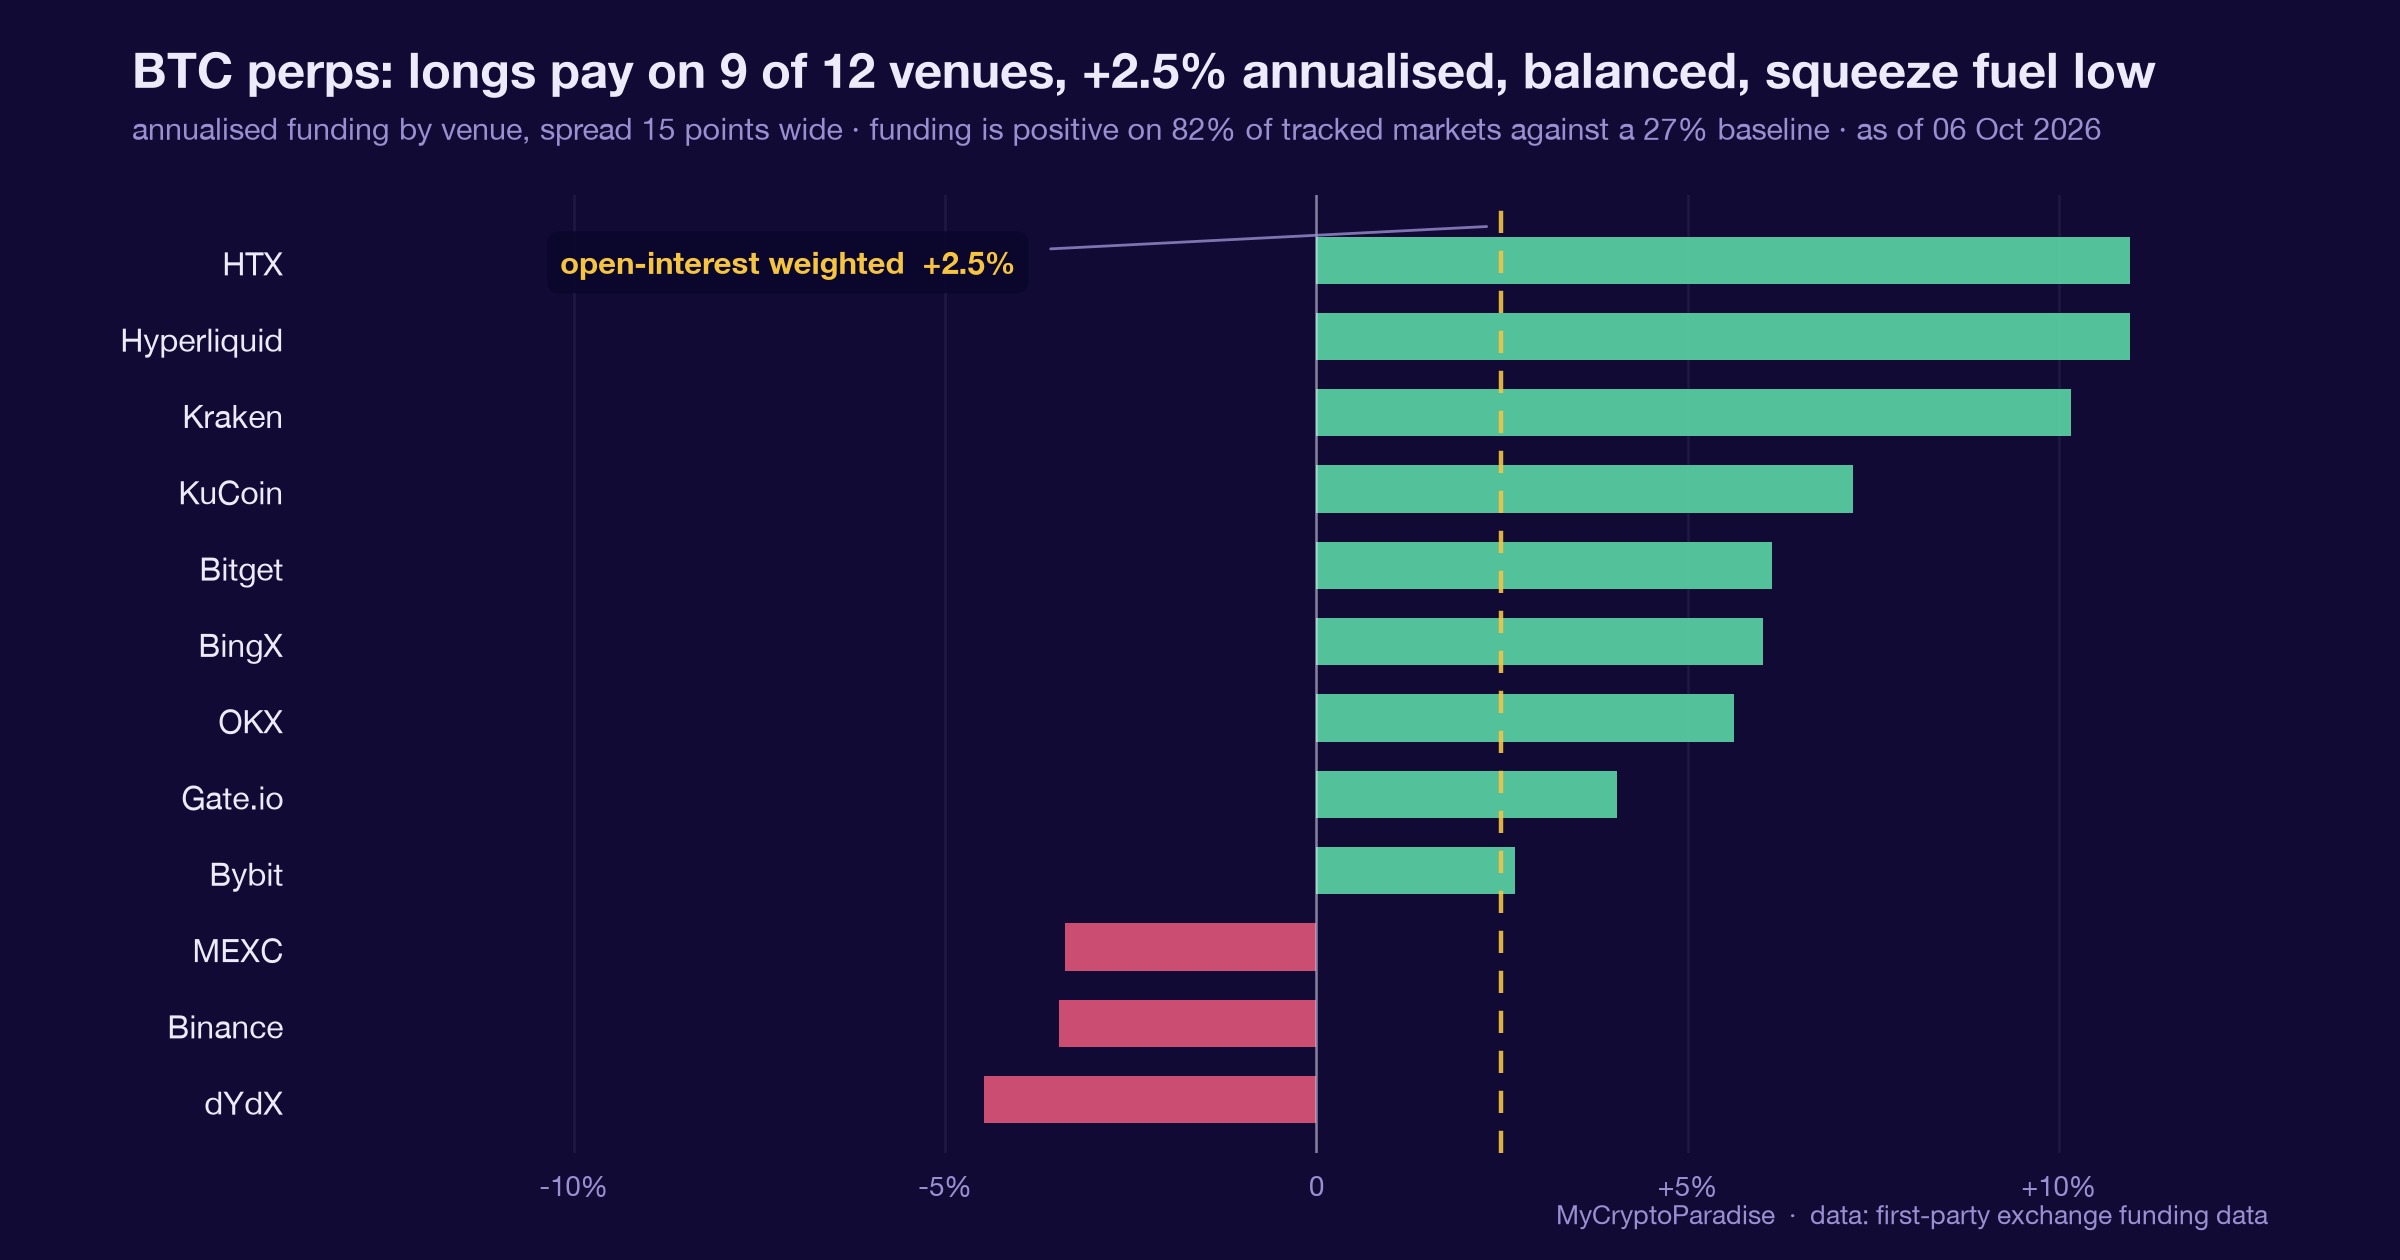
Bitcoin keeps leaving Binance while perpetual funding stays near neutral: spot accumulation against flat leverage, and what would invalidate it.
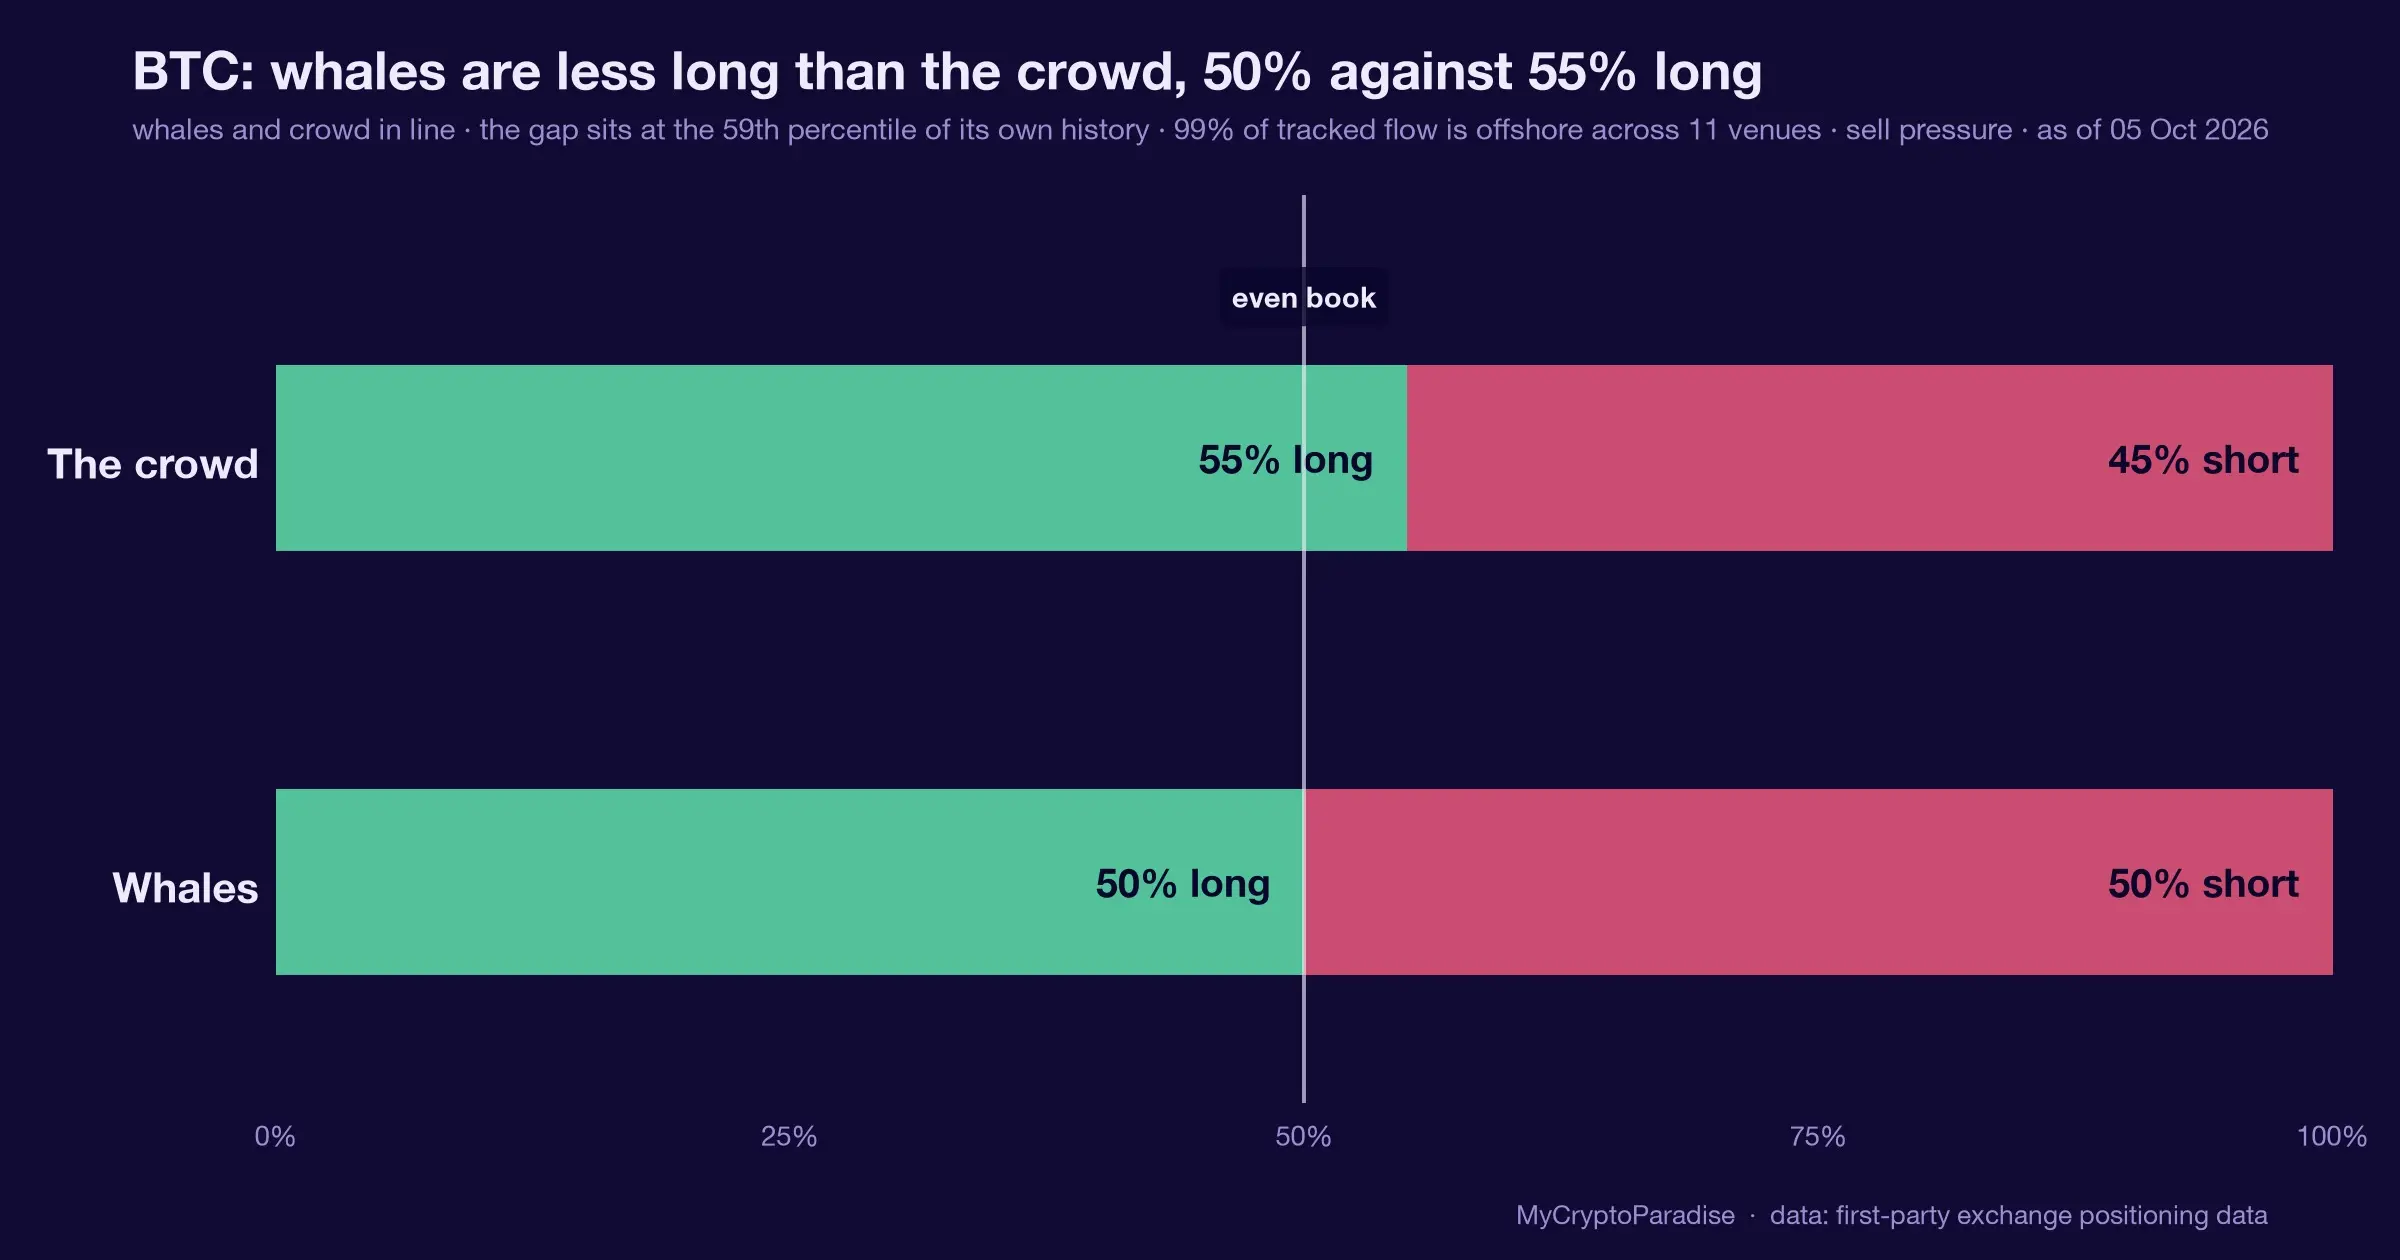
A $77.2M Bitcoin buy was called accumulation, but our whale radar logged net selling of $30.54M over 24 hours. How to read whale flow yourself.
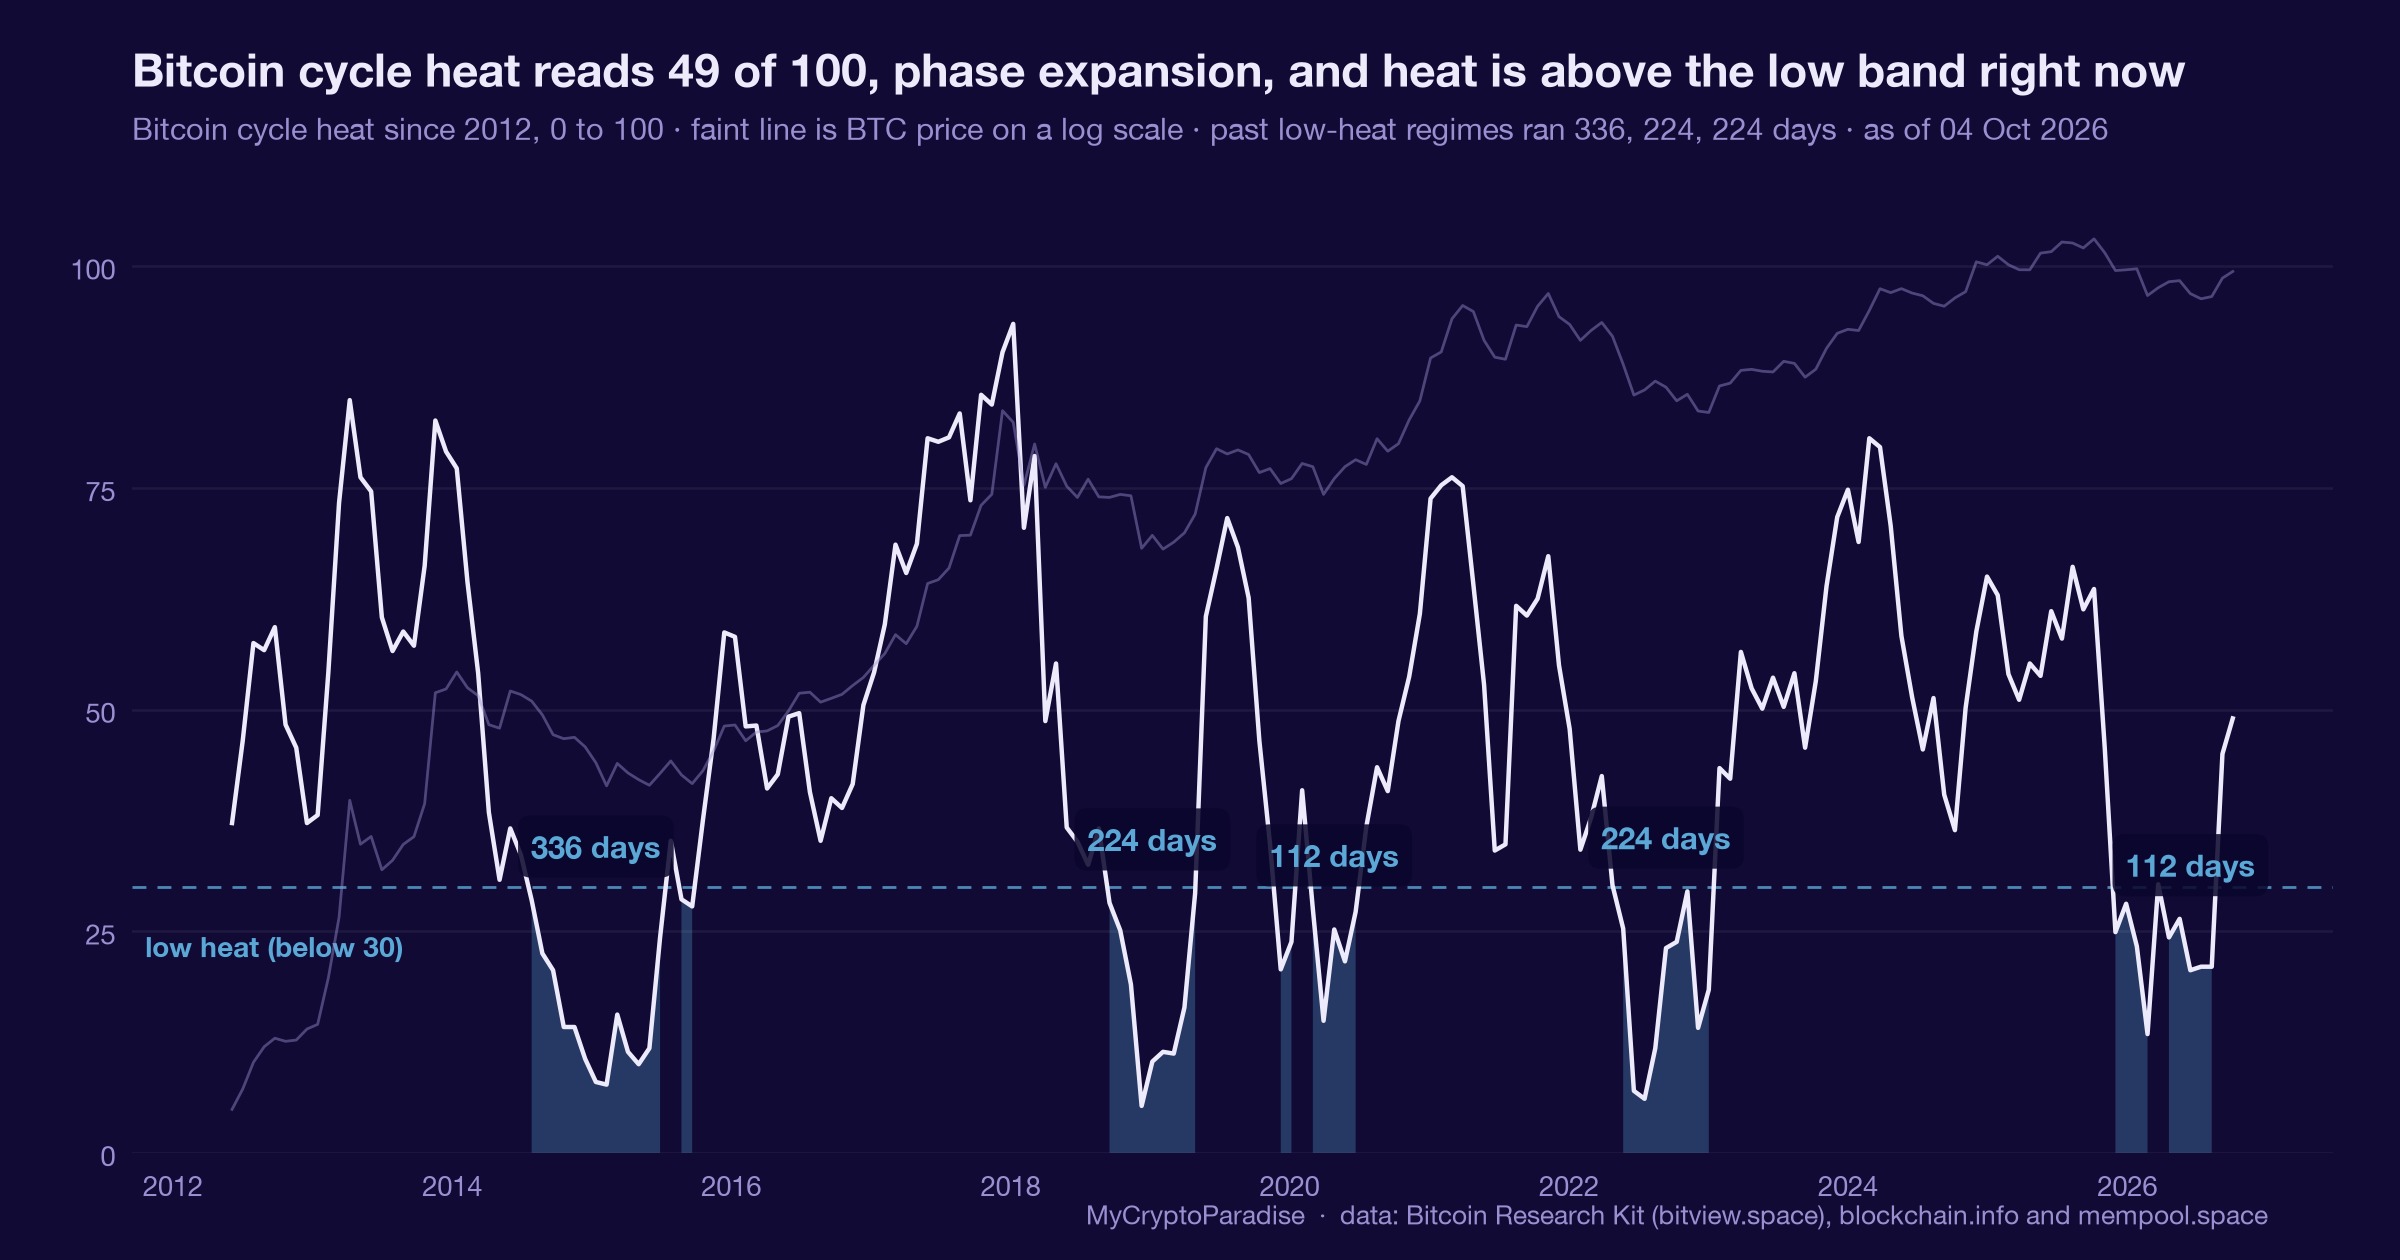
Bitcoin’s cycle gauge reads mid-expansion on 4 October 2026: valuation headroom, but spot demand is recovering only timidly. How to read it.
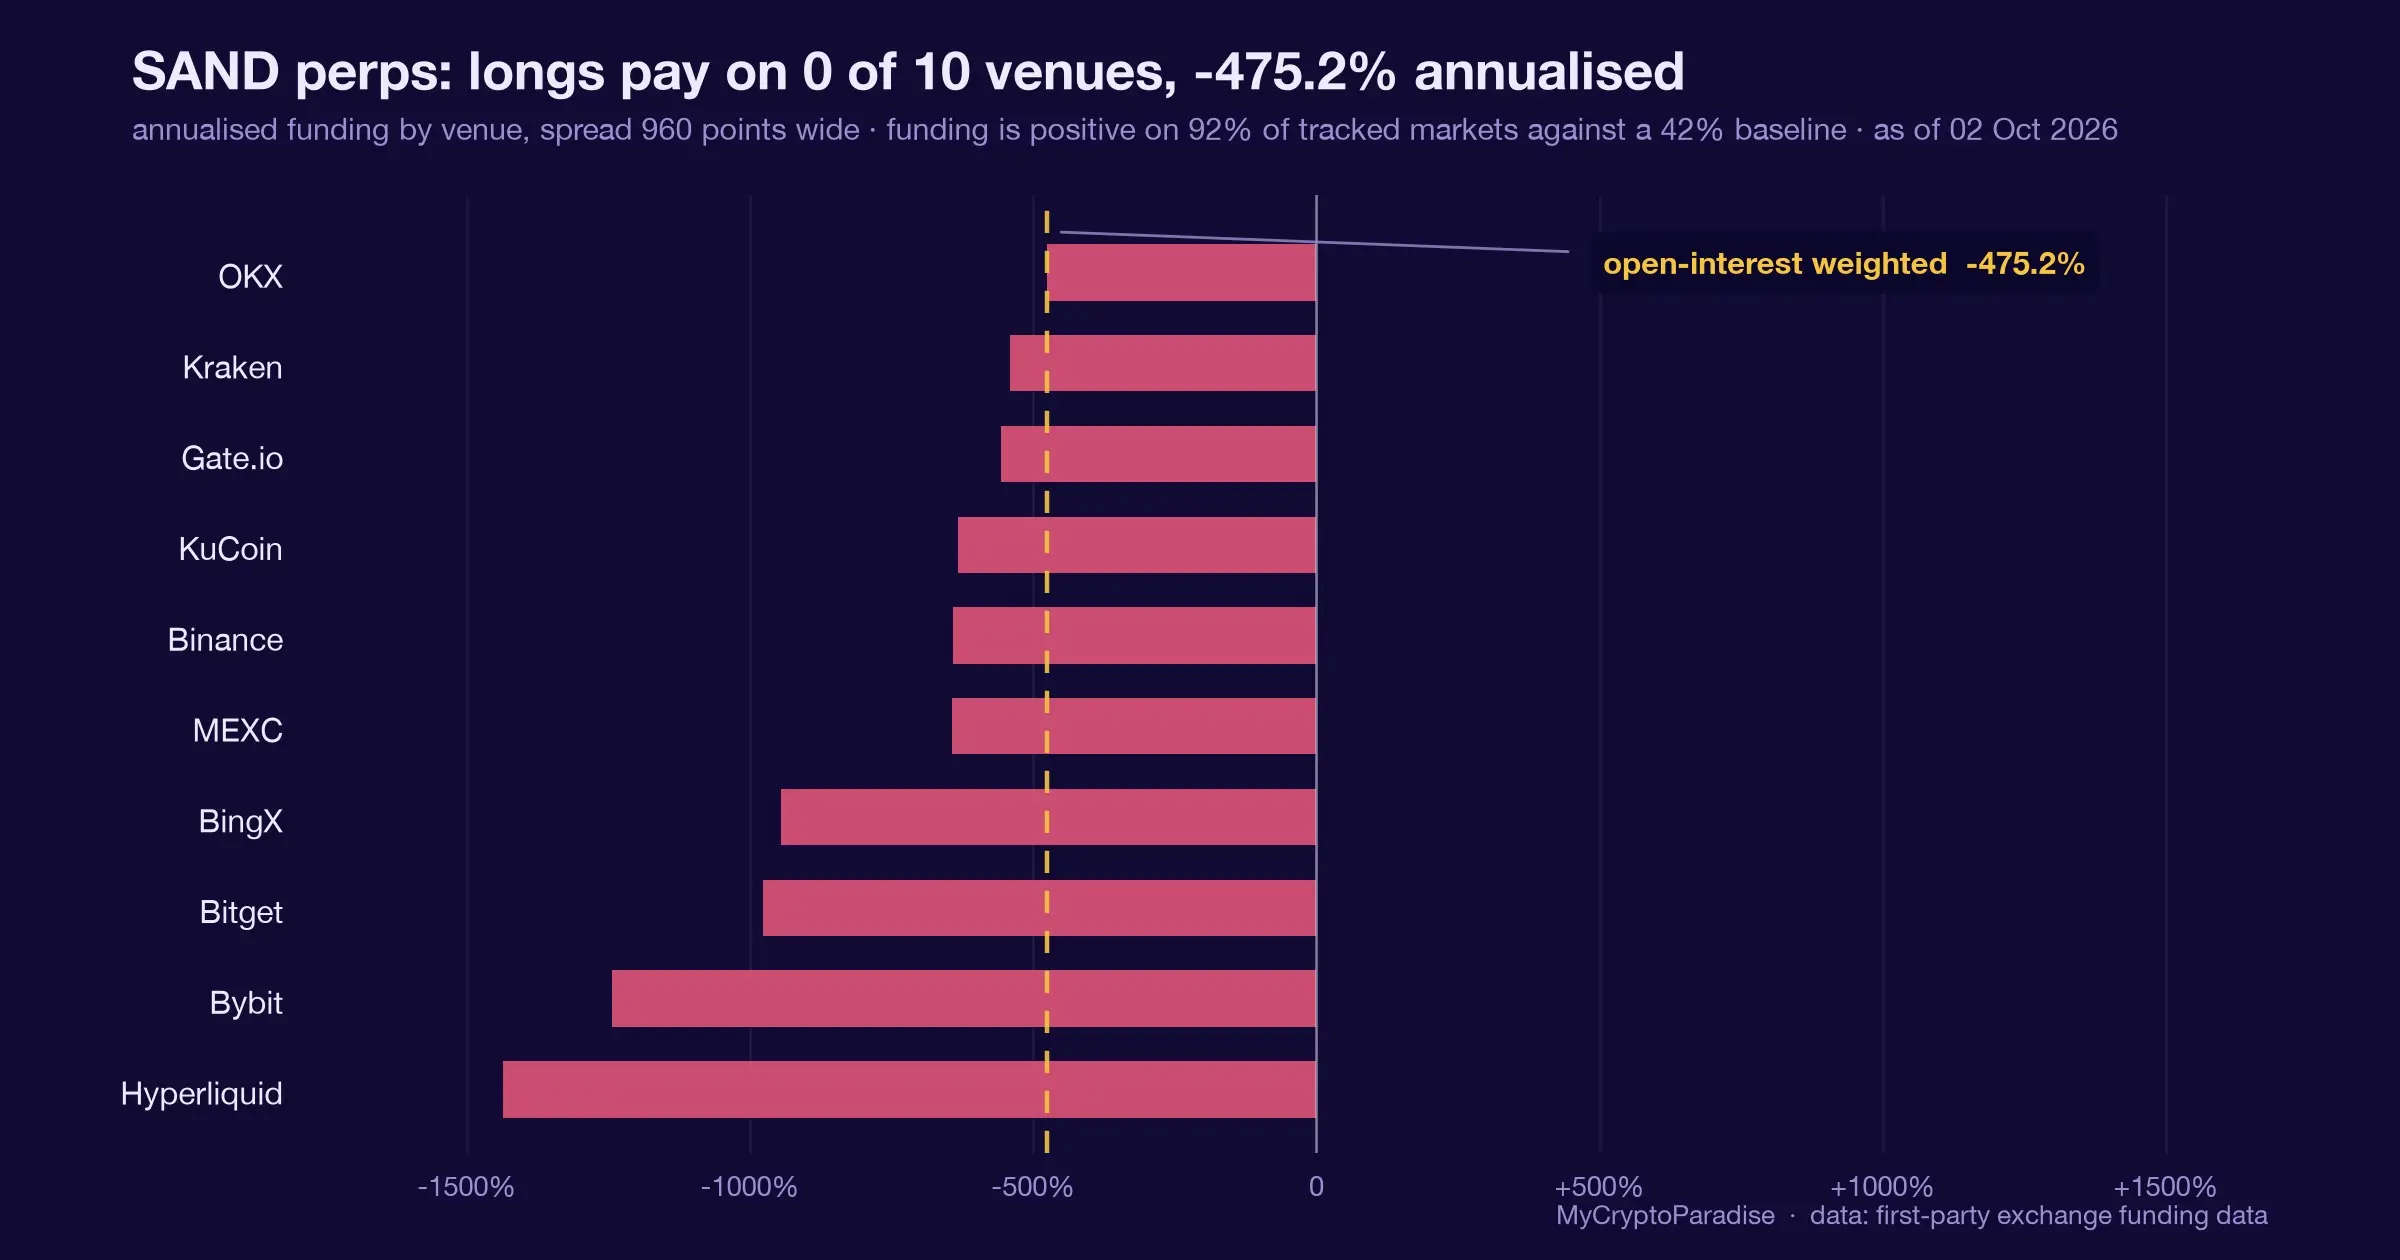
SAND is paying minus 477 percent funding, the market’s most stretched short-paid rate. We read a lone funding outlier and what invalidates it.
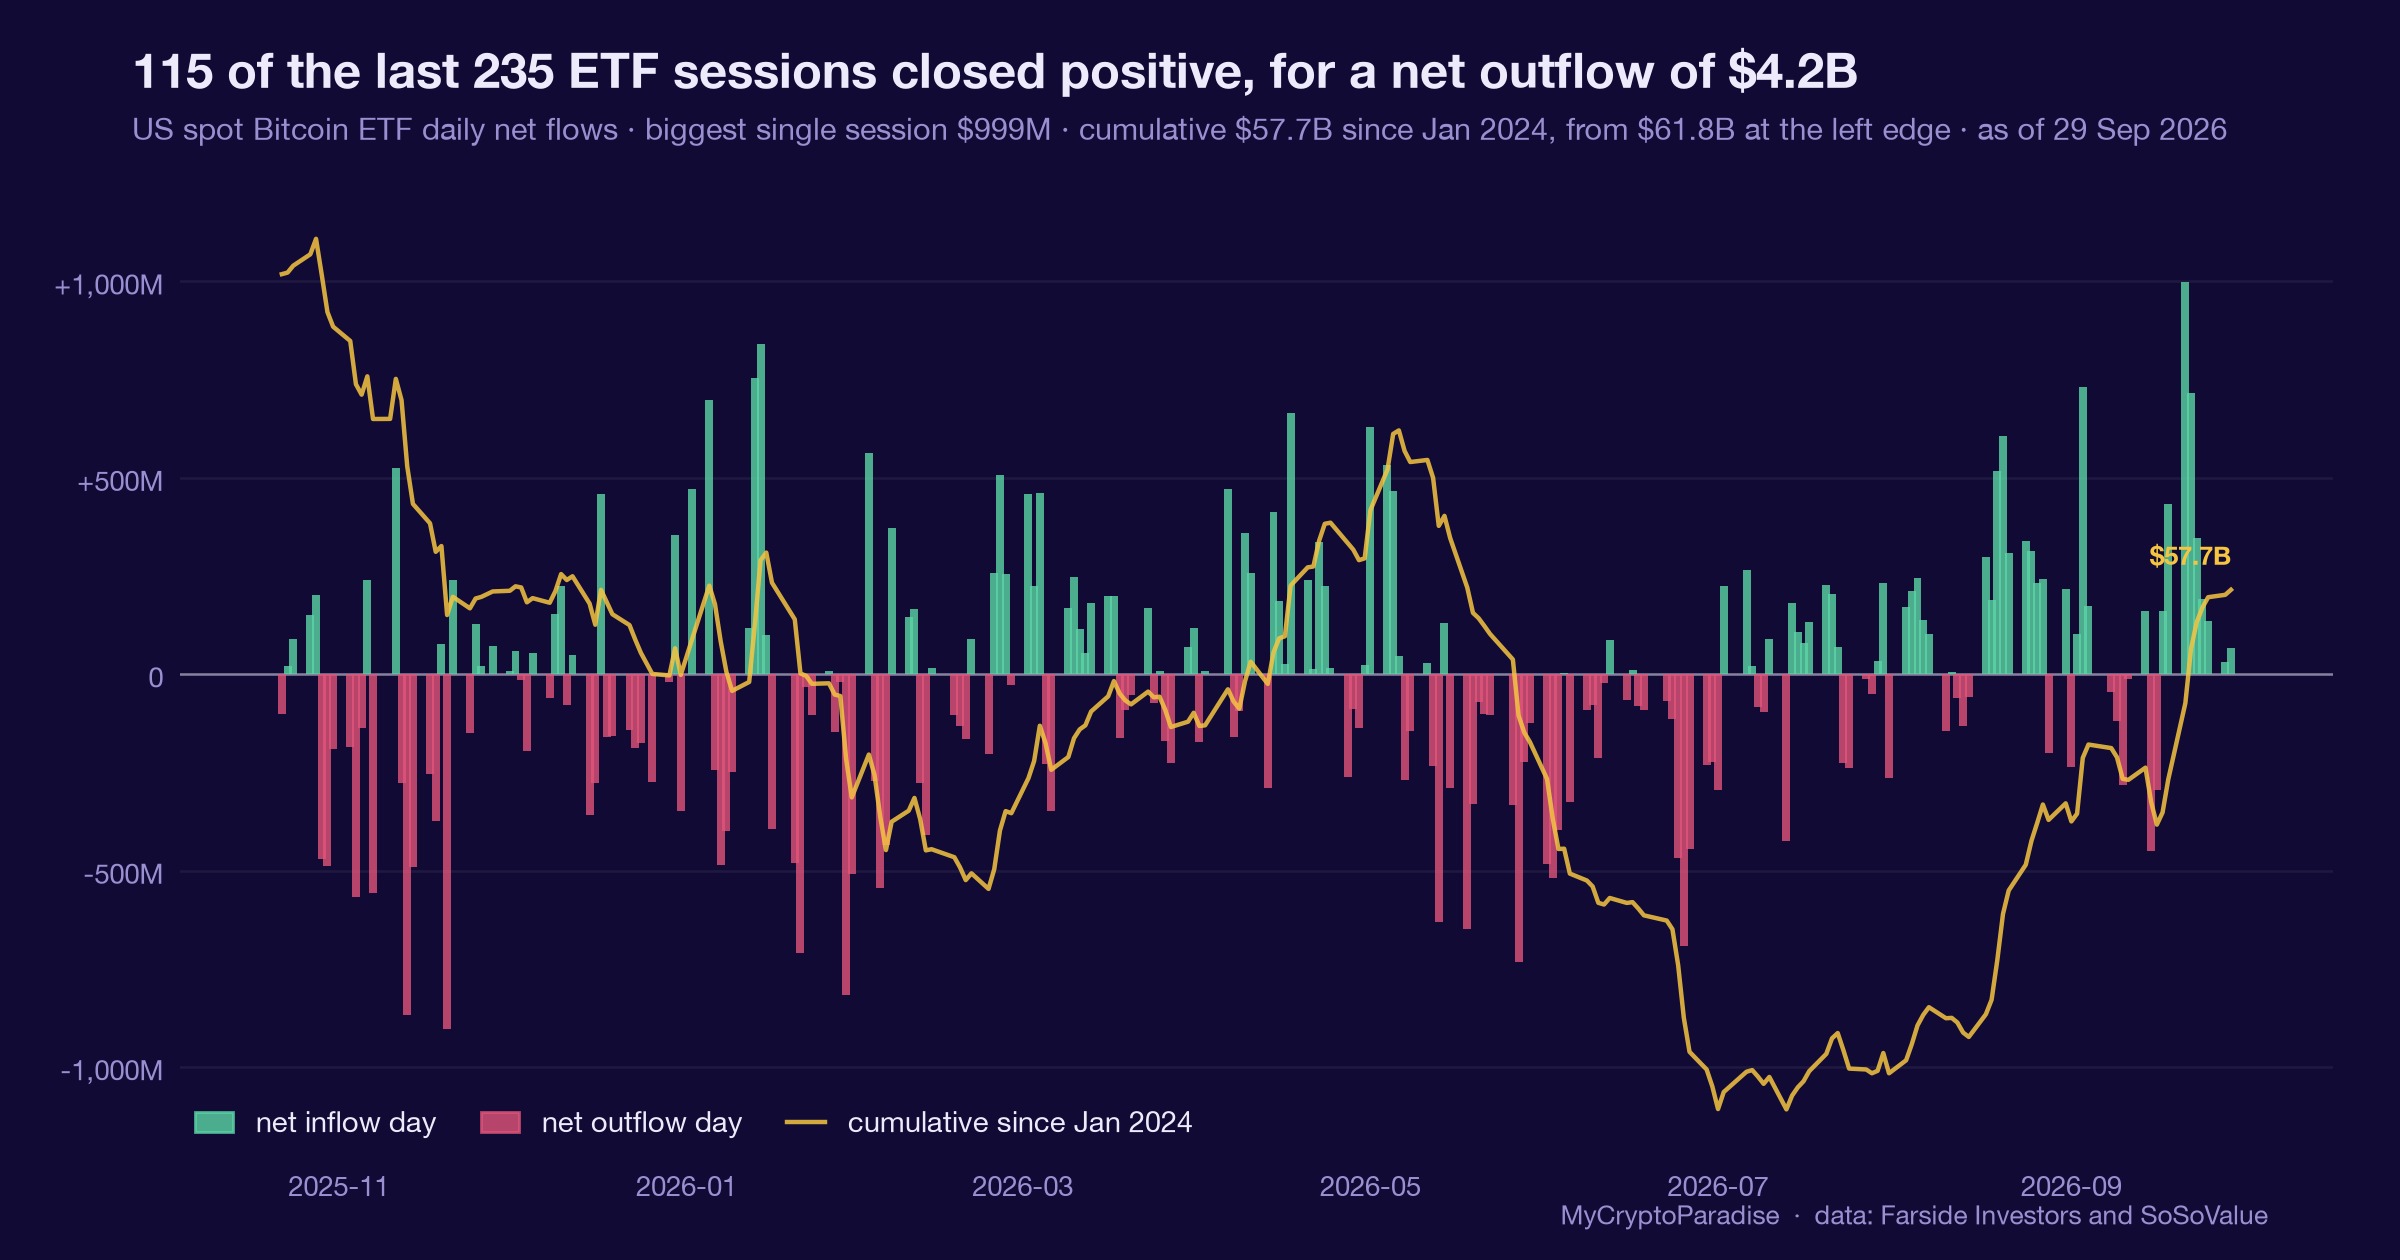
BlackRock sold $9.5M into a $148.7M Bitcoin ETF outflow, yet our tide grade held at 53. How to read fund flows without flipping on one red day.
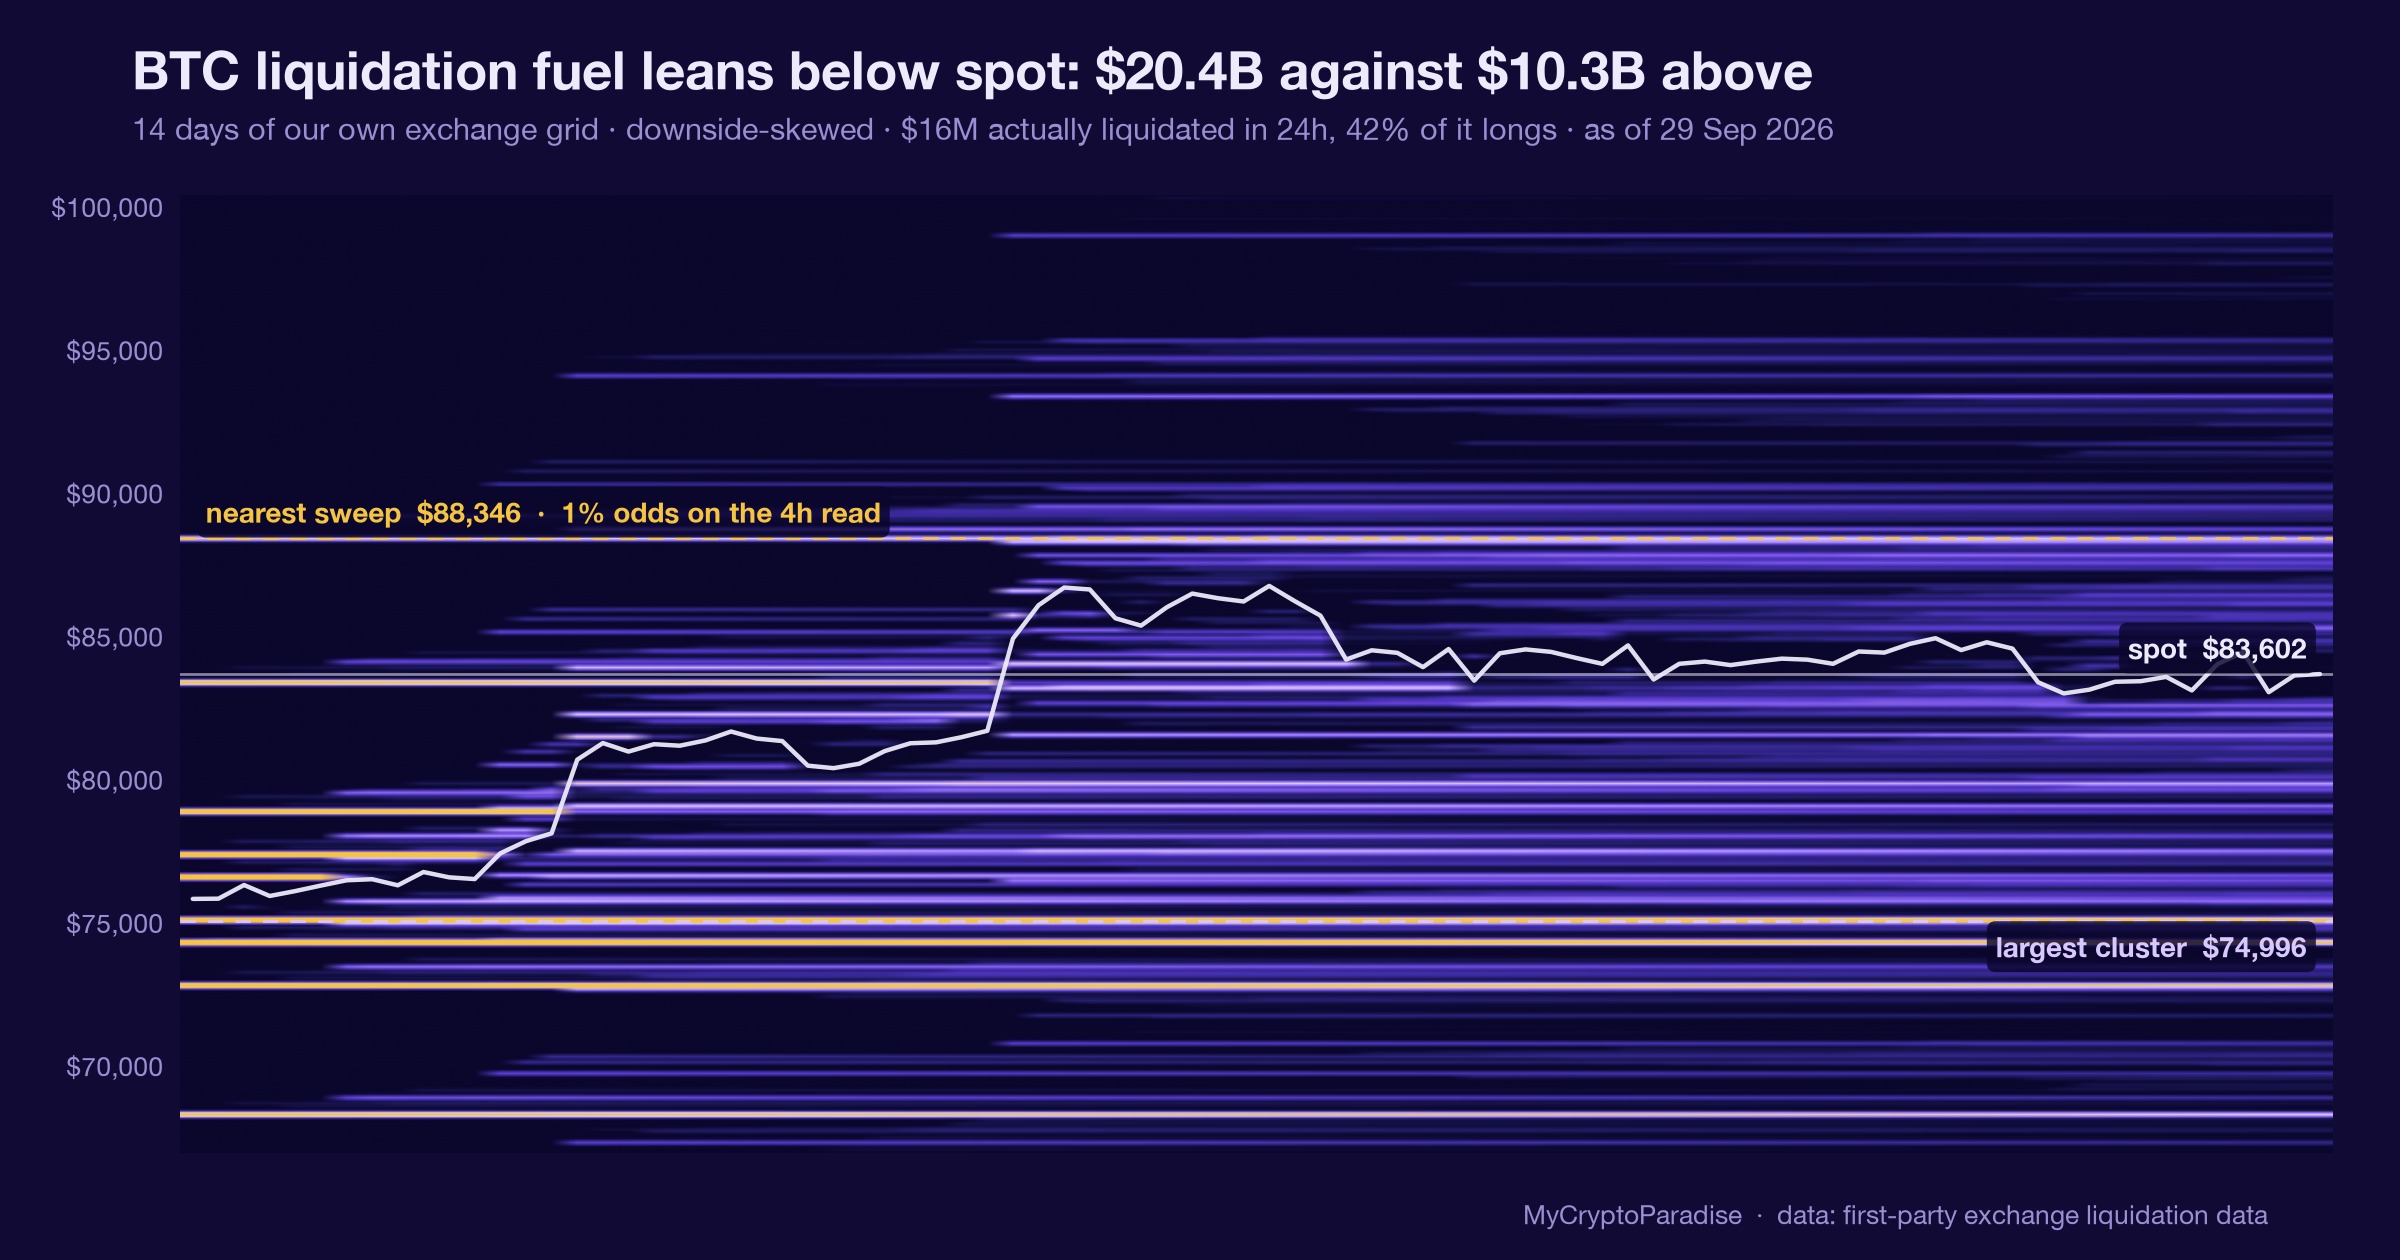
A BTC liquidation heatmap maps forced sellers, not resting bids. We read today’s estimated map against the order book, and lean neutral.
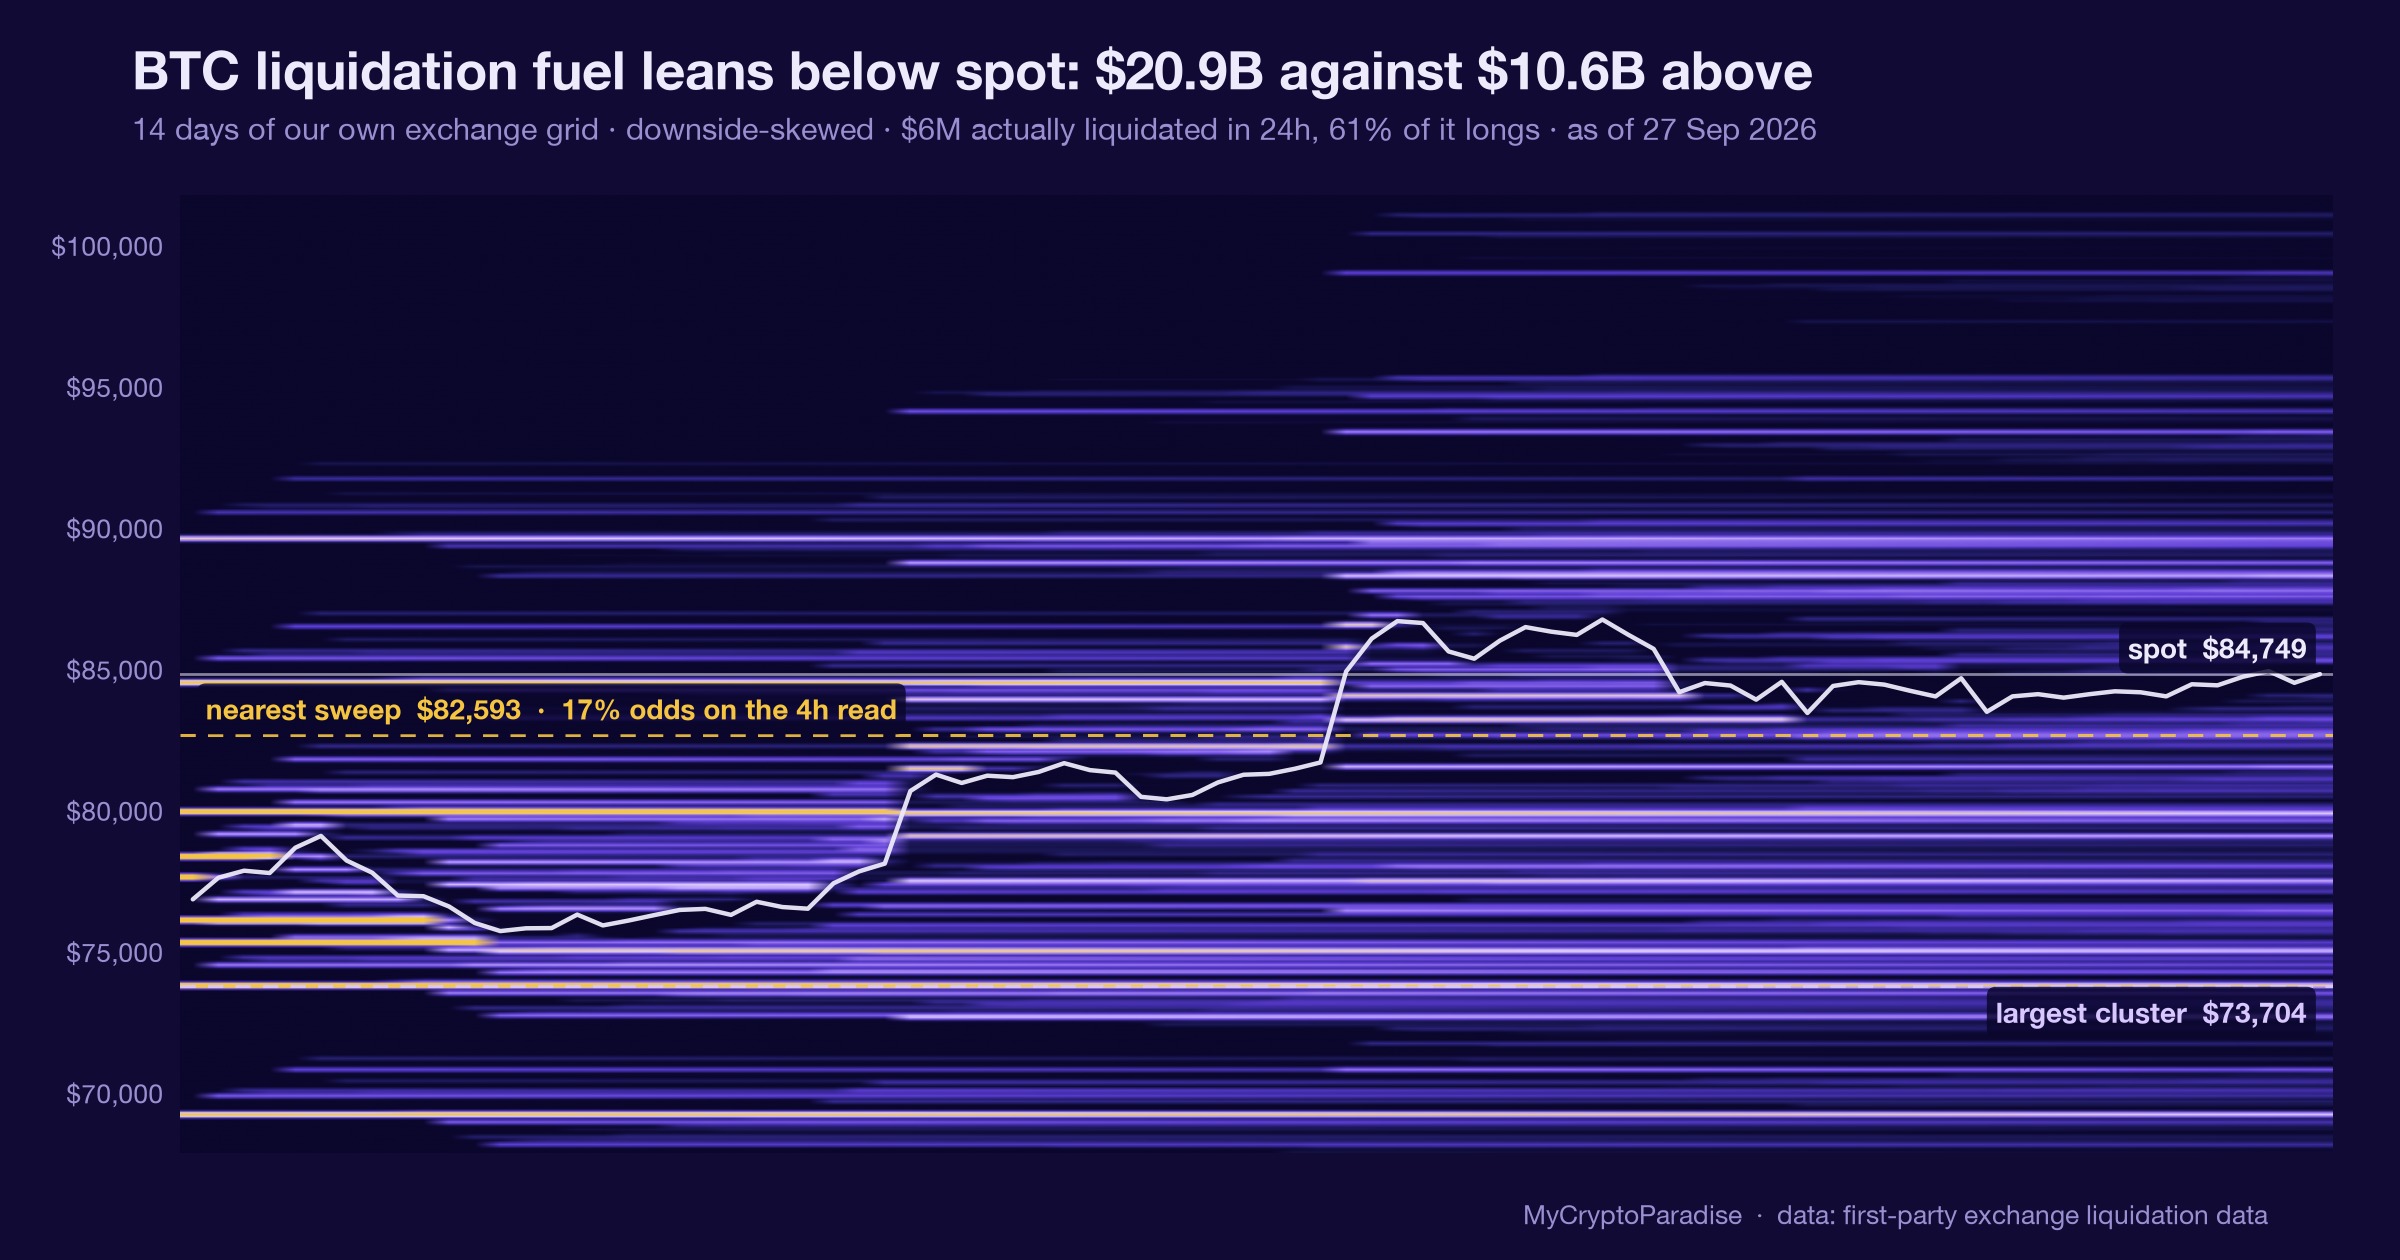
How to read Bitcoin’s liquidation heatmap: three high-leverage pockets stacked overhead, why liquidity pulls, and what invalidates the lean.
 Chat with one of our tradersChat with a trader