

In short
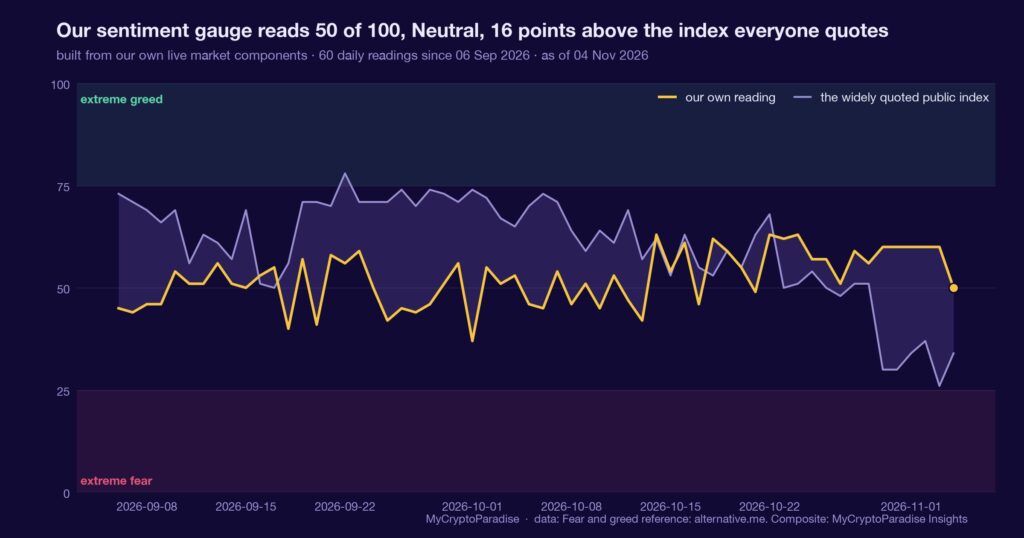
A crypto sentiment index rolls positioning, volatility and momentum into one reading of crowd posture, not a price forecast. On 4 November 2026 our MCP Insights sentiment estimate read 50, Neutral, while its fast four-hour dial jumped to 77, Greed, and the daily recovered from a 31 Fear trough only to 47. Price, meanwhile, slid from about $79,000 to $76,000 over the week, per the originating alert. We called this neutral, explicitly not a recovery to trade: the fast gauge is hot while the weekly sits at 40.5 and price has confirmed nothing. The reading also runs in shadow mode, so we quote it as a model estimate, never a calibrated probability. Within a day it has graded as unresolved: posture improved, price did not follow. This piece shows you how to read a sentiment divergence yourself, one indicator among several.
A sentiment index measures posture, not price
A crypto sentiment index rolls positioning, volatility and momentum into a single reading of how the crowd is leaning. It is a gauge of posture, and posture is not price.
Because it blends fast and slow inputs, the gauge can turn before price does, lag it, or disagree with it outright. A divergence between the two is the normal state, not an anomaly.
The useful question is never whether sentiment and price agree. It is which one is leading, and whether that lead has been confirmed.
The fast dial turned hot while price fell
On 4 November 2026 our MCP Insights sentiment estimate read 50, squarely Neutral. The fast four-hour dial told a louder story, climbing 65.5, 69, 79.5 into Greed and printing 77 on the current bar.
The slower readings refused to follow. The daily estimate recovered from a 31 Fear trough through 36.5 and 41.5 to just 47, still Neutral, and the weekly sat at 40.5.
Price, over the same week, slid from roughly $79,000 to $76,000, per the originating alert; that feed’s own futures gauge read 30.9 percent, a third-party number we cannot verify in our own series.
So the recovery is real and lopsided: hot on the four-hour, tepid on the weekly, unconfirmed by price. This reading also runs in shadow mode, which we weigh below.
What is different here
The ParadiseTeam treats a shadow-mode gauge as what it is: a model estimate, quoted as an estimate, never dressed as a calibrated probability or a historical hit rate. When our own index runs in shadow, we say so in the same sentence we quote it, and we size the read down accordingly.
Recovering posture is not a reason to chase
The obvious misread is simple: sentiment is recovering, so buyers are back. A four-hour dial in Greed while price drops about $3,000 is not confirmation. It is sentiment running ahead of price, which whipsaws most on the fastest timeframe.
The fast gauge leads, and it also lies first. The weekly, at 40.5, is the reading that has not moved, and the weekly is the one that costs you when it is wrong.
This is one input. It sits alongside funding, open interest and spot absorption, and on its own a recovering sentiment dial sizes a bias rather than setting one.
The fast gauge leads, the weekly decides
In a divergence like this, the fast reading moves first and the slow reading confirms or kills it. Right now the four-hour is three timeframes ahead of the weekly, and the weekly has barely twitched off 40.5.
History is not wired for this specific split in our lake yet, so we quote no hit rate. A frequency without a sample is decoration, not evidence.
What we can say precisely is where the two reconcile. Either the daily estimate climbs through its Neutral boundary toward 55 and price reclaims $79,000, or the four-hour cools back to the weekly and the recovery was noise.
The imbalance is between timeframes, not direction. That is a statement about where conviction currently sits, not about where price goes next.
Confirmation sits at the reclaim, not the recovery
Within a day of the alert the divergence is unresolved: the daily estimate improved but stalled under its Neutral-to-Greed boundary near 55, and price has not reclaimed the $79,000 to $80,000 area the move needs.
Because the index is in shadow mode, excluded from our main composite since July, we quote every value here as a model estimate, never a calibrated probability or a historical hit rate.
A gauge that admits it is still in shadow is more useful than one that pretends to a precision it has not earned.
Reading a sentiment divergence yourself, step by step
- Pull the sentiment gauge on three timeframes at once: the four-hour, the daily and the weekly reading.
- Note which timeframe is leading; a hot four-hour against a flat weekly means sentiment is running ahead of price.
- Lay the gauge over price and check whether price has confirmed the move or merely tolerated it.
- Check for a shadow or estimate flag on the series, and discount a flagged reading to a model estimate.
- Write the reclaim level that would confirm the recovery, and the cool-off that would kill it, before you act.
The step people skip is the flag check: a gauge in shadow mode is a model estimate, and trading it as a calibrated probability turns a soft number hard.
Every number above is checkable against the live data. Start with the Crypto Fear and Greed Index, then cross-read the MCP Insights hub and the live crypto funding rates.
Act and invalidate
| Scenario | What confirms it | What kills it |
|---|---|---|
| Recovery confirms | Daily clears 55, price reclaims $79K | Price rejects, dial fades |
| Sentiment ran ahead | 4h cools back toward weekly 40.5 | Weekly turns up with price |
| Range persists | Dial chops, price holds $76K | Daily close breaks either edge |
Posture: Patient and neutral until price confirms the gauge: a recovering sentiment estimate sizes a bias, it does not set one. No trade is a position while the daily sits under 55 and price under $79,000.
Frequently asked questions
What is a crypto sentiment index measuring?
It blends crowd inputs such as positioning, volatility and momentum into one posture reading between zero and one hundred. It describes how the market is leaning, not where price is headed, which is why it can diverge from price for days at a time.
Why is sentiment recovering while Bitcoin fell?
Fast and slow inputs move at different speeds. The four-hour reading reached 77 in Greed while the daily only recovered to 47 and the weekly held at 40.5, so short-term posture improved well before price or the slower gauges confirmed anything.
What does shadow mode mean for this reading?
Shadow mode means the series runs beside our main composite without feeding it, pending calibration. We quote its values as model estimates rather than calibrated probabilities, and we size any read taken from it down until it clears its gate.
What would confirm the recovery in Bitcoin?
Two things together: the daily estimate climbing through its Neutral boundary toward 55, and a daily price close back into the $79,000 to $80,000 area. One without the other leaves the divergence unresolved and the lean neutral.
Is a recovering sentiment reading a reason to buy?
On its own, no. It is one input beside funding, open interest and spot absorption, and a recovering dial sizes an existing bias rather than creating one. Unconfirmed by price, improving posture is the weaker configuration, not a green light.
Crypto trading involves substantial risk and is not suitable for everyone. Nothing here is financial advice; it is education only. Never risk more than you can afford to lose.
The private Extras feed, where the multi-timeframe sentiment dial, its shadow-mode flag and the reclaim level update with their invalidation, is part of PRO Paradiser, the intelligence layer behind the ParadiseFamilyVIP strategies.







Join the discussion
No comments yet. Members, share how you are reading this.