

In short
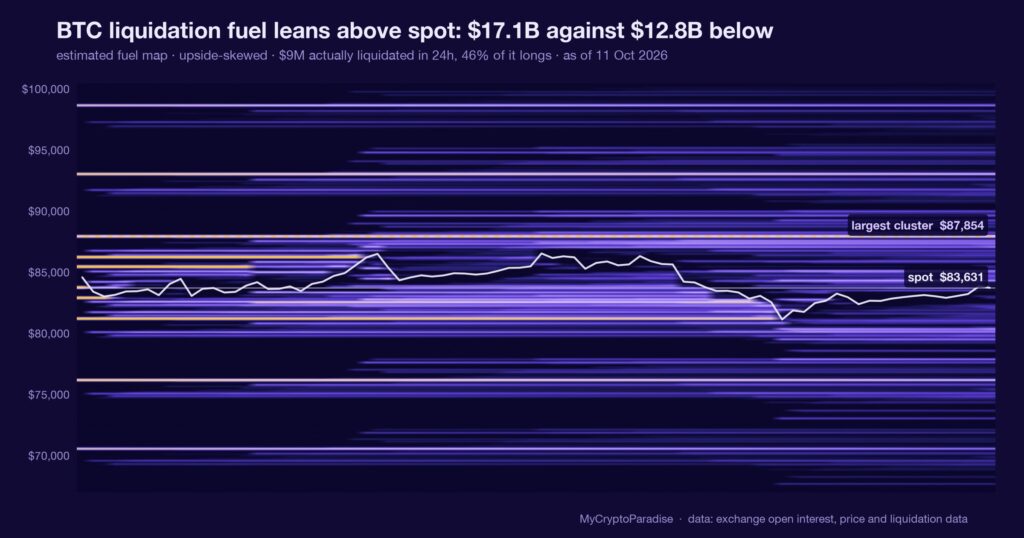
A liquidation heatmap estimates where leveraged positions get force-closed. That is not the same as where traders have chosen to rest bids and offers, and the difference decides whether a pocket brakes a move or feeds it. On 11 October 2026 our MCP Insights liquidation heatmap for BTC, spot near $83,631, read upside-skewed: about $17.1 billion of estimated fuel sits above spot against $12.8 billion below, a 1.3-to-1 lean at an imbalance of 14. We called this neutral, explicitly not a reason to lean long. A 1.3-to-1 skew on a model estimate that has not cleared its calibration gate is a faint tilt, not a conclusion. Two weeks ago the same map had fuel stacked 2.0-to-1 below spot; the weight has since migrated overhead, which is the only real change. This piece shows you how to read a liquidation heatmap yourself, and where it stops being useful.
Key facts
- BTC spot at the reading
- $83,631
- Estimated BTC liquidation fuel above spot
- $17.10B
- Estimated BTC liquidation fuel below spot
- $12.78B
- Fuel balance
- upside-skewed, +14 points toward the heavier side
- What would prove this read wrong
- The skew flipping back below spot, or a calibrated print showing a heavy liquidation pocket decisively above $84,000 that resting asks fail to cap, either of which would move the read off neutral.
- Reading taken
- 11 October 2026
- Source
- Our MCP Insights tools, from exchange data
Forced liquidity is not resting liquidity
A liquidation heatmap estimates the price levels where leveraged positions would be force-closed if price reached them. Those closes are involuntary: a margin engine selling a blown long, or buying back a blown short, because the account can no longer hold the position.
Resting liquidity is the opposite. It is the bids and offers someone placed on purpose, and it can absorb a move or step out of the way. Only one of these two brakes price, and the heatmap does not show you which.
So a cluster on the map is a magnet, not a floor. It marks where a move, once started, can accelerate as forced orders chain together. A gauge that tells you where fuel sits says nothing about who lights it.
The weight sits overhead on 11 October
On 11 October 2026, with BTC spot near $83,631, our MCP Insights liquidation heatmap read upside-skewed. About $17.1 billion of estimated fuel sits above spot against $12.8 billion below: a 1.3-to-1 lean, logged at an imbalance reading of 14.
The source event flags two high-leverage pockets straddling price, near $83,700 just overhead and $81,800 just below. Our own 24-hour tally shows $8.64 million in liquidations, split 54 percent shorts to 46 percent longs: the short side did slightly more of the bleeding.
The resting book tells a quieter story. Within two percent of spot our order-book walls show $517.7 million of bids against $467.0 million of asks, a 52.6 percent bid share, and the integrity check flags no spoofing or iceberg activity.
Every figure here carries an estimated flag: this is our recon reading, not a calibrated print. A number without an error bar is a direction to look, not a conclusion to trade.
What is different here
The ParadiseTeam reads a liquidation heatmap as a weight on an existing bias, never as the bias itself, and we separate estimated fuel from the resting bids and offers that actually absorb a move. A map this close to balanced, like today’s, earns one line of risk and no more.
A pocket is a magnet, and both sides are bait
The obvious misreading is that upside fuel means price gets pulled up. It does not. A pocket overhead is where short liquidations would chain if price arrives there, which is a statement about what happens after a move begins, not about what begins it.
Both pockets are real and both are bait. Large players have every incentive to probe resting stops, because a cluster of forced orders is cheap liquidity to trade against. The $83,700 pocket above and the $81,800 pocket below are each one spark from becoming the other side’s pain.
This is one input. It sits alongside funding, open interest and spot absorption, and on its own a 1.3-to-1 fuel skew is a probability weight on a bias, not the bias itself. A map that admits it is nearly balanced is more useful than one that always finds a direction.
The skew flipped from below to above
Two weeks ago this same heatmap had BTC fuel stacked 2.0-to-1 below spot at an imbalance of minus 33, with roughly $21 billion resting beneath price. The downside pocket was draining even then.
Today the weight has crossed over: 1.3-to-1 above, imbalance plus 14. That is a genuine migration of where the leverage sits, and it happened without a violent move, which usually means positions were added overhead rather than price falling into the lower pocket.
A reading that only ever points the same way is not measuring anything. This one changed sides in a fortnight, and saying so plainly is the only thing that makes the current tilt worth a line of risk.
Reading a liquidation heatmap yourself, step by step
- Start with spot and mark the nearest cluster on each side; note which is closer, because the nearer pocket resolves first.
- Read the imbalance number, not the colours: a figure near zero means the fuel is roughly balanced and the map has little edge.
- Check whether the reading carries an estimated or uncalibrated flag, and discount a model recon print against a calibrated one accordingly.
- Overlay the resting order-book walls: forced liquidity shows where a move accelerates, resting bids show where it might actually stall.
- Set the level that would flip the skew to the other side, and treat that as the line that invalidates the current tilt.
Most people skip step two and read the colours instead of the number. A loud red band at an imbalance near zero is decoration, not an edge.
Every number above is checkable against the live data. Start with the crypto liquidation heatmap, then cross-read the MCP Insights hub and the Crypto Fear and Greed Index.
Act and invalidate
| Scenario | What confirms it | What kills it |
|---|---|---|
| Price probes the $83,700 pocket | Chained short liquidations, open interest falls | Resting asks absorb, no follow-through |
| Price drops into $81,800 pocket | Forced long closes, imbalance flips below | Bids near $83,600 hold the retest |
| Skew stays near balanced | Imbalance holds single digits | A calibrated print shows a one-sided pocket |
Posture: Neutral and patient while the skew sits near balanced and the print stays a model estimate. The nearer pocket, overhead at $83,700, is the one to watch first; a calibrated map that prints a heavy one-sided cluster is what would justify leaning either way.
Frequently asked questions
What does a bitcoin liquidation heatmap actually show?
It estimates the price levels where leveraged positions would be force-closed, based on open leverage and liquidation prices. It maps forced, involuntary liquidity, not the bids and offers traders rest deliberately, which is why a heatmap cluster can accelerate a move rather than stop it.
Does upside-skewed fuel mean bitcoin will go up?
No. An upside skew means more estimated liquidation fuel sits above spot than below, so short closes would chain there if price arrives. It describes what happens after a move reaches the pocket, not what starts the move, and today’s lean is only 1.3-to-1.
Why treat the 11 October reading as an estimate?
Our liquidation heatmap carried an estimated flag on that date, meaning it is a model recon reading that has not cleared its calibration gate. We quote it as a direction to look rather than a calibrated probability, and we discount it against the resting order book.
What would change this near-balanced read?
A calibrated print showing a heavy, one-sided liquidation pocket, or the imbalance flipping decisively back below spot the way it sat two weeks ago. Either would move the reading off neutral. A single-digit imbalance on a model estimate stays a faint tilt.
How does a heatmap fit with other indicators?
It is one input among several, including funding, open interest and spot absorption. On its own a fuel map is a probability weight on a bias rather than the bias itself, which is why we read it alongside the other layers and never trade it alone.
Crypto trading involves substantial risk and is not suitable for everyone. Nothing here is financial advice; it is education only. Never risk more than you can afford to lose.
The private Extras feed, where the liquidation fuel map, order-book walls and 24-hour liquidation split update intraday with their invalidation levels, is part of PRO Paradiser, the intelligence layer behind the ParadiseFamilyVIP strategies.






Join the discussion
No comments yet. Members, share how you are reading this.