

In short
Cost basis is the average price at which a cohort of coins last moved; aggregate it across every bitcoin and you get the realized price, the market’s break-even line. On 15 October 2026, with spot at $82,255, that line sits at $53,835, so the average coin is 53 percent in profit. The long-term-holder cohort’s basis is lower still, near $49,241. Yet our model estimates those same long-term holders are taking a slight loss on the coins they actually move, and 31 percent of all supply sits underwater. We read this as a split, not a top: comfort at the aggregate, stress at the margins. We did not call a direction, because a 53 percent cushion and a third of coins underwater point opposite ways. This is one input among several, and today it is the one that disagrees with itself. This piece shows you how to read bitcoin cost basis across cohorts yourself.
Key facts
- Bitcoin price at the reading
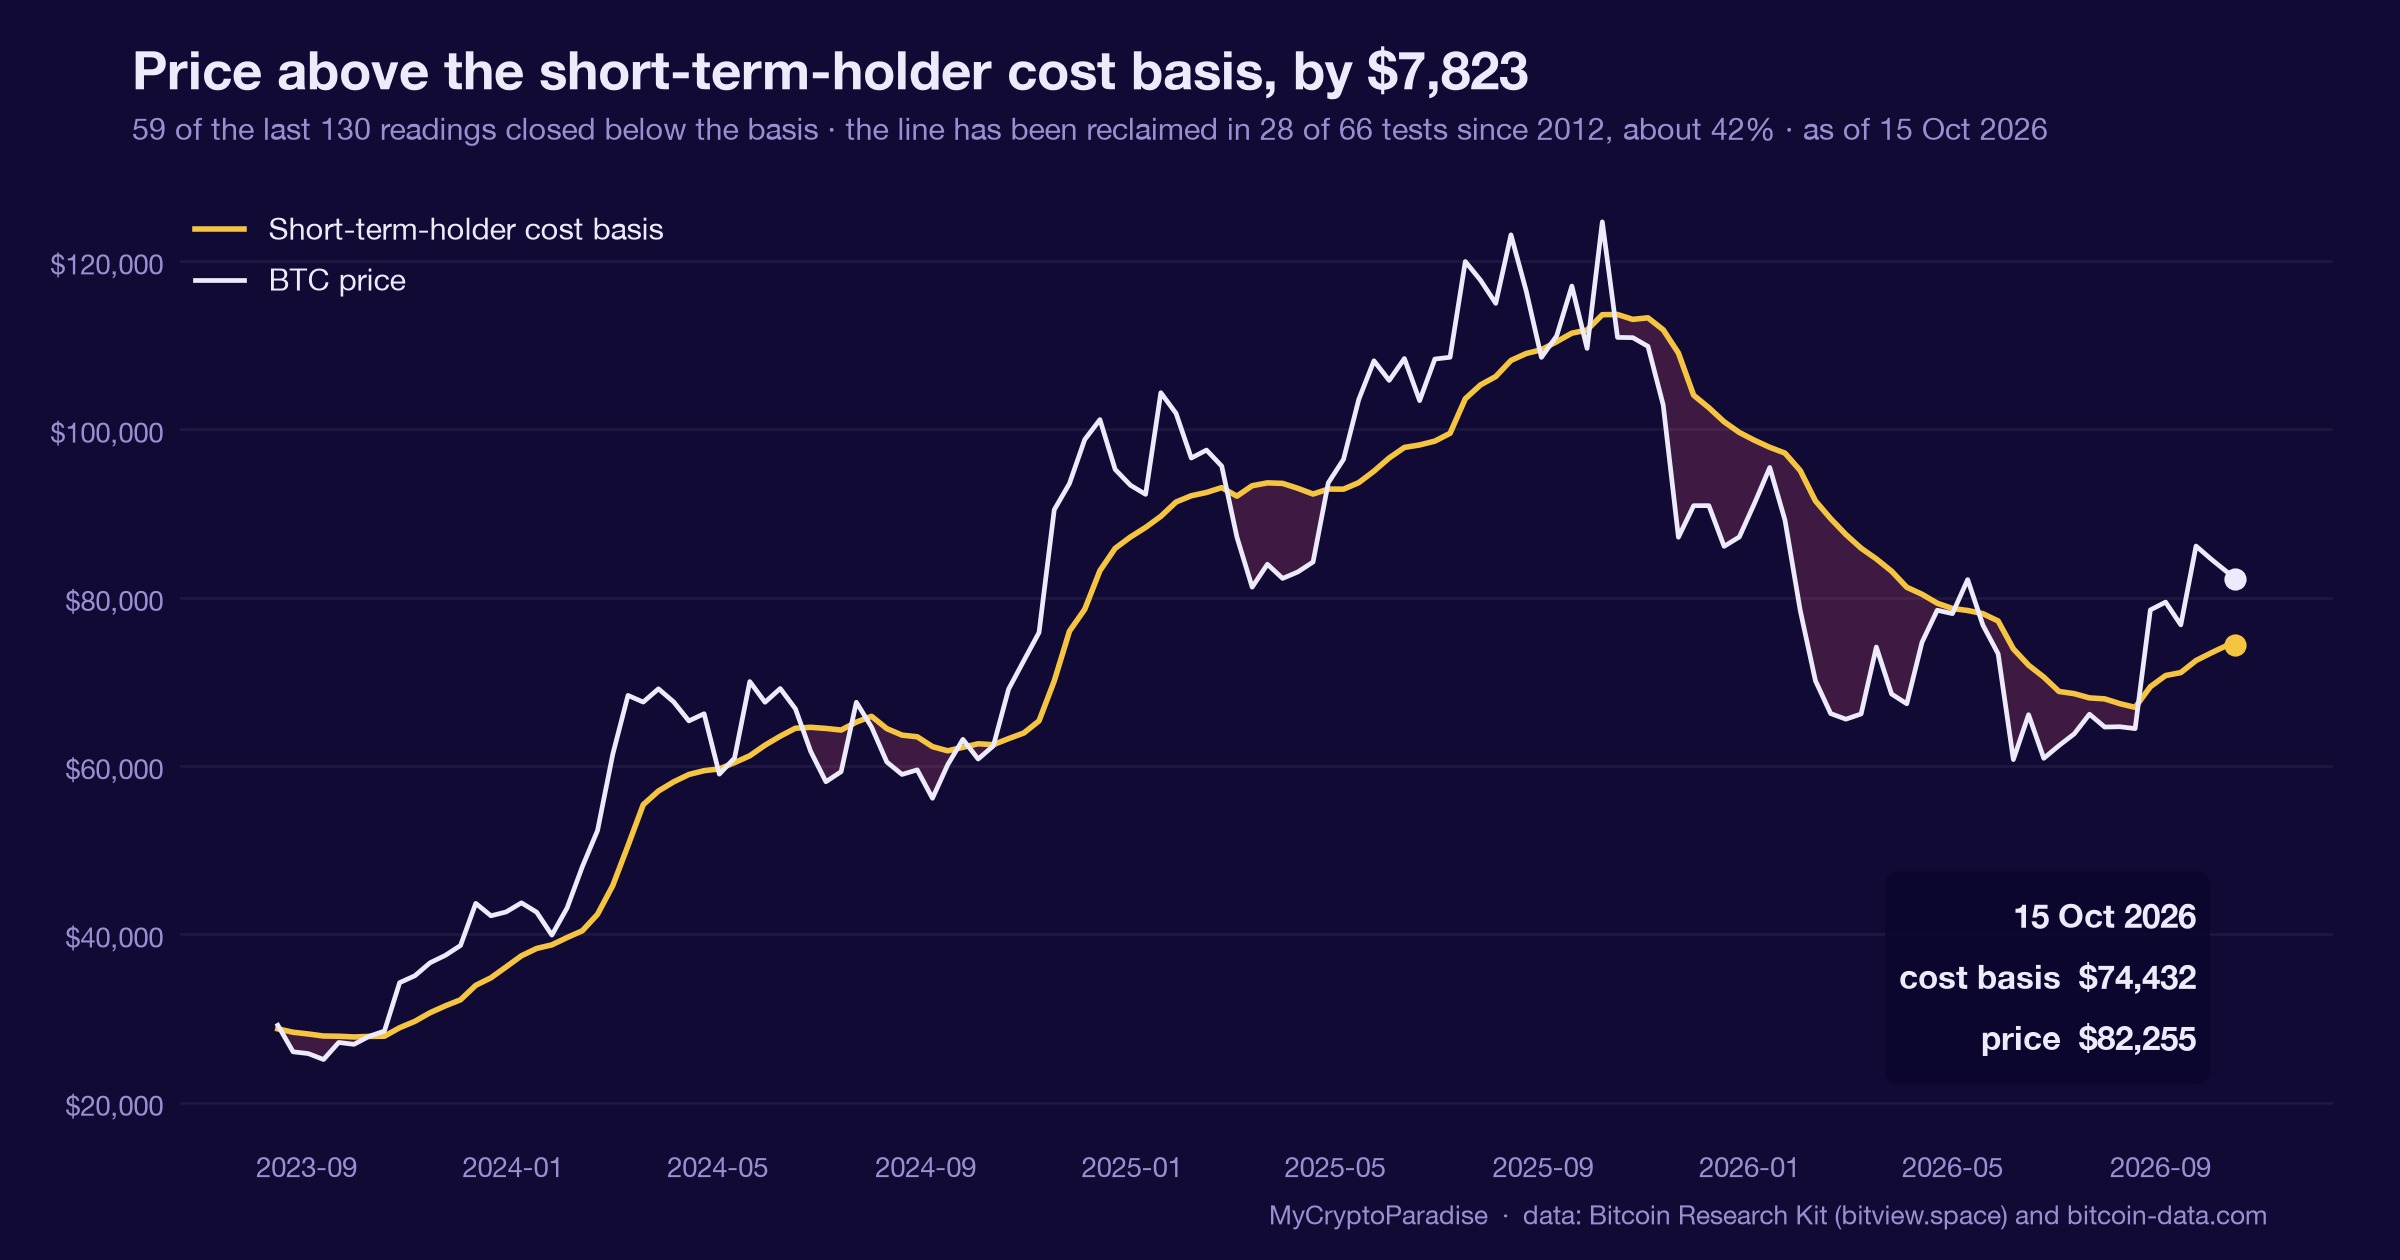
- $82,255
- Short-term holder cost basis
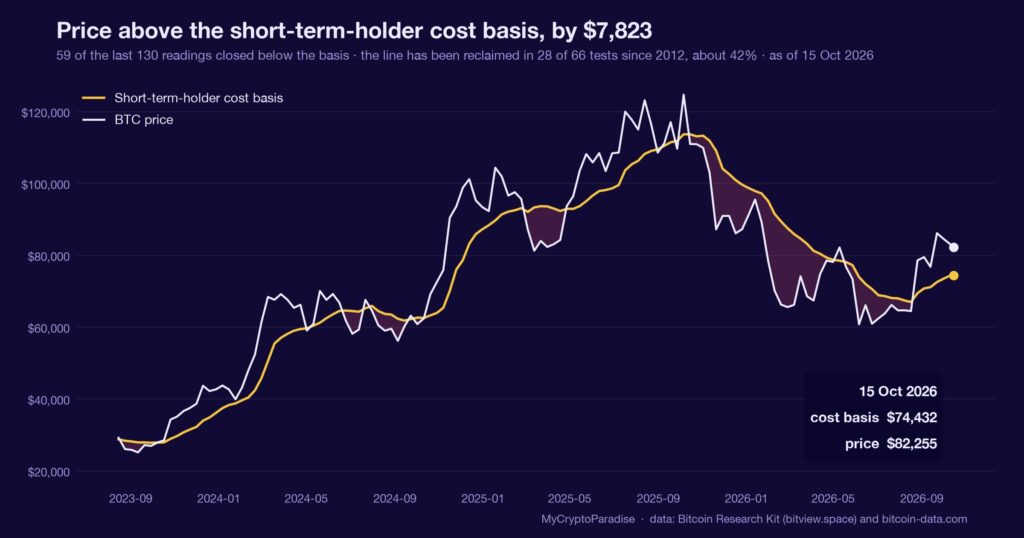
- $74,432
- Price against that cost basis
- $7,823 above
- Share of short-term holder supply underwater
- 28.7%
- State
- price above the short-term-holder cost basis
- What would prove this read wrong
- The split resolves bearish on a daily close below the short-term-holder cost basis of $74,432, which flips recent buyers from marginal to underwater and widens the 31 percent underwater share; it resolves constructive if the underwater share drains below 25 percent while spot holds its 53 percent premium.
- Reading taken
- 15 October 2026
- Source
- Our MCP Insights tools, from Bitcoin Research Kit (bitview.space) and bitcoin-data.com. Upstream data published by the Bitcoin Research Kit
A coin’s cost basis is its last on-chain move
Every bitcoin carries a memory of the price at which it last moved on-chain. Group all of them and average that price and you have the realized price, the aggregate cost basis of the entire supply. It is the line that separates coins held in profit from coins held at a loss.
Split the same supply by age and the picture sharpens. Short-term holders bought recently, so their average cost sits close to spot; long-term holders bought cycles ago, so theirs sits far below. The gap between the two is a map of who is comfortable and who is not.
A single aggregate number hides that map. Read the supply by cohort instead and you learn where the stress lives, not merely whether the average coin is up. The average is reassuring precisely because it averages the pain away.
On 15 October the cohorts split in two
Per our MCP Insights cost-basis series, spot traded at $82,255 on 15 October 2026 against a realized price of $53,835: the average coin is 53 percent above the price it last moved at. That is a genuine cushion, mid-cycle, and well short of the triple-digit premiums that have marked prior tops.
The cohorts tell different stories. Short-term holders, who bought recently, hold an average cost of $74,432, with spot sitting 7.81 average daily ranges above it and one range near $1,001; long-term holders sit far lower, around $49,241. Of 3,665,350 coins in short-term hands, 1,052,812 are underwater, a 28.7 percent loss share.
The profit picture adds a twist. Our spent-output-profit-ratio, which compares the price coins sell at with the price they were bought at, estimates long-term holders are realizing a 2.4 percent loss on the coins they actually move (0.9758), while the aggregate ratio holds near breakeven (0.9978).
Across the whole supply, 31 percent of coins sit below cost even now. A measured number is only as useful as the question it answers, and whether the average coin is up is the wrong one today.
What is different here
The ParadiseTeam does not stop at the aggregate realized price, the number most dashboards show. We split the supply into cohorts, measure what each actually paid, and check whether the coins being moved are in profit or loss. The average hides the split; the method is to refuse the average.
The 53 percent cushion is not the whole story
The tempting misread is to see 53 percent aggregate profit and call the market comfortable. That figure is true, and it is also the least informative number in the set. An average taken across coins bought at every price in bitcoin’s history will look healthy while a large minority of the supply quietly bleeds beneath it.
Read it the other way and the stress becomes specific. The underwater coins are not spread evenly; they concentrate in the cohorts that bought nearest the recent highs, which is exactly where forced selling begins once price slips. The 31 percent underwater share sizes that risk, where the 53 percent premium only buries it.
Neither figure is wrong. The cushion is real and the stress is real, and the honest reading is that they describe different coins. A gauge that quotes only its confirming half is decoration; the half that disagrees is the half that sizes your risk.
What the cohort split has done before
We will not dress this up as a historical frequency. Our cost-basis model logs sixty-six tests of this setup since February 2012 and estimates the level holds roughly 42 percent of the time, but that estimate has not cleared its calibration gate.
So read it as a lean, not a probability. The model’s recent recon is thin and mixed: of the last five logged tests against the short-term-holder line, more were rejected than defended, and the two that held did so within two days. Five prints are an anecdote with a spreadsheet, not a sample.
This is one input. It sits beside funding, open interest and spot absorption, and today it is the reading arguing with itself rather than with them. A metric that disagrees internally is telling you to size down, not to pick a side.
Reading bitcoin’s cost basis by cohort yourself, step by step
- Start with the realized price, the average cost basis of all supply, and compare it to spot to get the aggregate profit or loss.
- Split the supply by age into short-term and long-term holders, and read each cohort’s own average cost basis separately.
- Measure the distance from spot to the short-term-holder cost basis in average daily ranges, not dollars, so the gap scales with volatility.
- Check the underwater share, the percentage of supply sitting below its cost basis, which tells you how much of the market is in loss.
- Compare the unrealized picture with the spent-output-profit-ratio, which shows whether the coins actually being moved are changing hands in profit or loss.
Most people stop at step one and read the aggregate; the step they skip is four: a healthy average over a third of supply underwater is not health, it is arithmetic.
Every number above is checkable against the live data. Start with the MCP Insights hub, then cross-read the Crypto Fear and Greed Index and the live crypto funding rates.
Act and invalidate
| Scenario | What confirms it | What kills it |
|---|---|---|
| Cushion holds, stress drains | Underwater share falls below 25 percent | Daily close below the recent-buyer cost basis |
| Marginal cohorts forced out | Underwater share climbs past 35 percent | Realized price itself turns lower |
| Internal split, size down | Cohorts keep telling opposite stories | Both cohorts realign in profit |
Posture: Defensive and patient while the cohorts disagree. The internal split argues for smaller size and a wider invalidation, not a directional bet, until the underwater share and the aggregate premium start telling the same story.
Frequently asked questions
What is bitcoin’s realized price?
The realized price is the average price at which every bitcoin last moved on-chain, so it works as the aggregate cost basis of the whole supply. On 15 October 2026 it sat at $53,835, with spot 53 percent above it.
Why split holders into cohorts?
A single average blends coins bought years ago with coins bought last week, hiding where losses concentrate. Splitting by age shows that long-term holders carry a far lower cost basis than recent buyers, so stress and comfort live in different cohorts.
Does a 53 percent profit mean a top?
Not by itself. Prior cycle tops carried triple-digit aggregate premiums, so 53 percent reads as mid-cycle rather than euphoric. The more telling detail is that 31 percent of all supply still sits underwater even at that premium, a tension, not a verdict.
What does a sub-one profit ratio mean?
The spent-output-profit-ratio compares the price coins sell at with the price they were bought at. A reading below one means the coins actually being moved are changing hands at a loss; our model puts the long-term-holder reading at 0.9758 on 15 October.
How should a trader use this reading?
As one input, not a trigger. The cohort split argues for smaller position size and a defined invalidation rather than a directional bet; a daily close below the recent-buyer cost basis near $74,432 would flip the read and widen the underwater share.
Crypto trading involves substantial risk and is not suitable for everyone. Nothing here is financial advice; it is education only. Never risk more than you can afford to lose.
The private Extras feed, where the realized-price premium, the cohort cost-basis split and the underwater share update intraday with their invalidation levels, is part of PRO Paradiser, the intelligence layer behind the ParadiseFamilyVIP strategies.













Join the discussion
No comments yet. Members, share how you are reading this.