

In short
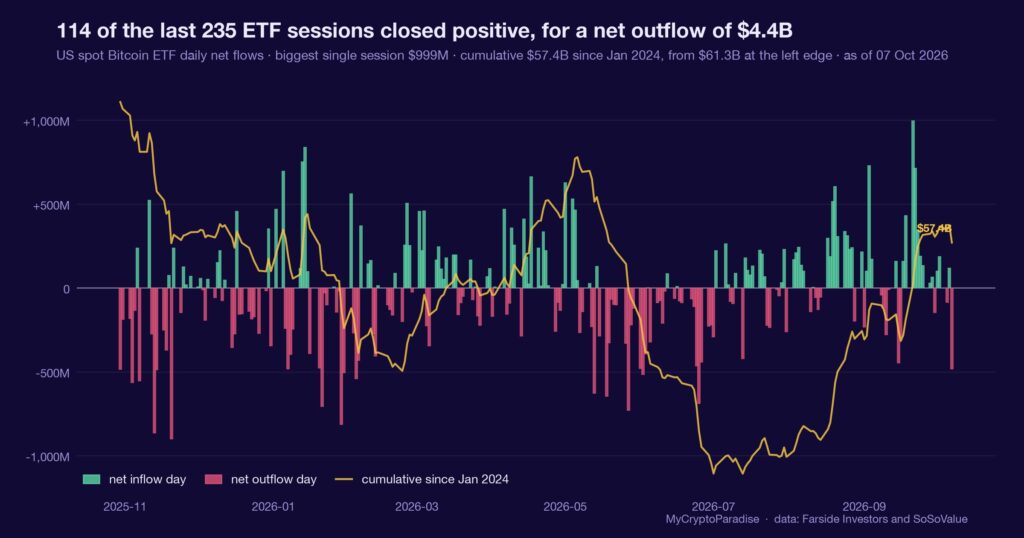
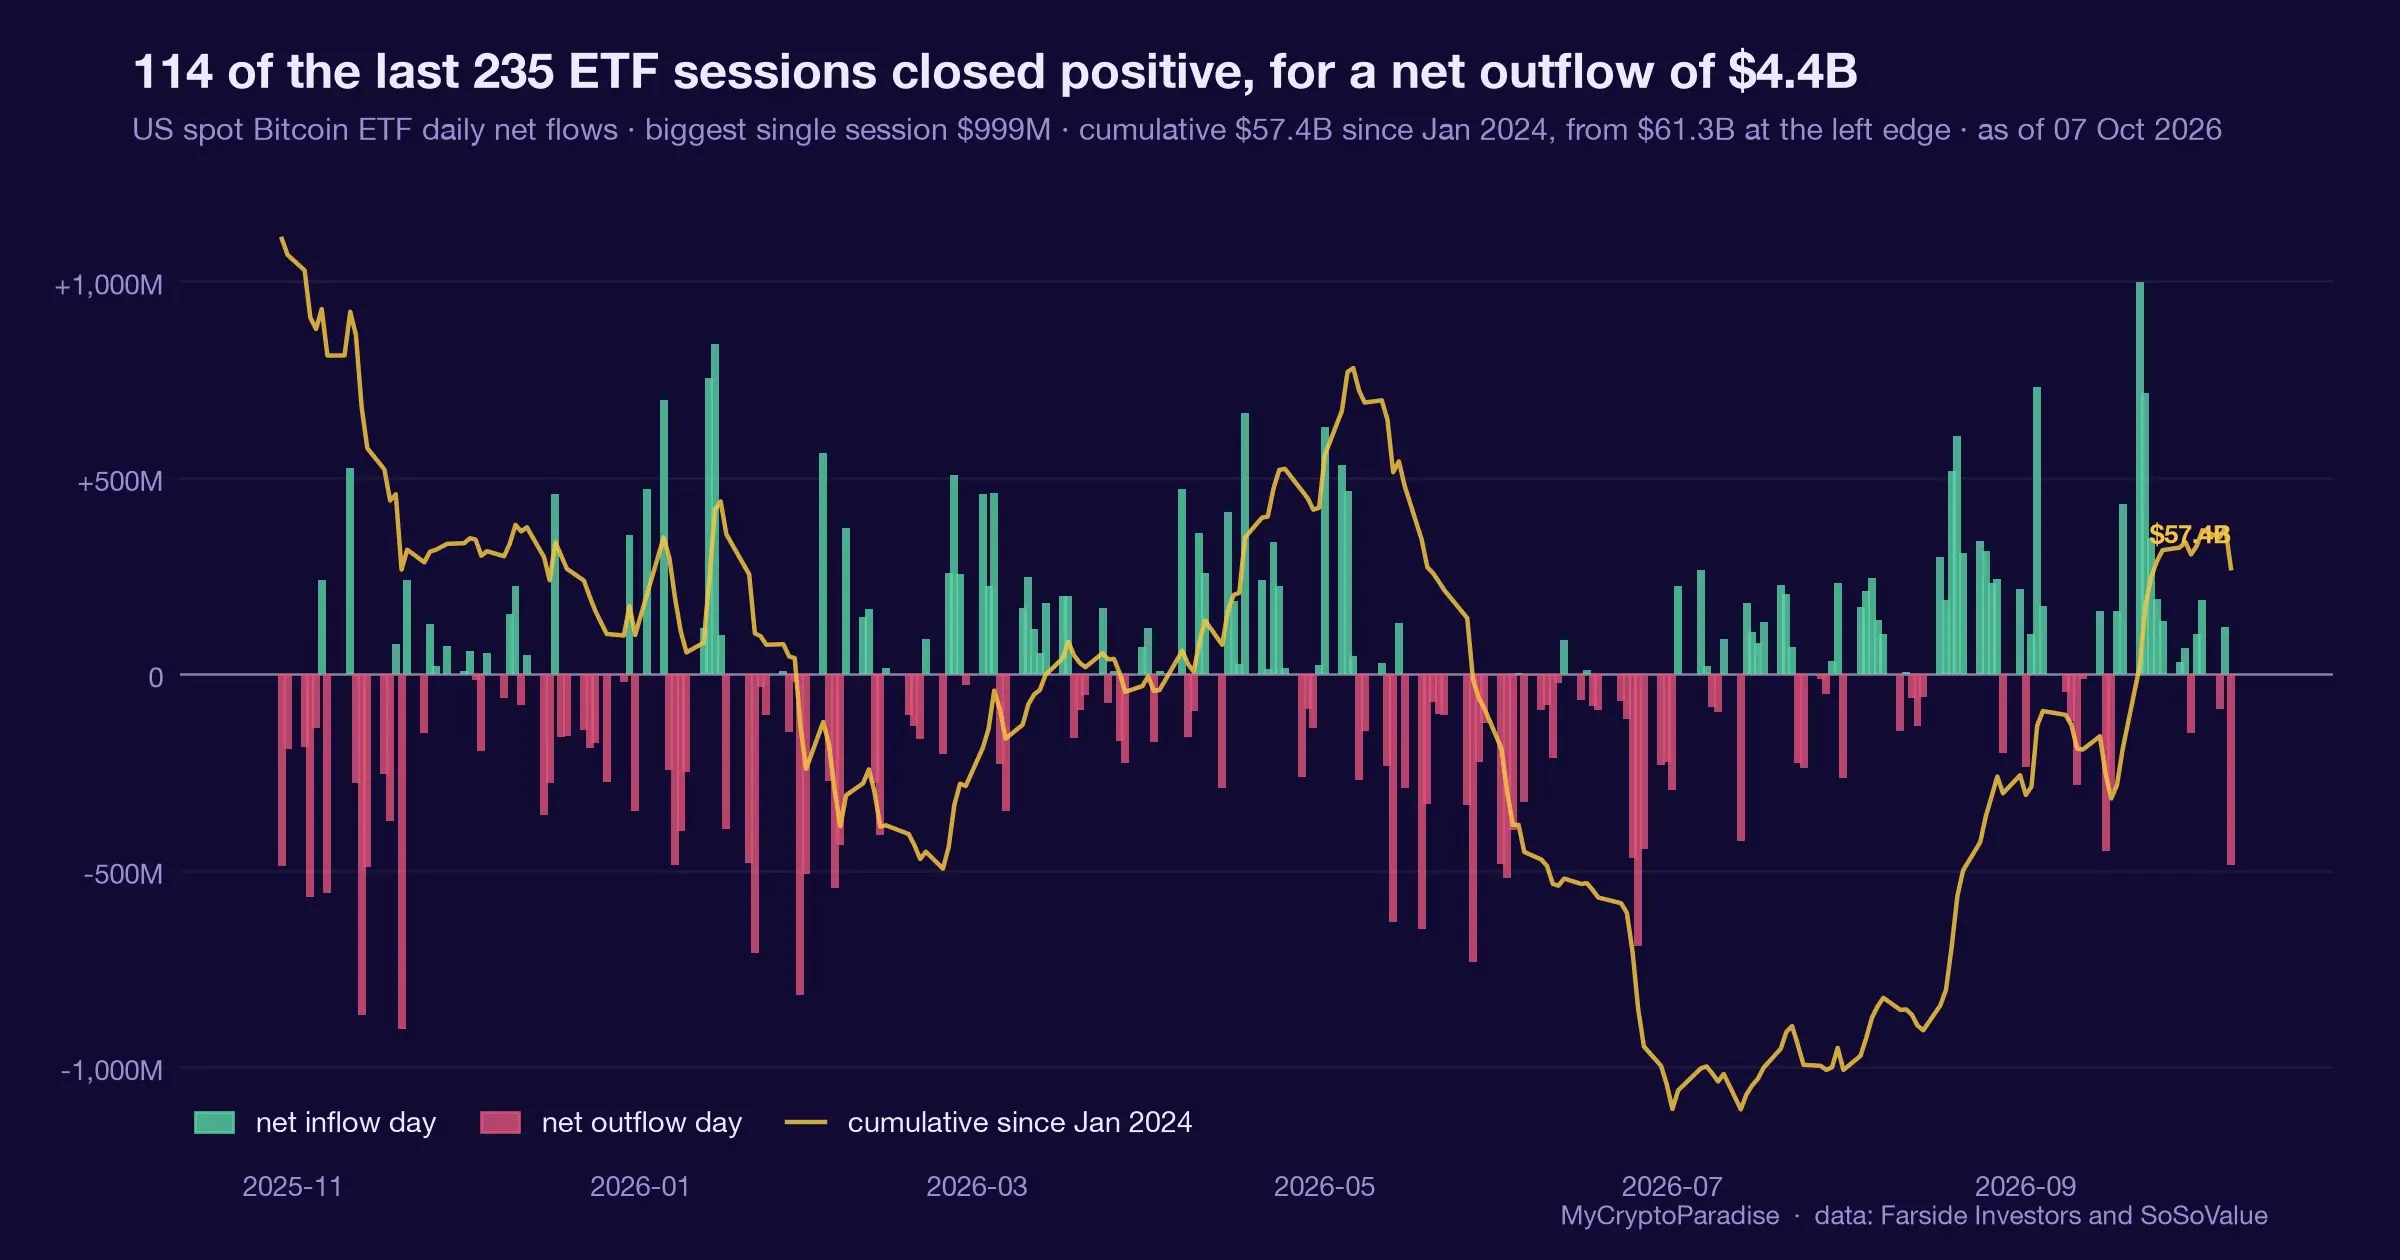
Cost basis is the average price a group of buyers paid, and the break-even line it draws is where unrealised profit turns to loss. On 8 October 2026, with Bitcoin near $83,200, two cohorts sit on almost the same floor: US spot ETFs at an average $76,909 and public companies at $78,834, 2.57 million coins between them, close to 13 percent of supply. We read the zone as constructive support while it holds, and we did not call it a bottom. Our MCP Insights ETF flow data backs a positive 30-day net of 1,712 coins, though the latest session printed an outflow. Base rates are not wired, so we claim no frequency; the one prior test, June 2026, saw holdings fall about 12 percent while price fell 53 percent. This piece shows you how to read a cost-basis floor yourself.
Key facts
- Latest session net flow
- -$487.1M
- Net flow over the last five sessions
- -$165.6M
- Cumulative net flow since January 2024
- $57.39B
- What would prove this read wrong
- A daily close below the $77,000 to $79,000 cost-basis band, starting with the spot-ETF average near $76,909, which puts 2.57 million coins back underwater and raises the odds of supply-side selling.
- Reading taken
- 07 October 2026
- Source
- Our MCP Insights tools, from Farside Investors and SoSoValue. Upstream data published by Farside Investors
A break-even line is a behavioural threshold
Cost basis is the average price a cohort of buyers paid for what it holds. It is not a support level in the chart sense, and it does not stop price. What it marks is a behavioural threshold: the point at which a holder’s paper gain flips to a paper loss.
Above that line, the typical holder is sitting on profit and has no forced reason to sell. Below it, the same holder is underwater, and the temptation to cut losses grows with the size of the drawdown. The line itself does nothing; the people standing on it do.
This is why a shared cost basis matters more than any single buyer’s. When two large cohorts paid almost the same price, their break-even lines stack, and a move through that band flips a great deal of conviction at once. A threshold that many people watch becomes a threshold that many people act on.
The two biggest buyers broke even together
On 8 October 2026, Bitcoin traded near $83,200. Per on-chain cost-basis data, US spot ETFs hold about 1.29 million coins at an average cost of $76,909, and public companies hold about 1.28 million at $78,834. Together that is 2.57 million coins, close to 13 percent of the supply.
At today’s price both cohorts sit in profit: the ETF holding carries roughly $8.1 billion unrealised and the corporate holding about $5.6 billion, with per-name averages running from Strategy near $75,441 up to iShares IBIT at $81,277.
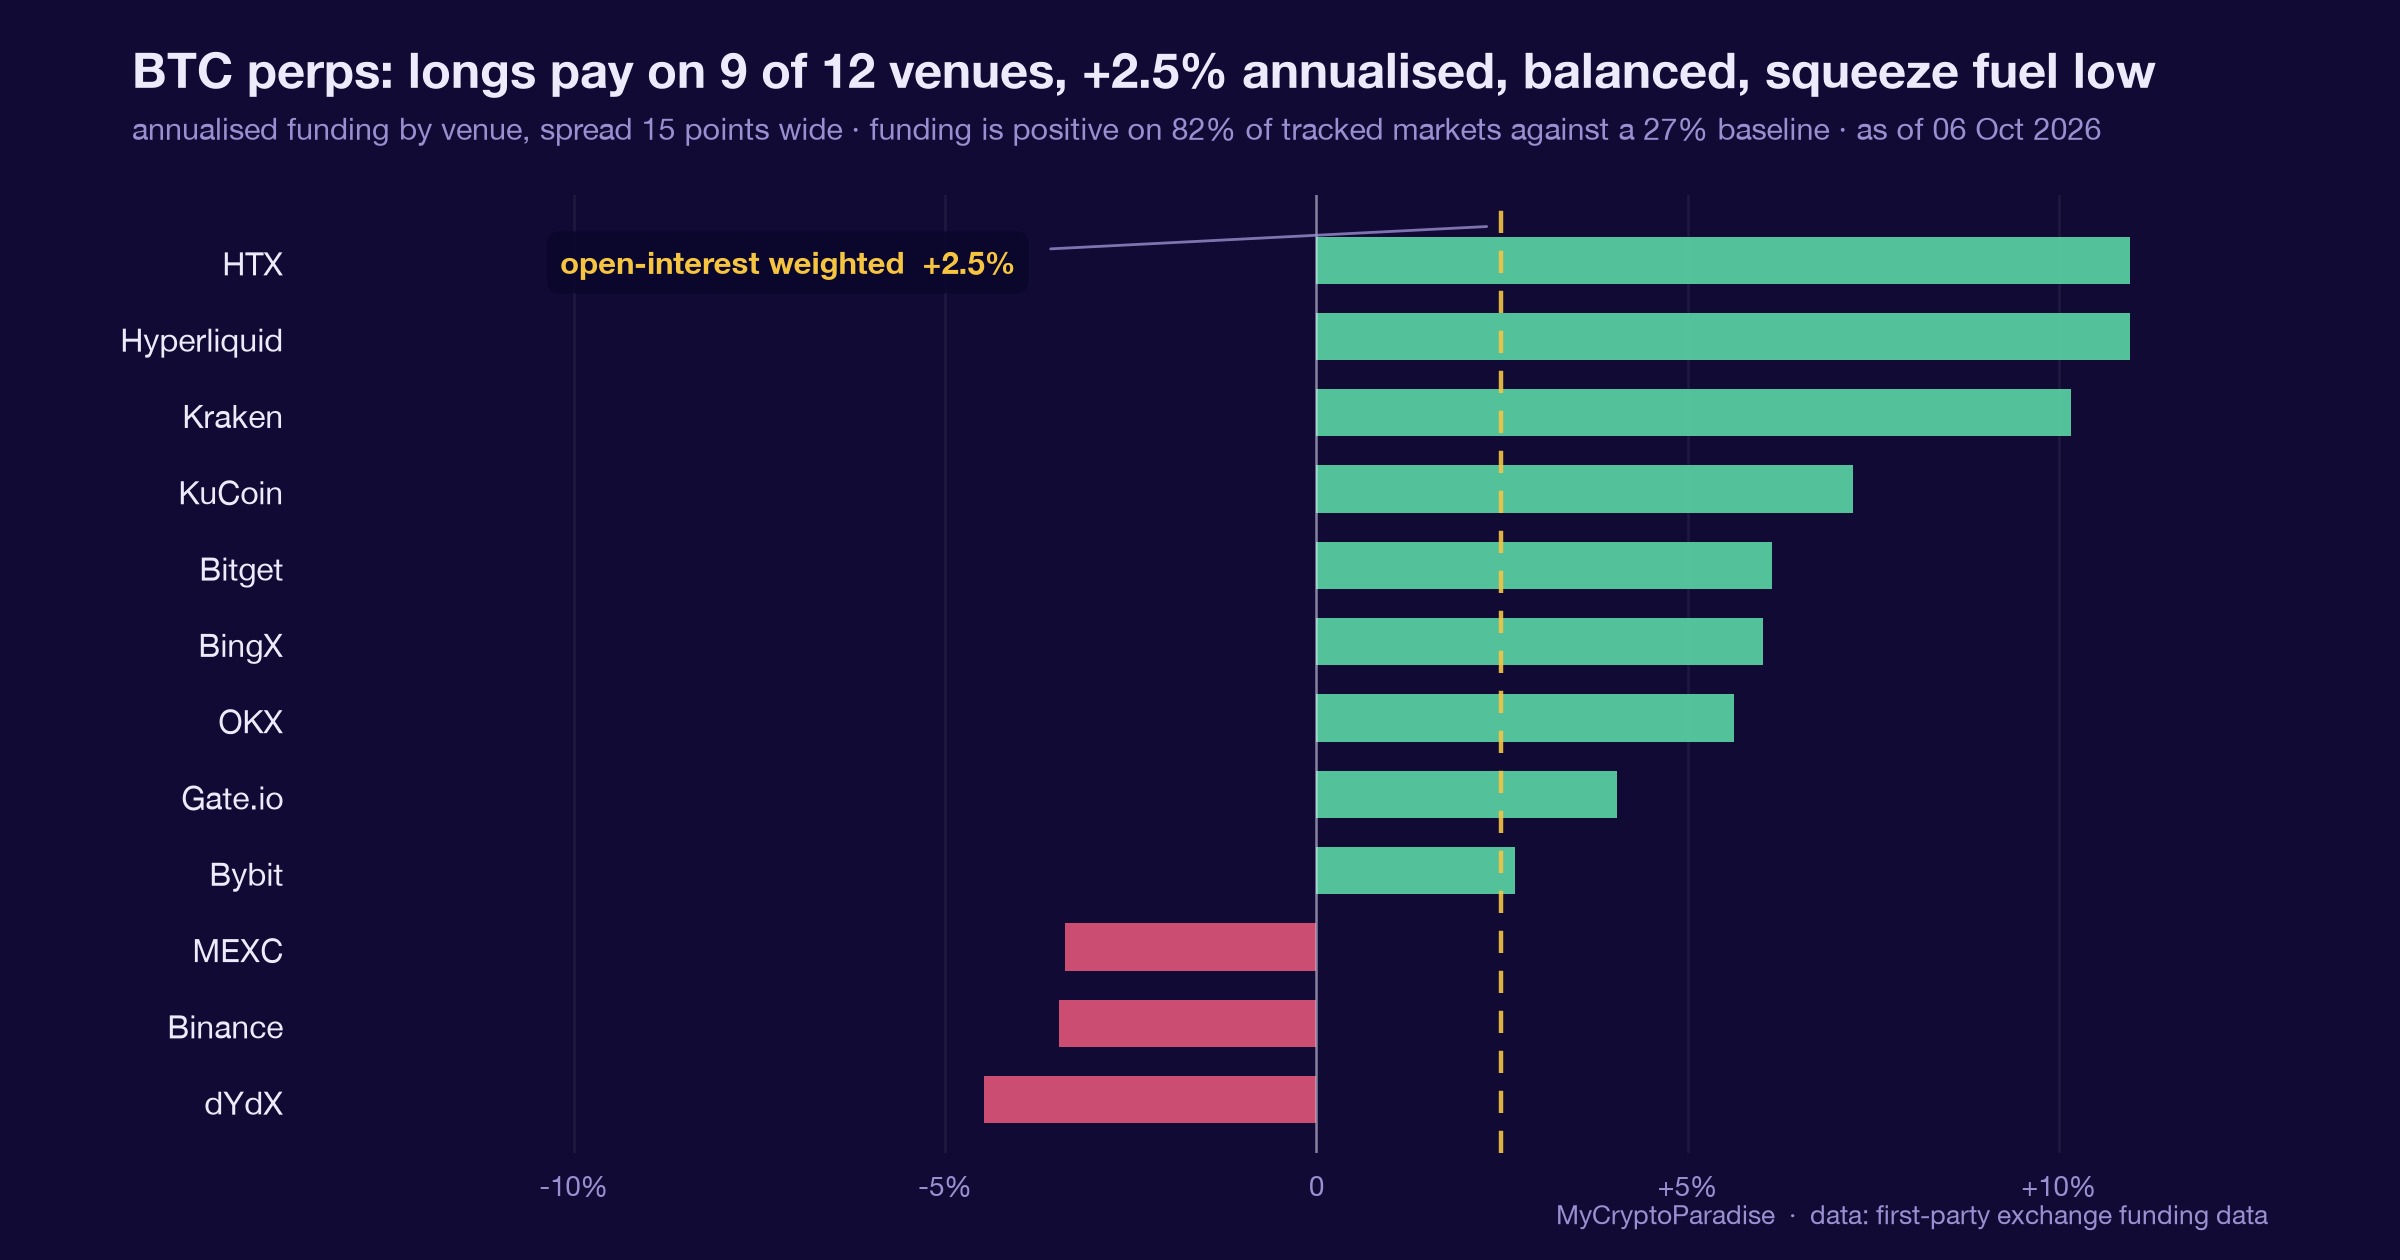
Our MCP Insights ETF flow data, reconciled through 7 October, shows a 30-day net of 1,712 coins still positive even after a 487-coin outflow on the last print. Funding sits near 6 percent annualised with longs paying, and our tide gauge reads balanced rather than stretched.
A cohort this large and this far in profit has no forced reason to sell. That is the whole of the cushion, and it is only a cushion while price stays above the band.
What is different here
The ParadiseTeam does not read a cost basis as a floor that must hold. We read it as a map of where forced selling is cheap and where it turns expensive, then we mark the one level that would flip the cohort underwater and let that level, not the price, size the risk.
Shared cost basis is a cushion, not a bottom
The obvious misreading is that a shared break-even near the price guarantees a bottom. It does not. Cost basis tells you where selling pressure is likely to be low, not where buyers will step in with size. Those are different claims, and only the first is in the data.
The honest version is narrower. While Bitcoin holds above the $77,000 to $79,000 band, the two largest cohorts are in profit and have little reason to force coins onto the market. That lowers the odds of a supply-driven cascade; it says nothing about demand, macro, or the next catalyst.
This is one input. It sits beside funding, open interest and the flow tide, and today those agree it is a quiet tape, not a stretched one. A cushion that lowers the chance of forced selling is useful precisely because it does not pretend to call the turn.
The one time this zone was tested, it held
Base rates are not wired for cost-basis regimes, so we claim no historical frequency here. What we do have is one prior test, and it is worth more than a made-up percentage. In June 2026, Bitcoin fell to $58,500, and the average ETF holder was about 24 percent underwater.
The feed’s reading of that episode is the interesting part. ETF holdings fell only around 12 percent while price fell 53 percent. The paper hands left; the cohort, in aggregate, did not capitulate. That is one data point, not a law, and we will not dress it as more.
A single prior instance is an anecdote with a timestamp. It earns a mention because it points the same way as the mechanism, not because it proves anything. One test is how you form a hypothesis, not how you confirm one.
The flow side has cooled, and that is the risk
The cushion is about holdings; the flow is about momentum, and the two are not saying the same thing this week. Our MCP Insights ETF flow data shows the last session at a 487-coin outflow and a one-day outflow streak, even as the 30-day net stays positive at 1,712 coins.
That is the honest tension. A profitable cohort that stops adding is still a cushion, but a cohort that starts distributing is a different animal. The tide gauge reading balanced, not stretched, and funding near 6 percent with longs paying, says the market is neither crowded nor panicked right now.
Flows are the thing to watch, not the cost basis. The break-even tells you where the floor is cheap to defend; the flow tells you whether anyone is still defending it.
Reading a cost-basis floor yourself, step by step
- Find the cohort’s average cost: the price its holdings would break even at, aggregated across every coin it owns.
- Compare that average to spot, and note the percentage gap; that gap is the cohort’s unrealised profit or loss.
- Check how wide the cohort is: a tight band of buyers flips together, while a wide spread flips in stages.
- Overlay flows and funding to see whether the cohort is still adding or quietly distributing into strength.
- Mark the price that puts the cohort underwater, and treat a daily close below it as the line that changes the read.
Most people skip step three. A single blended average looks like one wall, but a cohort spread across many prices breaks in pieces, and the pieces matter more.
Every number above is checkable against the live data. Start with the Bitcoin ETF flow tracker, then cross-read the Crypto Fear and Greed Index and the MCP Insights hub.
Act and invalidate
| Scenario | What confirms it | What kills it |
|---|---|---|
| Price holds above the cost-basis band | Flows stay net positive, funding calm | Daily close below $77,000 |
| Cohort keeps absorbing on dips | 30-day net flow stays positive | A run of verified outflow days |
| Band flips to overhead resistance | Daily close below $76,900 | Reclaim and hold above $79,000 |
Posture: Posture is constructive while price holds above the band, and defensive on a daily close beneath it. This is a cushion to lean on, not a level to chase, and it is worth one line of risk, no more.
Frequently asked questions
What is a Bitcoin cost basis?
It is the average price a defined group of buyers paid for the coins it still holds. For US spot ETFs that figure is about $76,909 today. Above it the group is in profit; below it, underwater.
Why do two cohorts share one break-even?
They bought over the same stretch of the market, so their blended averages landed close together. US spot ETFs average $76,909 and public companies $78,834, a gap under $2,000 across 2.57 million coins. Their break-even lines effectively stack.
Does a cost basis predict the price?
No. A cost basis maps where forced selling is likely to be cheap or expensive, which is a statement about supply, not demand. It can lower the odds of a cascade while saying nothing about where buyers will appear.
What happened the last time this zone was tested?
In June 2026 Bitcoin fell to around $58,500 and the average ETF holder was roughly 24 percent underwater. Reported ETF holdings fell only about 12 percent while price dropped 53 percent, so the cohort largely sat still. One instance, not a rule.
What would invalidate the constructive read?
A daily close below the $77,000 to $79,000 band, starting with the spot-ETF average near $76,909. That puts 2.57 million coins back underwater and raises the odds of supply-side selling. Flows turning persistently negative would add to that case.
Crypto trading involves substantial risk and is not suitable for everyone. Nothing here is financial advice; it is education only. Never risk more than you can afford to lose.
The private Extras feed, where the ETF cost-basis floor, the flow tide and funding read update with their invalidation levels attached, is part of PRO Paradiser, the intelligence layer behind the ParadiseFamilyVIP strategies.












Join the discussion
No comments yet. Members, share how you are reading this.