

In short
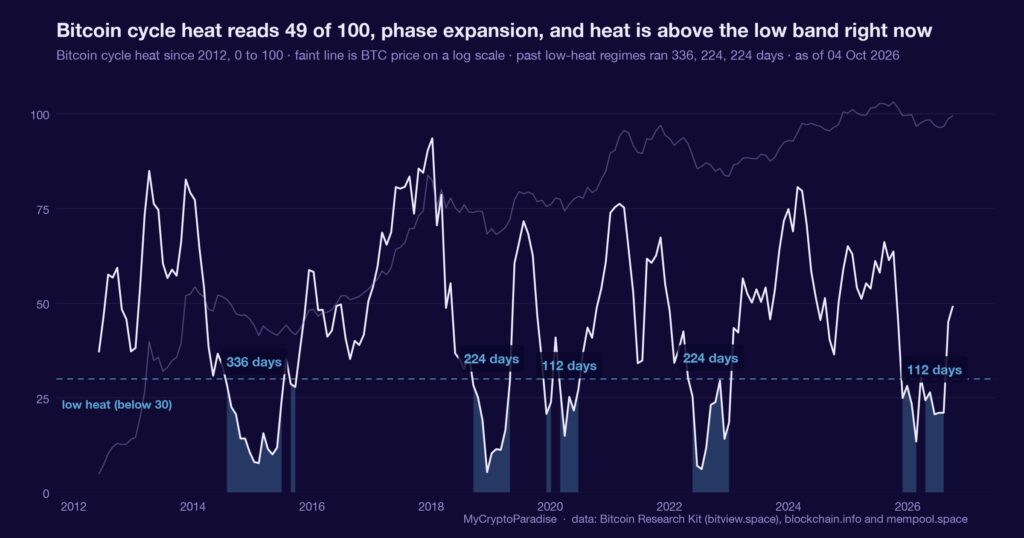
Cycle metrics gauge how far Bitcoin sits from a historical top: valuation multiples, miner economics and hashrate trend, read together rather than one at a time. On 4 October 2026 our MCP Insights cycle read sits mid-expansion, with a cycle-heat score of 49 out of 100, a Mayer Multiple of 1.19 against its 2.4 stretch line, and market-value-to-realised-value (MVRV, price versus aggregate cost basis) at 1.59. Every prior cycle in our data peaked with MVRV between 2.79 and 6.03, so the valuation headroom is real. We call this neutral: mid-cycle, not a top, and explicitly not a green light to chase. The source event flags spot volume recovering only timidly since July, which is the missing half. Base rates are not wired, so we quote no historical frequency, and these cycle readings are model estimates, not calibrated probabilities. This piece shows you how to read the cycle yourself.
What a cycle gauge is actually built from
A cycle metric does not predict a date, and it does not try to. It measures how stretched Bitcoin is against its own history, by stacking several independent lenses that each look at a different part of the system.
One lens compares price to its long-run moving averages. Another compares miner revenue to its yearly norm, because miners are the forced sellers of the network. A third watches the trend in hashrate, which tends to roll over when the oldest machines are switched off.
No single lens is trusted on its own, because each has failed alone in at least one past cycle. Read together, they describe a position on the map rather than a turn in the road.
A gauge that places you on the map is more honest than one that promises the next turn. The map is knowable. The exact turn is not.
The gauge reads mid-expansion, with room above
Per our MCP Insights cycle data on 4 October 2026, the composite cycle-heat score is 49 out of 100, which is squarely mid-expansion. The Mayer Multiple, price divided by its 200-day average, sits at 1.19 against the 2.4 line that has marked past stretch zones.
Valuation agrees. Market-value-to-realised-value (MVRV), price against aggregate cost basis, reads 1.59, and net unrealised profit/loss (NUPL), the share of supply held in profit, reads 0.37. Both sit in the neutral band, near the 45th percentile of their own history.
Two more lenses round it out. Pi Cycle proximity is 0.45 of the way to its trigger, and Hash Ribbons sits at 1.02, above the 1.0 line, so there is no miner-capitulation inversion. Price near $85,400 holds just above our estimated production-cost reading of about $83,000.
Every number here is a model estimate that has not cleared its calibration gate. An estimate placed on a map is still useful. An estimate sold as a probability is not.
What is different here
The ParadiseTeam does not read one cycle metric and call a top. We stack five lenses, weight them by how each behaved in prior cycles, and publish the composite as a position estimate with its own uncertainty, rather than a countdown to a date we cannot know.
Headroom is permission, not fuel
The obvious misread is to see valuation room above and treat it as a reason price must rise. Headroom is permission for an advance, not the fuel that drives one. The 2-year moving-average multiplier at 0.96 says price is barely above its two-year mean: supported, but not launched.
This is where the source event matters. The feed that flagged this reports spot volume recovering only timidly since the July low, with September turnover on the largest venue near $50 billion against roughly $42 billion in July. That is a recovery, not the surge that funds a fresh cycle leg.
Valuation says there is room. Volume says the demand to use it has not fully arrived. A map position without demand is a possibility, not a trade.
One lens among several, and the one disagreeing
Cycle valuation is one input. It sits alongside spot demand, derivatives positioning and ETF flows, the other layers we track in PRO Paradiser, and today the cycle lens is the constructive one while spot volume is the lens that disagrees. A read built on a single lens overstates what one lens can know.
Because base rates are not wired for this setup, we quote no historical frequency for how mid-cycle readings resolve. What we can say is bounded and honest: valuation sits near the 45th percentile, every prior peak in our record ran well above the current 1.59 MVRV, and the composite has neither overheated nor rolled over.
A single lens is a lean, never a conclusion. The reading that disagrees with the others is usually the one worth watching, not the one worth dismissing.
Reading the Bitcoin cycle yourself, step by step
- Start with the Mayer Multiple: divide price by its 200-day average, and compare the result to past cycle stretch zones rather than a fixed number.
- Add valuation: check MVRV and NUPL against their own percentile history, not against round levels, so you read position rather than a headline figure.
- Check miner health through Hash Ribbons: a 30-day hashrate below the 60-day flags capitulation, and its absence removes one bearish lens.
- Read the composite cycle-heat score as a map position, treating mid-range as neither a top nor a floor, only a location.
- Confirm with demand: without rising spot volume, a constructive valuation is permission waiting on fuel, so weight volume alongside the gauges.
The step most people skip is the last one: they read valuation, see room, and stop before checking whether demand is actually showing up to use it.
Every number above is checkable against the live data. Start with the MCP Insights hub, then cross-read the Crypto Fear and Greed Index and the live crypto funding rates.
Act and invalidate
| Scenario | What confirms it | What kills it |
|---|---|---|
| Demand confirms the advance | Spot volume rises with price | Price rises on flat volume |
| Mid-cycle range holds | Cycle-heat stays near 49 | Mayer clears 2.4 or loses 2-year mean |
| Early distribution begins | MVRV climbs toward prior peaks | MVRV holds in the neutral band |
Posture: Patience over position. With valuation supportive but demand unconfirmed, the higher-probability stance for most is a watch, sizing nothing on a lean until spot volume or a Mayer break resolves it.
Frequently asked questions
What does mid-expansion mean for Bitcoin’s cycle?
It means our composite gauge sits near the middle of its range, at 49 of 100 on 4 October 2026. Price is elevated above its long averages but far from the stretch zones that marked prior tops. It is a position, not a timing call.
Is a low MVRV a reason to buy?
No single metric is a reason to act. MVRV at 1.59 shows valuation sits below every prior cycle peak in our record, which is headroom, not a trigger. Headroom is permission for an advance, and demand is what would actually drive one.
Why does spot volume matter for the cycle?
Valuation tells you where price sits relative to history; volume tells you whether real demand backs the move. The source feed shows spot turnover recovering only timidly since July. A cycle with room above but thin demand can drift sideways for a long time.
Are these cycle readings predictions?
No. They are model estimates that have not passed their calibration gate, so we quote them as position readings, not probabilities. Base rates for this setup are not wired, which means we refuse to attach any historical frequency to how it resolves.
What would change this neutral read?
Two things, in opposite directions. A clear surge in spot volume alongside rising price would upgrade the demand side toward constructive. A Mayer Multiple pushing through 2.4, or MVRV climbing toward past-cycle peaks, would move the read toward late-cycle caution instead.
Crypto trading involves substantial risk and is not suitable for everyone. Nothing here is financial advice; it is education only. Never risk more than you can afford to lose.
The private Extras feed, where the cycle-heat gauge, Mayer Multiple and valuation reads update with their invalidation levels attached, is part of PRO Paradiser, the intelligence layer behind the ParadiseFamilyVIP strategies.














Join the discussion 16
Valuation headroom is irrelevant without an invalidation plan. Timid demand means more time to define the entry risk, not less.
Sandra, I'd say timid demand actually means you *have* to define your invalidation even more clearly. It's about calibrating your entry. 🤔
even timid demand is still demand, right. its how i learned to buy, just a little at a time steady.
yeah, steady accumulation is the only way... noise from a friends rigs taught me that.
Tommy, 'timid demand' for me means less conviction from buyers, not just small sizing. It signals a different market dynamic. 🤔
conviction comes from holding, not from big buys up front. a little steady demand is how you get new holders anyway right, same as always.
I feel like "timid" demand describes how I'm watching this chart too... it's like a slow build up, right? 📈 Learning from you all. 🙏
Timid demand" is precisely where many first found conviction - I remember it well from '13. Recovery here suggests a lack of broad liquidity rather than any deep structural shift just yet.
Indeed, Isabella. That initial timid demand also provides a longer accumulation period for those prioritizing a margin of safety.
Timid demand" makes me remember my very first purchase, with shaking hands! I'm sorry, I just wondered if this timid demand means a slower recovery for everything? 🤔
that's what i'm wondering too marta. and are we gonna see more choppy sideways from this? 😵💫
Timid demand... that was me in 2021, FOMOing into tiny bits 🤏 then going 💯 on some random dog coin 🐶. Not again!! My bags from that are still *heavy* 😂.
Oh dear, I know that feeling! 😅 I'm trying very hard to avoid those dog coins now... it's about the research first.
I'm not sure how to measure "timid" demand, really. Do we have a source for that metric, or is it more of a qualitative observation?
It seems more of a directional sentiment than a measurable metric. I prefer to see clear reclaims of prior structure for conviction.
yeah "timid demand" is like my whole strategy, just tiny bits in and out 🤷♂️ sometimes i get chopped though!