

In short
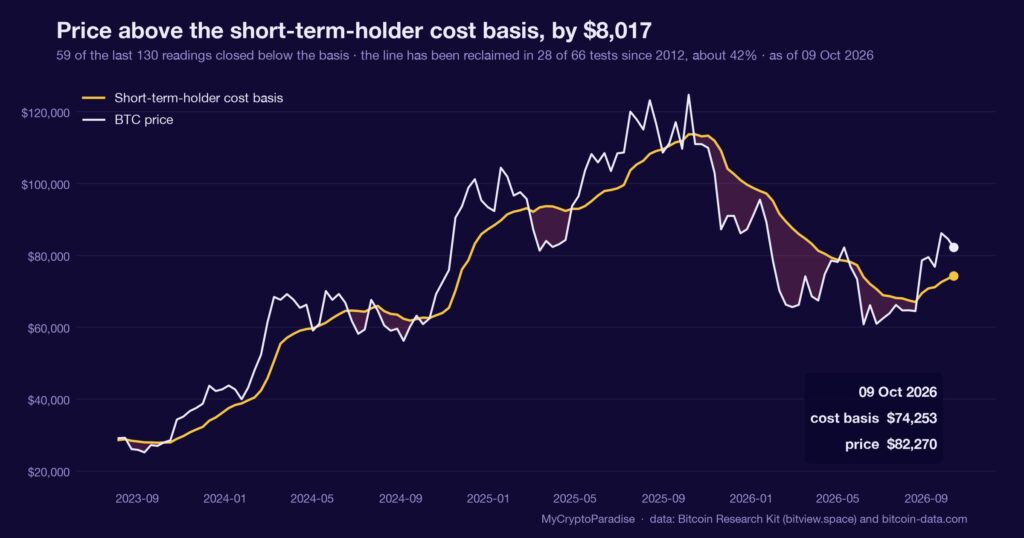
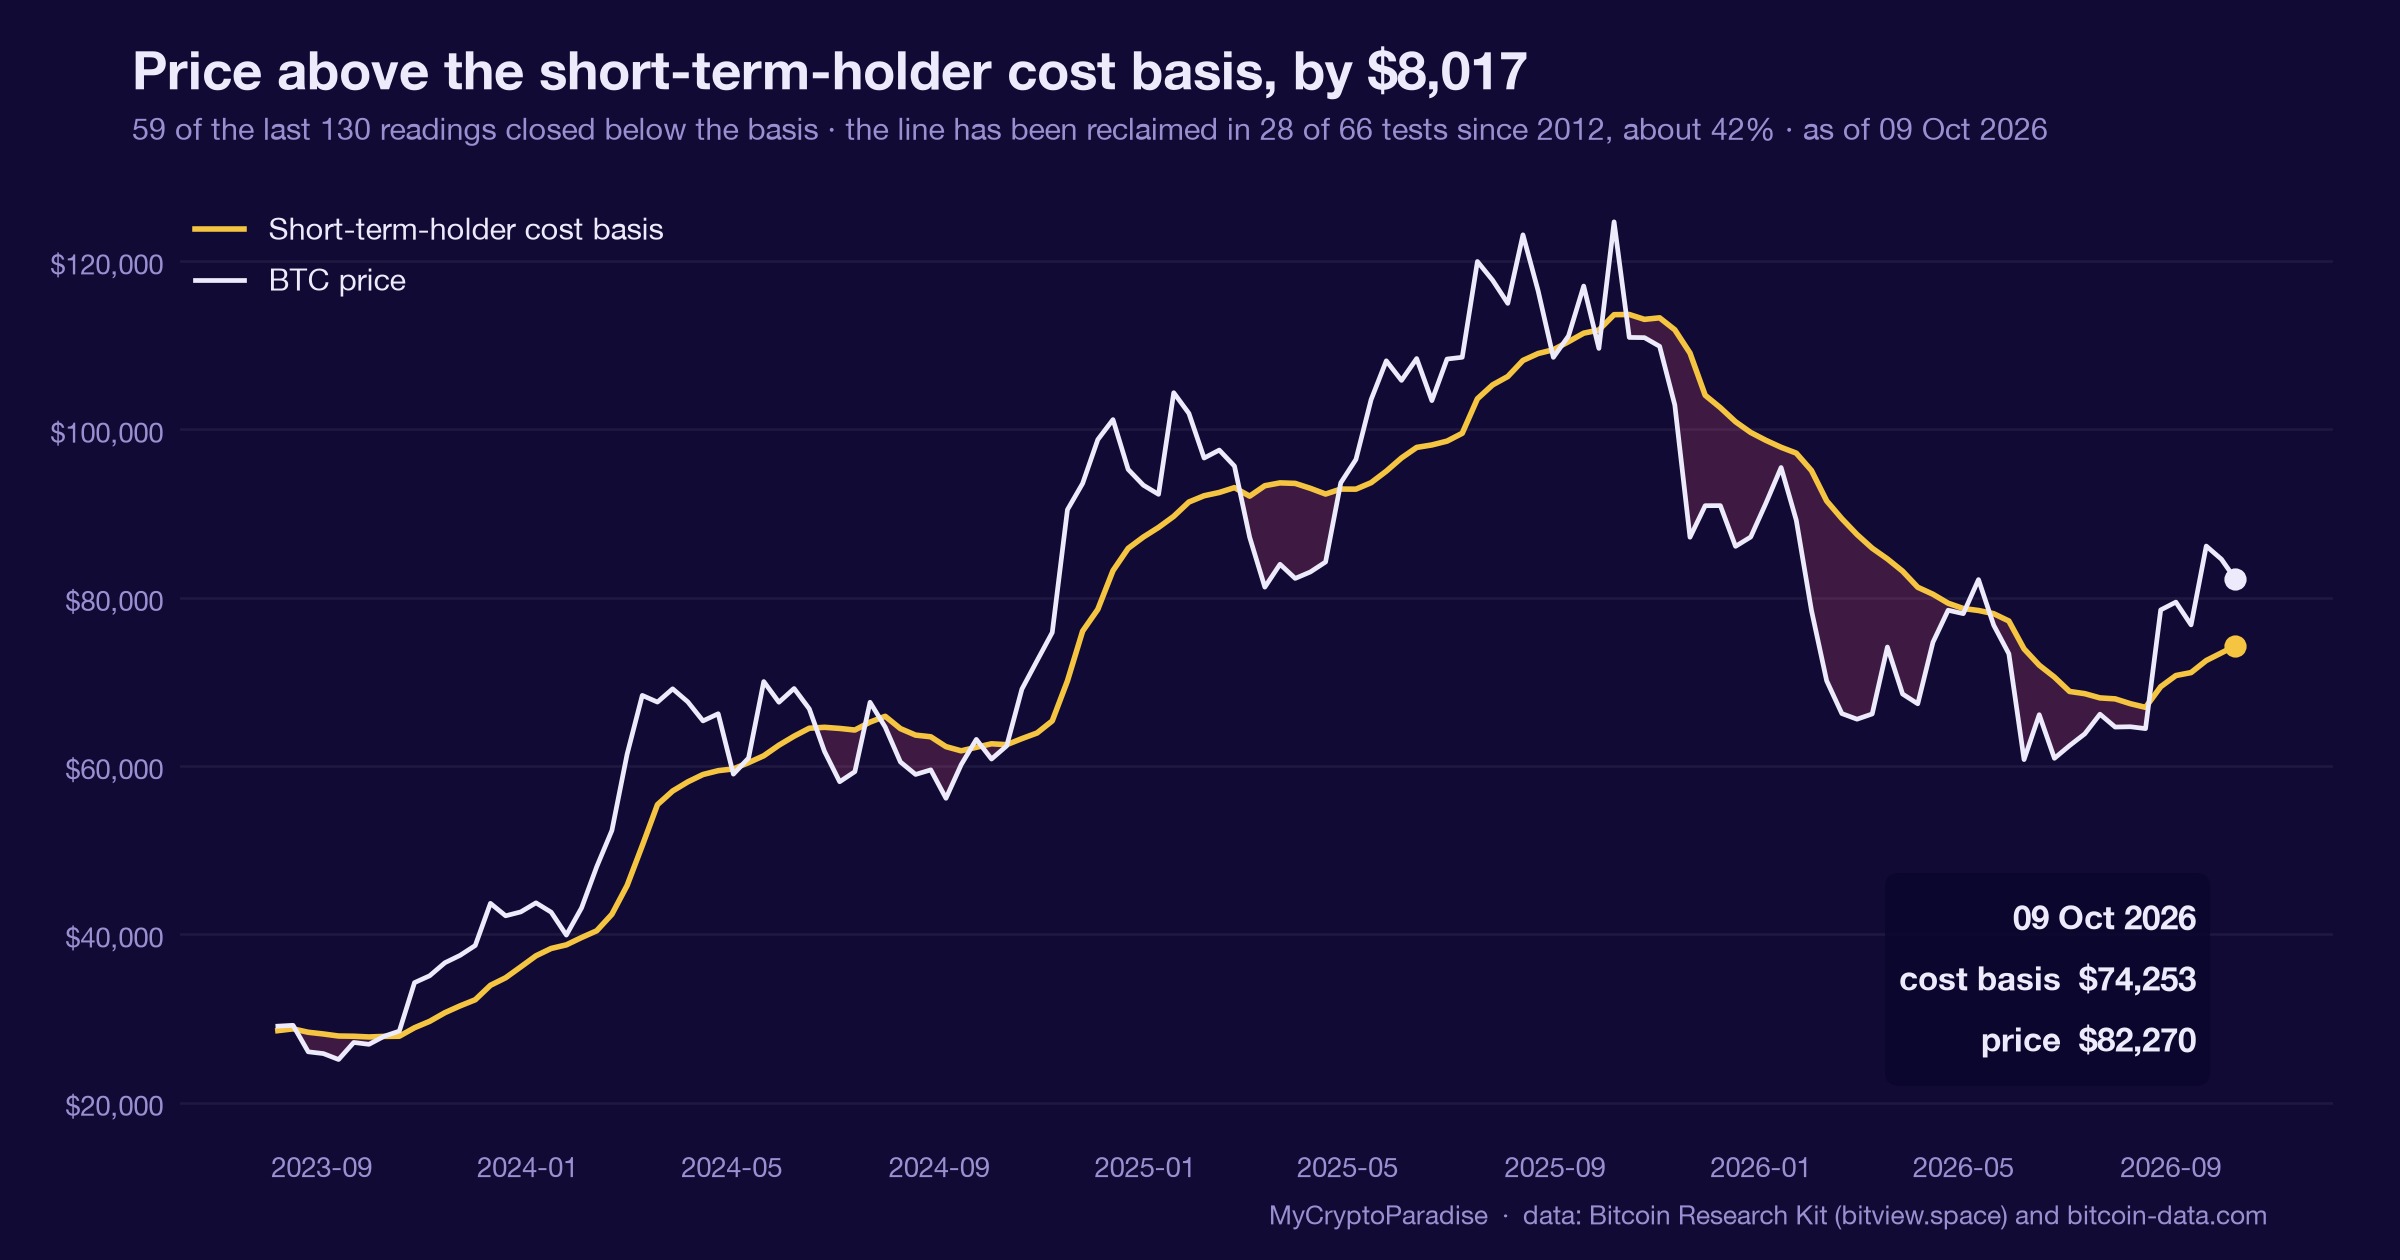
The realized price is the average price every bitcoin last moved at, the network’s aggregate cost basis. On 9 October 2026 bitcoin traded at $82,270, about 53 percent above a realized price of $53,789, and 8.17 times the daily range above the short-term-holder cost basis of $74,253. We read that as constructive, not euphoric, and refused to call it a top: a 53 percent premium sits far below the three-figure premiums that marked past cycle peaks. Our September cost-basis reads leaned constructive while price held above this cohort line, and spot has since climbed from the high $77,000s; the line held. The caveat is real: our data shows 31 percent of all supply last moved above today’s price, and 30.1 percent of recent buyers are underwater. Base rates for this regime are not wired, so we claim no frequency. This piece shows you how to read bitcoin’s cost basis yourself, cohort by cohort.
Key facts
- Bitcoin price at the reading
- $82,270
- Short-term holder cost basis
- $74,253
- Price against that cost basis
- $8,017 above
- Share of short-term holder supply underwater
- 30.1%
- State
- price above the short-term-holder cost basis
- What would prove this read wrong
- A daily close below the short-term-holder cost basis of $74,253, which flips the recent-buyer cohort from comfortable to trapped and hands the read to the bears.
- Reading taken
- 09 October 2026
- Source
- Our MCP Insights tools, from Bitcoin Research Kit (bitview.space) and bitcoin-data.com. Upstream data published by the Bitcoin Research Kit
A cost basis is a memory of what holders paid
Every coin on the network carries a memory: the price at which it last moved. Average those prices across all supply and you get the realized price, the network’s aggregate cost basis. It is not a chart level, it is the line that separates holders sitting in profit from holders sitting in loss.
Split that same supply by how long each coin has sat still and the memory sharpens. Recent buyers carry one cost basis; long-dormant coins carry a far lower one. The two cohorts behave differently under stress, because a holder defending a gain and a holder nursing a loss do not make the same decision.
That is the whole mechanism. A cost basis does not predict price. It tells you who is comfortable and who is trapped, and comfort and discomfort are what turn into supply.
The cushion is wide, the trap shallow
Per our MCP Insights cost-basis model, on 9 October 2026 bitcoin traded at $82,270 against a realized price of $53,789: a 53 percent premium to the aggregate cost basis. The short-term-holder cost basis, the average paid by recent buyers, sat at $74,253, leaving spot $8,017 above it, or 8.17 times the daily range of $982.
The long-term-holder cost basis sat far lower, at $49,290. Of 3,622,012 coins in short-term hands, 1,088,903 were underwater, a 30.1 percent loss share. Across all supply, 31 percent last moved above today’s price.
Spent-output data told the same story: short-term holders realized a SOPR, the ratio of sale price to cost, of 1.0012, barely in profit, while the long-term cohort printed 0.9894, selling fractionally into loss. Nobody was distributing in euphoria, and that absence is itself the reading.
What is different here
The ParadiseTeam does not read a cost basis as a single line in the sand. We split supply by cohort and by how long each coin has sat still, then watch the loss share move, because a premium that looks euphoric in aggregate can still hide a recent buyer who is quietly trapped.
A 53 percent premium is a cushion, not a ceiling
The obvious misread is that a 53 percent premium over cost basis means the move is stretched and due to unwind. History disagrees in character: the premiums that preceded genuine cycle tops were measured in the hundreds of percent, not the fifties. A number in this range is mid-expansion, not late-stage.
The second misread is to treat the trapped 30.1 percent as a bearish verdict. It is not. A loss share that is falling rather than rising means recent weakness is being absorbed, not amplified; trapped supply becomes forced supply only when price breaks the cost basis it is defending.
This is one input. It sits alongside funding, open interest (OI) and spot flows, and today it is the one arguing that the structure beneath price is firmer than the premium alone suggests.
A reading that only flatters the bull case is decoration. The underwater third is what sizes the risk.
The line that keeps this read honest
Translate the data into posture, not entries. The constructive lean is only valid while spot holds above the short-term-holder cost basis at $74,253; that line, 8.17 times the daily range below price today, is the invalidation. A daily close beneath it flips the recent cohort from comfortable to trapped and hands the read to the bears.
The long-term cohort selling fractionally into loss, rather than booking large gains, is the detail that keeps this from being a late-cycle story. Distribution tops look like old coins realizing enormous profit; this is the opposite.
The probability shifted; it did not resolve. A wide cushion above one cohort line is a lean, and it is worth exactly one line of risk: the level that flips it. Everything else is patience.
Reading bitcoin’s cost basis yourself, step by step
- Start with the realized price: the average cost basis of all supply, and the line between aggregate profit and loss.
- Split that supply into short-term and long-term cohorts, since recent buyers and old coins carry very different cost bases.
- Measure spot’s distance above each cohort line in daily ranges, not dollars, so the cushion is comparable across regimes.
- Check the loss share and whether it is rising or falling: a falling share means weakness is being absorbed.
- Mark the cohort line as your invalidation, and treat a daily close beneath it as the read flipping.
The step people skip is the loss share’s direction. A static snapshot of who is underwater says little; whether that group is growing or shrinking is the signal.
Every number above is checkable against the live data. Start with the MCP Insights hub, then cross-read the Crypto Fear and Greed Index and the live crypto funding rates.
Act and invalidate
| Scenario | What confirms it | What kills it |
|---|---|---|
| Cushion holds, grind higher | Spot holds above $74,253, loss share falling | Daily close below $74,253 |
| Recent buyers get trapped | Daily close under the short-term cost basis | Reclaim and hold above $74,253 |
| Late-cycle distribution | Long-term SOPR climbs well above 1 | Long-term SOPR stays below 1 |
Posture: Constructive but patient while spot holds its short-term cost basis; the single line worth watching is $74,253, and a daily close beneath it turns the read defensive.
Frequently asked questions
What is bitcoin’s realized price?
The realized price values every coin at the price it last moved on-chain, then averages across all supply. It is the network’s aggregate cost basis, and on 9 October 2026 it sat at $53,789 against a spot price of $82,270.
Does a high premium mean a top?
Not at this scale. The premiums that preceded past cycle peaks ran into the hundreds of percent; a 53 percent premium over realized price is mid-expansion territory. The number is a weight on the bias, not a timing tool for calling a top.
What does SOPR tell you here?
SOPR, the ratio of sale price to the price coins were acquired at, shows who is selling in profit. On 9 October short-term holders printed 1.0012, barely green, while long-term holders printed 0.9894, selling slightly into loss. Neither reading looks like euphoric distribution.
What invalidates the constructive read?
A daily close below the short-term-holder cost basis of $74,253. That level sits 8.17 times the daily range beneath spot today, so it is a meaningful break, not noise. Below it, the recent buyer cohort flips from comfortable to trapped and the lean is gone.
Is cost basis enough to trade on?
No single metric is. Cost basis tells you where comfort and discomfort sit across cohorts, which is one probability weight among funding, open interest and spot flows. It sizes a bias you already hold; it does not generate one on its own.
Crypto trading involves substantial risk and is not suitable for everyone. Nothing here is financial advice; it is education only. Never risk more than you can afford to lose.
The private Extras feed, where the realized-price premium, the cohort cost-basis lines and the loss-share trend update with their invalidation levels, is part of PRO Paradiser, the intelligence layer behind the ParadiseFamilyVIP strategies.












Join the discussion
No comments yet. Members, share how you are reading this.