

In short
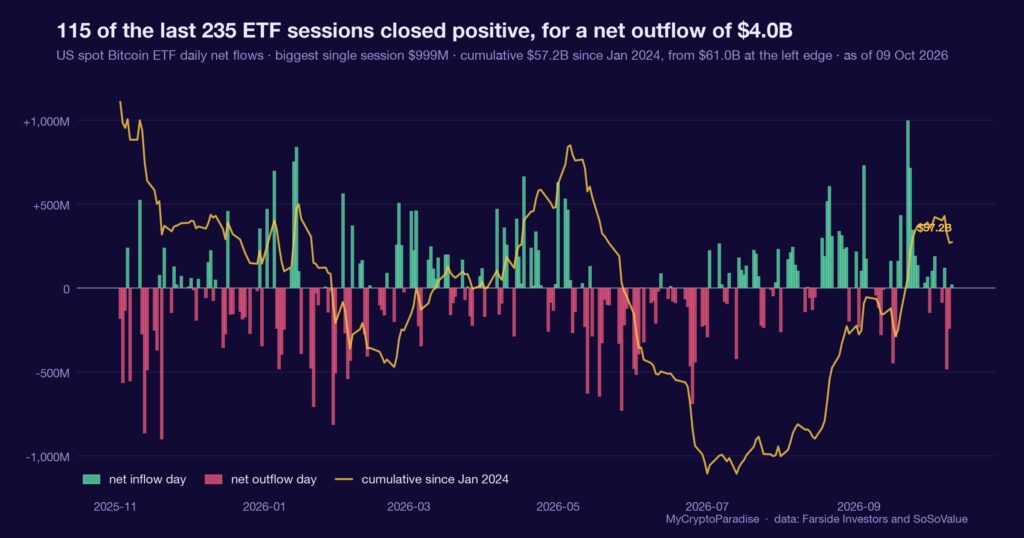
US spot Bitcoin exchange-traded funds (ETFs) are pooled vehicles whose daily creations and redemptions show how much institutional money enters or leaves Bitcoin. Through 9 October, our MCP Insights ETF-flow recon reading shows a net $681.1 million leaving over five sessions, the first negative week after a positive $241.1 million the week before. We read that as neutral, explicitly not a capitulation. The outflow ranks in only the 26th percentile of impulse by our own model estimate, and the 30-day net is still a positive $1,656.1 million. Price fell 4.51 percent across the same five sessions, so flows and price moved together, with no divergence flagged. The final session, 9 October, already printed a positive $21.1 million. This piece shows you how to read an outflow week yourself, and why a shallow one reads very differently from a deep one.
Key facts
- Latest session net flow
- $21.1M
- Net flow over the last five sessions
- -$681.1M
- Cumulative net flow since January 2024
- $57.17B
- What would prove this read wrong
- Three straight verified outflow days dragging the five-day net deeper from minus $681.1 million while BlackRock’s fund stops taking money, which would turn a shallow rotational week into a genuine withdrawal.
- Reading taken
- 09 October 2026
- Source
- Our MCP Insights tools, from Farside Investors and SoSoValue. Upstream data published by Farside Investors
How an ETF flow number is actually made
A spot Bitcoin ETF holds coins on behalf of investors. When demand rises, authorised participants create new shares and the fund buys Bitcoin to back them; when demand falls, they redeem shares and the fund sells. The daily flow is the net of both, not a headcount of believers.
So a negative week does not mean holders fled. It means redemptions outweighed creations at the margin, by some amount, over some number of days. The size matters more than the sign, and the size only has meaning next to its own history.
A flow number without its percentile is a headline, not a measurement. The sign tells you the direction; the percentile tells you whether to care.
The week of 9 October: $681 million out, and shallow
Through 9 October, our MCP Insights ETF-flow recon reading shows a net $681.1 million leaving US spot Bitcoin ETFs over five sessions, 5 to 9 October. That is the first negative week after a positive $241.1 million the prior week.
By its own history the week is shallow: the outflow impulse ranks in the 26th percentile, a model estimate, and the 30-day net is still a positive $1,656.1 million. Cumulative net since the funds launched sits near $57.2 billion.
The issuer split is the tell. BlackRock’s fund still took a positive $22.4 million on the final session and a positive $1,685.8 million over 30 days, while Fidelity’s shed $3.6 million on the day. Price fell 4.51 percent across the week, and our reading flagged no divergence: flows and price moved down together.
A positive 30-day net wrapped around a negative week is not a reversal. It is a pause, and the final session already turned back up with a positive $21.1 million.
Why a red week is not an exodus
The obvious misread is to treat $681 million leaving as institutions abandoning Bitcoin. The data does not support that. A 26th-percentile outflow is a mild one by this market’s own standard, and it landed on top of a 30-day net that stayed firmly positive.
BlackRock’s fund taking money on the very day the headline turned red is the clearest sign this was rotation at the margins, not a broad withdrawal. One week does not undo a month, and this week did not try to.
Flow is one input. It sits alongside funding, open interest and spot absorption, and on its own it weights a bias rather than setting one. A week that stays inside its own 30-day trend is a pause you note, not a level you trade.
What is different here
The ParadiseTeam does not report a flow number and stop. We rank it against every week since these funds launched, so a red headline is immediately placed as shallow or deep, and we read the issuer split and the price alignment before calling it anything at all.
Flows and price are saying the same thing
What makes this week honest is the alignment. Price fell 4.51 percent while money left, and our reading flagged no divergence. When flows and price move together, there is no hidden hand to hunt: the repricing and the redemptions are the same event seen twice.
That is different from a week where price holds while flows bleed, which would hint at buyers absorbing supply quietly, or price falling while flows stay positive, which would hint at leverage doing the damage. Neither is happening here.
The reading does not resolve the next move; it narrows it. A shallow, aligned outflow that stops on its final day is the market repricing in the open, which is the least dangerous way for money to leave.
What would turn a pause into a trend
The honest question is what would change this read. Three straight verified outflow days dragging the five-day net deeper, while BlackRock’s fund stops taking money, would turn a pause into a trend. That is the line to watch, not the single red week.
The reading runs a session behind, through 9 October, so the first thing to confirm is simply whether 10 October extended the final day’s inflow or reversed it. One data point does not make a trend either way.
A gauge that tells you when to stop trusting it is worth more than one that only ever confirms. The percentile is that gauge here: it says this week was ordinary.
Reading an ETF flow week yourself, step by step
- Start with the five-day net, not a single session: one day is noise, a week shows direction.
- Rank that net against the fund era’s own history as a percentile, so you know whether the week is mild or extreme.
- Check the 30-day net next: a red week inside a positive month is a pause, not a reversal.
- Read the issuer split: if the largest fund keeps taking money, the outflow is rotation at the margins, not a broad exit.
- Compare flows with price: aligned moves are a clean repricing, while a divergence between them is the thing to study.
The step people skip is the percentile. Without it a $681 million outflow sounds alarming, when against the fund era it is merely an ordinary, 26th-percentile week.
Every number above is checkable against the live data. Start with the Bitcoin ETF flow tracker, then cross-read the MCP Insights hub and the Crypto Fear and Greed Index.
Act and invalidate
| Scenario | What confirms it | What kills it |
|---|---|---|
| Shallow outflow holds | 30-day net stays positive | Three verified outflow days deepen it |
| Rotation, not exodus | Largest fund keeps taking money | Largest fund turns net seller |
| Clean aligned repricing | Flows and price fall together | Price holds while flows bleed |
Posture: Defensive and patient while the week sits inside its 30-day trend. The highest-probability action for most is no new position until 10 October confirms the final day’s turn or undoes it.
Frequently asked questions
Did institutions sell Bitcoin ETFs last week?
On net, modestly. Our recon reading shows $681.1 million leaving US spot Bitcoin ETFs over the five sessions to 9 October. That ranks in only the 26th percentile of outflow impulse, and the 30-day net stayed positive, so the selling was shallow rather than broad.
What does the outflow percentile actually mean?
It ranks the week’s net outflow against every week since the funds launched in 2024. A 26th-percentile reading means roughly three-quarters of past weeks saw larger moves. It is a model estimate, but it reframes a scary headline number as an ordinary one.
Why did Bitcoin’s price fall with the outflows?
Price fell 4.51 percent across the same five sessions, and our reading flagged no divergence. Flows and price moved down together, which means the redemptions and the repricing are one event, not two. Aligned moves carry no hidden pressure waiting to surprise either side.
Is a down week a trend reversal?
Not on this evidence. The $681.1 million outflow sits inside a 30-day net of positive $1,656.1 million, and the largest fund still took money on the final session. A single red week inside a positive month is a pause, and the final day already turned back up.
When should I stop trusting this read?
When three straight verified outflow days drag the five-day net deeper while the largest fund stops taking money. That combination would turn a shallow, rotational week into a genuine withdrawal. Until then the percentile says this week was ordinary, and one session of fresh data cannot change that.
Crypto trading involves substantial risk and is not suitable for everyone. Nothing here is financial advice; it is education only. Never risk more than you can afford to lose.
The private Extras feed, where the five-day net, the outflow percentile and the issuer split update with their invalidation levels, is part of PRO Paradiser, the intelligence layer behind the ParadiseFamilyVIP strategies.












Join the discussion
No comments yet. Members, share how you are reading this.