

In short
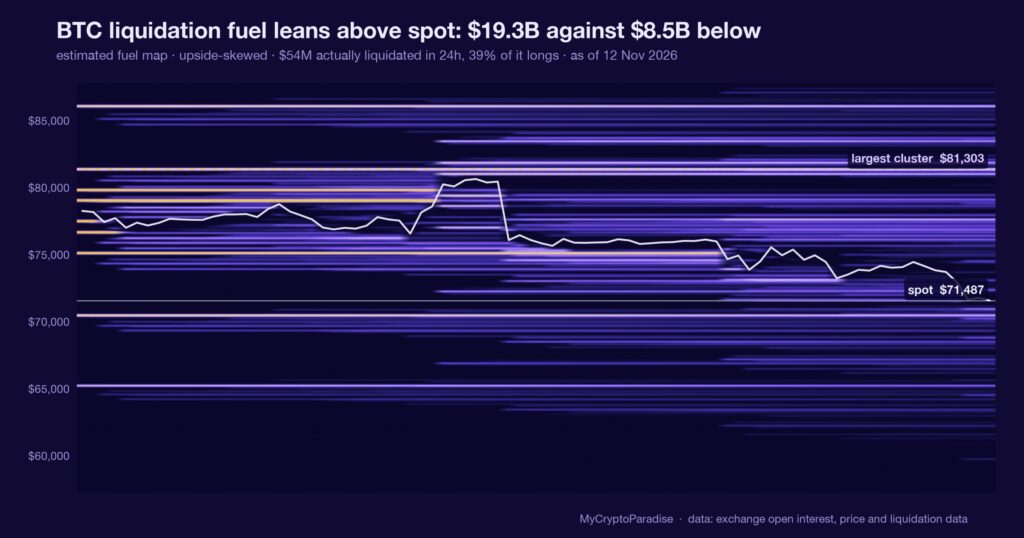
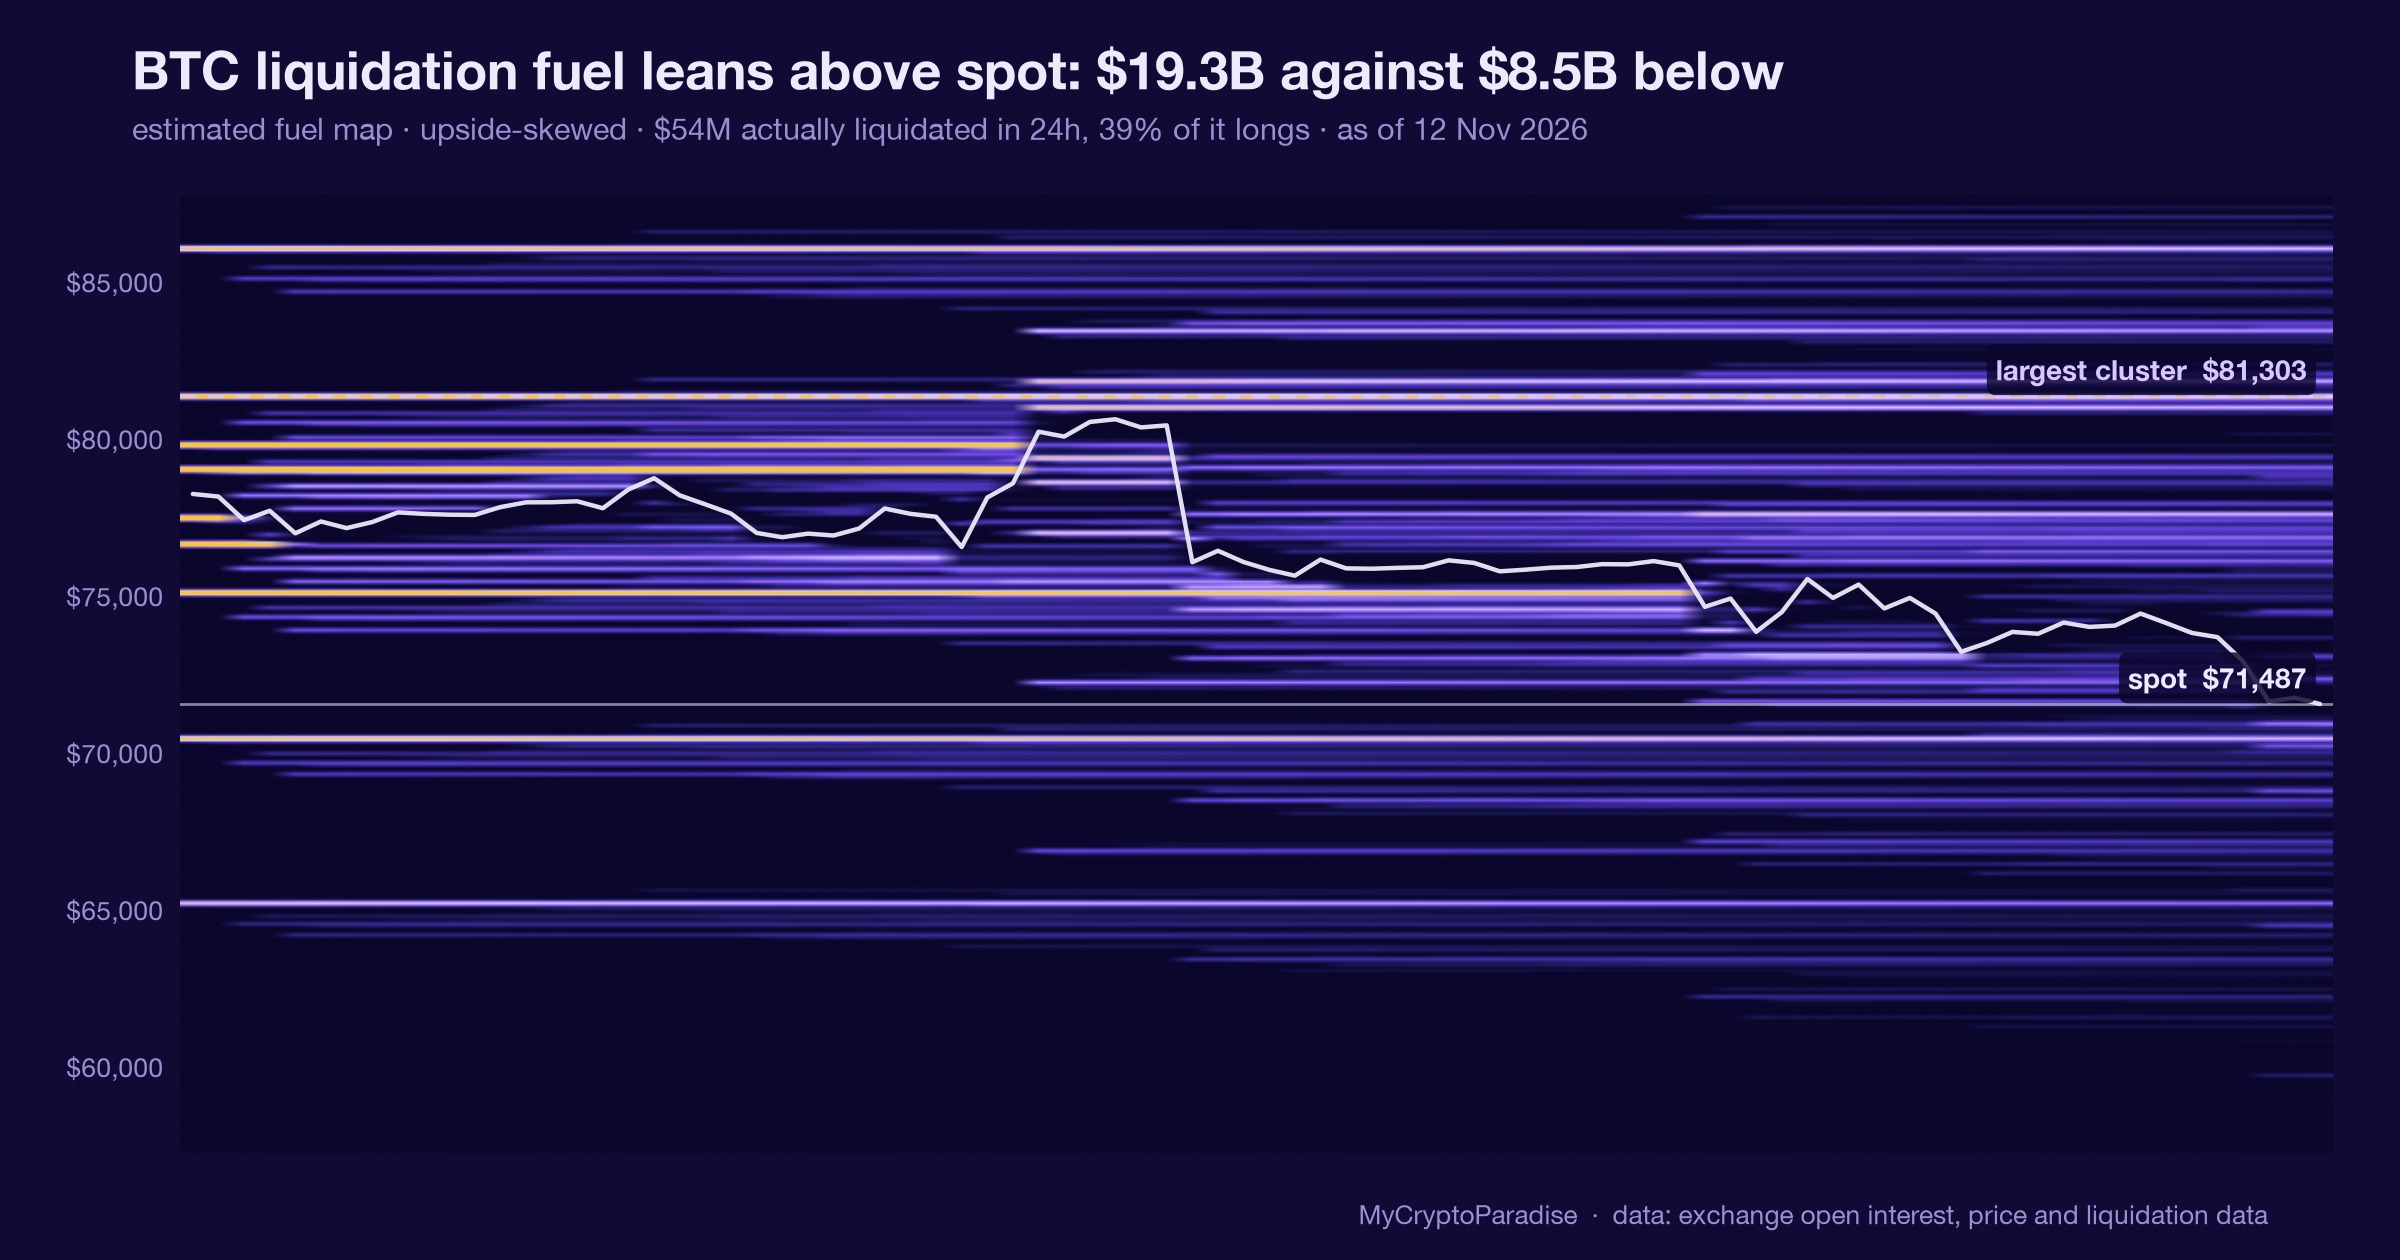
A liquidation fuel map estimates where forced-exit orders stack above and below spot, turning stop placement into a rough picture of pressure. On 12 November 2026 a single trader was force-closed on Hyperliquid: $63.97M of positions gone, $10.76M lost, now flat. That is one account, not a regime. Our MCP Insights fuel map, a model estimate that has not cleared its calibration gate, reads BTC at $71,486 with $19.27B of estimated fuel above spot against $8.53B below, about 2.3 to 1; ETH sits 3.1 to 1 the same way. We call that a mild upside lean, explicitly not a buy call. No calibrated base rate is wired, so we quote no historical frequency and the skew stays a lean. This piece shows you how to read a liquidation fuel map yourself, caveats attached.
Key facts
- BTC spot at the reading
- $71,487
- Estimated BTC liquidation fuel above spot
- $19.27B
- Estimated BTC liquidation fuel below spot
- $8.53B
- Fuel balance
- upside-skewed, +39 points toward the heavier side
- What would prove this read wrong
- A daily close that drags the estimated fuel map firmly below spot, or a fresh cluster of forced exits rebalancing the above-and-below split toward parity.
- Reading taken
- 12 November 2026
- Source
- Our MCP Insights tools, from exchange data
Forced exits are not opinions
A liquidation is not a trade someone chose. It is an exchange closing a position because the margin behind it ran out, at whatever price the book offers.
A fuel map takes those forced-exit levels and stacks them above and below the current price, so you can see where a move would feed on itself. Stops above spot are short positions waiting to be bought back; stops below are longs waiting to be sold.
That makes the map a picture of pressure, not direction. A cluster is only potential energy: it tells you where a push would accelerate, never that a push is coming.
One account blew up, the map barely moved
The alert that triggered this piece is real and it is small. On 12 November 2026 a single trader on Hyperliquid was force-closed out of $63.97M of positions, booking $10.76M in losses, part of $16.13M in total liquidation losses and $18.52M across their lifetime. They now hold nothing.
Behind that one blowup, our MCP Insights fuel map reads calm. With BTC near $71,486, it holds $19.27B of estimated fuel above spot against $8.53B below: about 2.3 to 1, upside-skewed. ETH sits the same way near $2,014, $10.11B above against $3.22B below, roughly 3.1 to 1.
This reading is a model estimate that has not passed its calibration gate, so treat it as a recon lean, not a measured rate. One liquidated whale does not bend a map this size. The forced flow is already spent; the skew it left behind is what remains to read.
What is different here
The ParadiseTeam does not read a liquidation alert as a forecast. We separate the forced flow that already happened, which is spent, from the standing fuel map, which is a lean, and we attach an invalidation to the lean so a model estimate never gets quoted as a certainty.
The scary number is the smallest one
The obvious misread is to treat a $63.97M liquidation as a market event. It is not. It is one margin account meeting one bad price, and the trader is already flat, which means the selling it caused is finished rather than pending.
The number that matters is the standing asymmetry, and it points the other way from fear. More estimated fuel sits above spot than below, which means a rally has more forced buying to run than a sell-off has forced selling. That is a weight on an upside bias, not a destination.
This is one input. It sits alongside funding, open interest and order-book depth, and on its own a fuel map is a probability weight on a bias, never the bias itself.
A lean worth one line of risk
With no calibrated base rate wired, we cannot tell you how often a 2.3-to-1 upside skew has resolved higher, and we will not pretend otherwise. A number with no error bar is decoration, not evidence.
So the skew earns exactly one line of risk: it leans the odds, it does not set a level. It stops being the higher-probability reading the moment the map tips the other way, which a daily close that drags estimated fuel firmly below spot would do.
You can watch that shift happen on our crypto liquidation heatmap, where the above-and-below split updates as price moves. A gauge that admits it is only a lean is more useful than one that always finds a signal.
What a spent liquidation leaves behind
The useful question after a blowup is not how big it was, but whether it changed the standing map. This one did not: a $63.97M forced exit is real money for the trader and a rounding error against roughly $27.8B of estimated total BTC fuel on the board.
So the read after the event matches the read before it: the asymmetry still sits above spot on both majors, and the forced seller who just left took none of that upper fuel with them. The blowup emptied one account, not the cluster.
That is the quiet value of a fuel map: it tells you when a frightening headline has not actually moved the thing you are measuring. A read that reacts to every alert is noise with a chart attached.
Reading a liquidation fuel map yourself, step by step
- Start with spot, then note how much estimated fuel sits above that price versus below it.
- Convert the two totals into a ratio: $19.27B above against $8.53B below is about 2.3 to 1.
- Check whether the reading carries a model-estimate flag; if it does, call it a lean, never a rate.
- Separate forced flow that already printed from fuel still resting, since spent stops cannot push price again.
- Pick the daily close that would flip the skew, and treat that level as your invalidation.
The step people skip is the flag check: an uncalibrated estimate quoted as a historical frequency turns a reasonable lean into a false promise, and nobody sizes a false promise well.
Every number above is checkable against the live data. Start with the crypto liquidation heatmap, then cross-read the MCP Insights hub and the Crypto Fear and Greed Index.
Act and invalidate
| Scenario | What confirms it | What kills it |
|---|---|---|
| Upside skew holds | Fuel stays above spot | Daily close tips fuel below |
| Map rebalances | Above and below near parity | Skew widens past 3 to 1 |
| Forced flow was noise | No follow-on liquidations | Fresh cluster force-closes nearby |
Posture: A 2.3-to-1 upside skew on estimated data is a lean worth one line of risk, not a position. The highest-probability stance for most remains patience until the map either confirms or tips.
Frequently asked questions
What actually happened on Hyperliquid?
A single trader was force-closed out of $63.97M of positions on 12 November 2026, losing $10.76M in that event and holding nothing afterward. It was one margin account running out of room, not a market-wide flush, and the selling it caused is already finished.
Does a whale liquidation move the price?
Rarely on its own. A forced exit prints real selling, but once the account is flat that pressure is spent and cannot repeat. What matters more is the resting fuel the event leaves behind, since that is what a future move would feed on.
What does upside-skewed fuel mean?
It means more estimated liquidation orders sit above the current price than below it. Those upper stops are short positions that get bought back if price rises, so a rally has more forced fuel to run than a sell-off does. It is a lean, not a target.
Is this fuel map a reliable number?
It is a model estimate that has not cleared its calibration gate, so we quote it as a recon lean rather than a measured frequency. Treat the 2.3-to-1 ratio as a weight on a bias, and watch the invalidation level that would flip it.
When does the upside lean stop being valid?
When a daily close drags the estimated fuel map firmly below spot, or when a fresh cluster of forced exits rebalances the split toward parity. Either event removes the asymmetry, at which point the reading no longer leans in one direction.
Crypto trading involves substantial risk and is not suitable for everyone. Nothing here is financial advice; it is education only. Never risk more than you can afford to lose.
The private Extras feed, where the liquidation fuel map, the above-and-below skew and its invalidation level update intraday, is part of PRO Paradiser, the intelligence layer behind the ParadiseFamilyVIP strategies.












Join the discussion
No comments yet. Members, share how you are reading this.