

In short
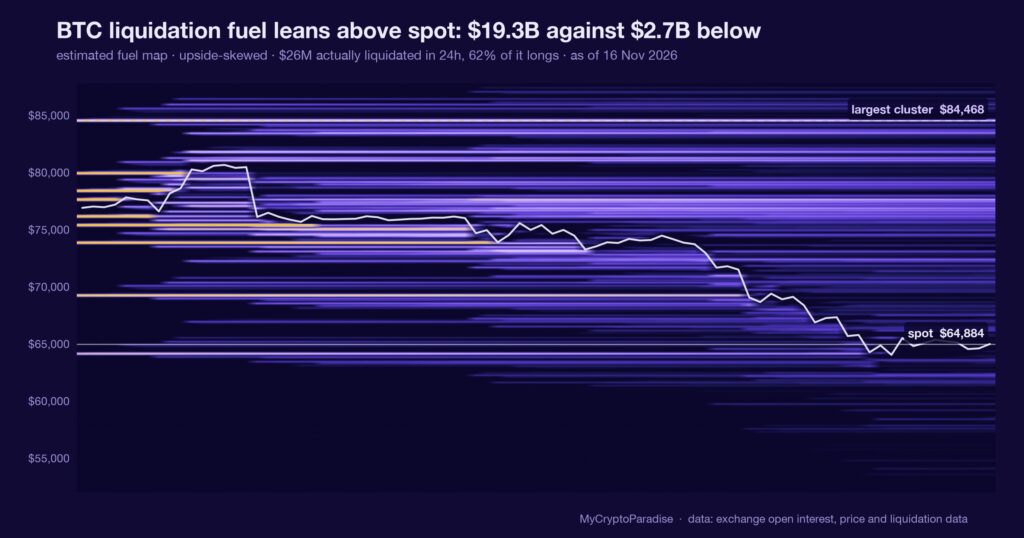
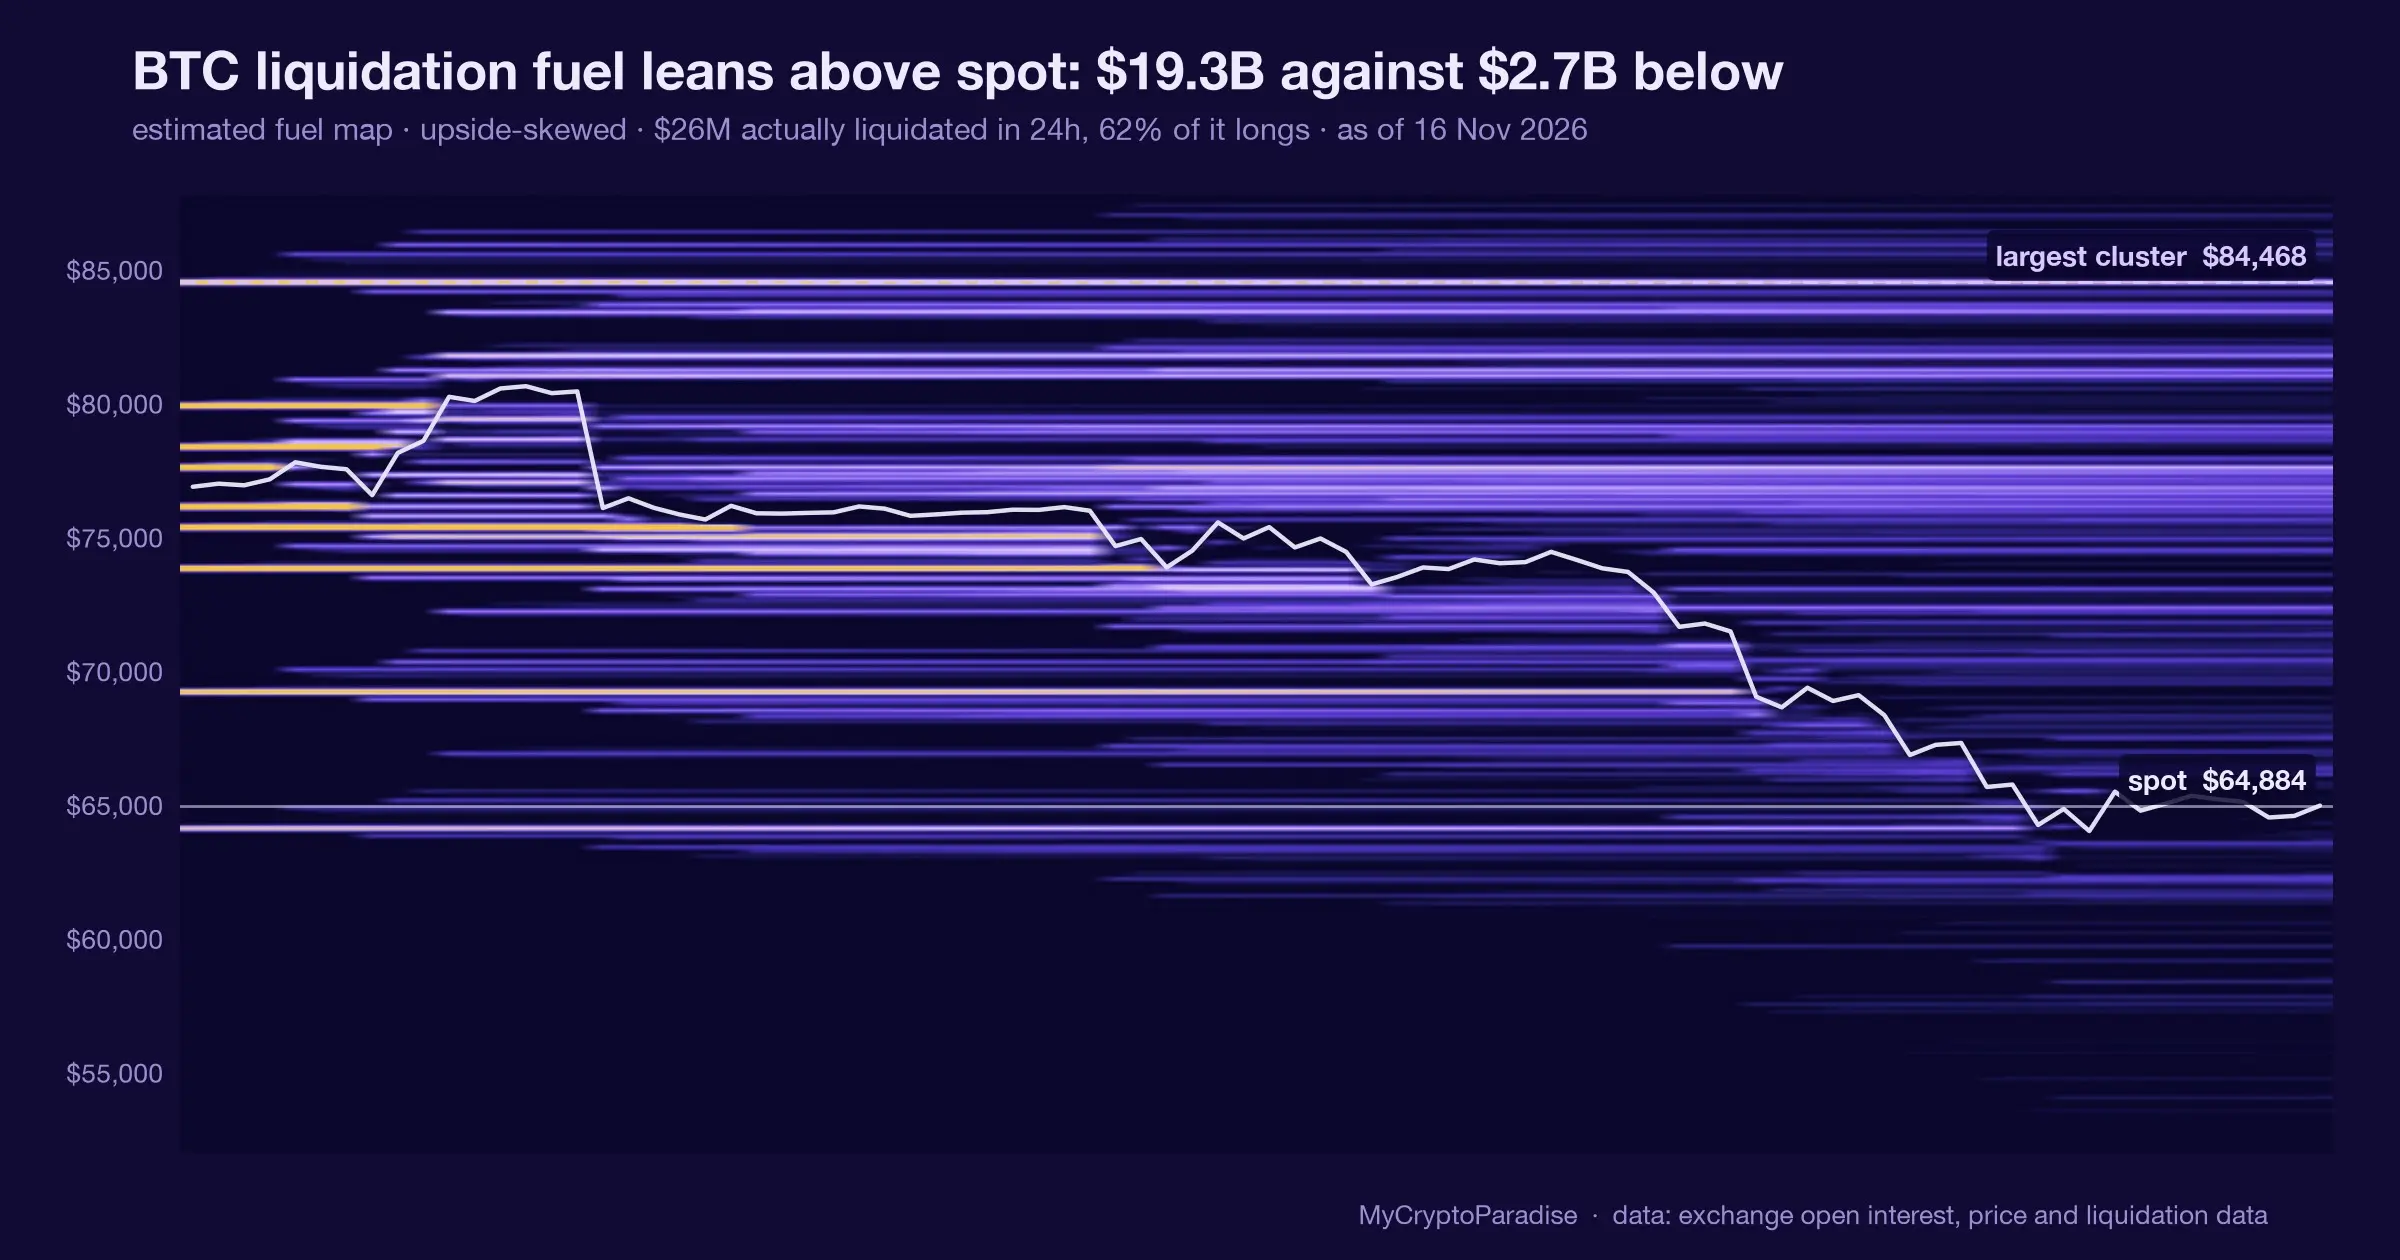
A liquidation fuel map estimates where leveraged positions would be force-closed, and an upside-skewed map means more of that fuel sits above spot than below. On 16 November 2026 our MCP Insights estimate read $19.27B of fuel above against $2.68B below, 7.2 to 1, an imbalance of plus 76 with spot near $64,884. We call that a constructive lean, not a forecast that price travels up to burn it. The honesty tax: this reading carries a model-estimate flag that has not cleared its calibration gate, so we quote no rate, and the 24-hour forced tape ran the other way, 62 percent longs liquidated. Both facts sit in the piece, unsoftened. One extreme map is one input, and a lean is worth one line of risk. This piece shows you how to read a liquidation fuel map yourself, invalidation attached.
Key facts
- BTC spot at the reading
- $64,884
- Estimated BTC liquidation fuel above spot
- $19.27B
- Estimated BTC liquidation fuel below spot
- $2.68B
- Fuel balance
- upside-skewed, +76 points toward the heavier side
- What would prove this read wrong
- A daily close that drags the heavier estimated fuel pocket below spot, or the 24-hour forced tape turning majority-short while price falls.
- Reading taken
- 16 November 2026
- Source
- Our MCP Insights tools, from exchange data
A fuel map is estimated leverage, not destiny
A liquidation fuel map marks the price levels where leveraged positions would be force-closed if spot reached them. It is built from open positions and their estimated liquidation prices, aggregated into a grid above and below the current price.
When the map is upside-skewed, the larger pocket sits overhead: that is where forced buying would accelerate a move already in motion, not a reason one begins. Fuel is potential energy, and potential energy does nothing until something moves it.
A map of where stops sit is a map of consequences, not of intentions. It tells you where a move would run, never that it will start.
The 16 November map reads 7.2 to 1 above
Per our MCP Insights liquidation series, on 16 November 2026 the estimated fuel above spot totals $19.27B against $2.68B below, a 7.2-to-1 skew and an imbalance of plus 76. Spot sits near $64,884, and the grid spans $51,908 to $87,690.
The series flags itself: estimated, not yet through its calibration gate. That makes the figure our model reading, not a calibrated probability.
The near-price book adds friction. Within 2 percent of spot our grid holds about $1.0B of bids against $1.09B of asks, a 0.478 net ratio that eased 1.9 points, and our integrity check flags four large walls behaving unusually.
The forced tape disagrees outright. Our 24-hour tally across OKX, HTX, Gate, Kraken and dYdX ran $26.28M, and 62 percent of it was longs: $16.22M against $10.05M of shorts.
The map leans up while the last day of real forced flow leaned down. That gap is the reading, not a rounding error.
An overhead pocket is not a magnet you can trade
The tempting misread is that 7.2 times more fuel above means price must climb to ignite it. It does not. The map says where a rally would find forced buyers, not that a rally arrives.
Two things in our own data argue against rushing the upside. The estimate has not passed its gate, so the ratio is a recon reading rather than a measured frequency. And the real forced flow over the last day hit longs harder, while the near-price book leans faintly heavy with asks.
A read that only quotes the confirming half of the data is marketing. The disagreeing half is what sizes the risk.
What is different here
The ParadiseTeam does not trade the headline ratio. We check whether the series passed its calibration gate, read the 24-hour forced tape beside it, and size the lean to the half of the data that disagrees. An estimate quoted without its flag is decoration, not a measurement.
One estimated map, placed among the others
This is one input. It sits alongside funding, open interest and spot absorption, and today it is the loud one that the forced tape and the order book do not fully confirm.
Our order-flow absorption gauge reads no active episode and sits in a no-edge zone near its 93rd percentile, below its own gate: it declines to call a turn, and that restraint is information. The fuel map is a probability weight on a bias, not the bias itself.
A gauge that admits it has no edge is more useful than one that always finds a signal.
This skew is sharper than the recent maps
Our recent published maps ran far flatter: a roughly 2.3-to-1 overhead lean in mid-November and a map our grid simply labelled balanced in late October. A jump to 7.2 to 1 is a genuine change in shape, not noise.
What a change in shape earns is attention, not a position. The honest move is to mark the level that would confirm the lean and the level that would void it, then wait for price to pick.
A sharper imbalance raises the stakes of being right about direction. It does nothing to tell you the direction.
Reading a liquidation fuel map yourself, step by step
- Open the crypto liquidation heatmap and read the dollar fuel above spot against the fuel below, not just the ratio.
- Check the imbalance label and its sign: upside-skewed with a positive number means the larger pocket sits overhead.
- Look for an estimate or gate flag on the series, and treat a flagged reading as a model lean, not a frequency.
- Cross the map against the last 24 hours of forced liquidations: confirm whether real flow agrees with where the fuel sits.
- Mark the invalidation: the daily close that would drag the heavier pocket to the other side of spot.
The step people skip is the gate flag: they quote a ratio as if it were measured, when an unconfirmed estimate reads as a lean worth a line of risk.
Every number above is checkable against the live data. Start with the crypto liquidation heatmap, then cross-read the MCP Insights hub and the Crypto Fear and Greed Index.
Act and invalidate
| Scenario | What confirms it | What kills it |
|---|---|---|
| Upside squeeze lean holds | Daily closes grind up into the overhead pocket | Daily close drags fuel below spot |
| Map was a false tell | Forced tape stays majority-long as price slips | Shorts start dominating the 24-hour tally |
| No edge, no trade | Book stays spoof-flagged and absorption no-edge | A gated reading replaces the estimate |
Posture: Constructive lean on the overhead skew, but defensive near term while the forced tape and the book withhold confirmation. For most, the highest-probability trade here is no trade until the estimate clears its gate.
Frequently asked questions
What does an upside-skewed liquidation map mean?
It means our estimated fuel map holds more forced-close fuel above current price than below, here 7.2 to 1. That describes where a move would accelerate if it started, not a prediction that price climbs to reach the larger pocket.
Is the 7.2-to-1 reading a calibrated probability?
No. The series carries a model-estimate flag and has not cleared its calibration gate, so we treat it as a recon lean rather than a frequency. Without a wired base rate, we quote no historical rate at all for this regime.
Why did more longs get liquidated if fuel sits above?
The overhead fuel is potential, triggered only on a rise. The last 24 hours instead saw pressure that force-closed longs, 62 percent of a $26.28M tally. Present forced flow and resting fuel are different clocks, and today they point opposite ways.
What would invalidate the constructive lean?
A daily close that drags the heavier fuel pocket below spot, or the 24-hour forced tape turning majority-short while price falls. Either event removes the upside asymmetry the lean rests on, and the read resets to neutral with no edge.
Can one liquidation map decide a trade?
No. It is a single input that weights a bias built elsewhere, from funding, open interest and absorption. On its own an estimated map is a lean worth one line of risk, not a position, and today the other gauges withhold confirmation.
Crypto trading involves substantial risk and is not suitable for everyone. Nothing here is financial advice; it is education only. Never risk more than you can afford to lose.
The private Extras feed, where the estimated fuel map, the 24-hour forced tape and the absorption gauge update with invalidation levels attached, is part of PRO Paradiser, the intelligence layer behind the ParadiseFamilyVIP strategies.











Join the discussion
No comments yet. Members, share how you are reading this.