

In short
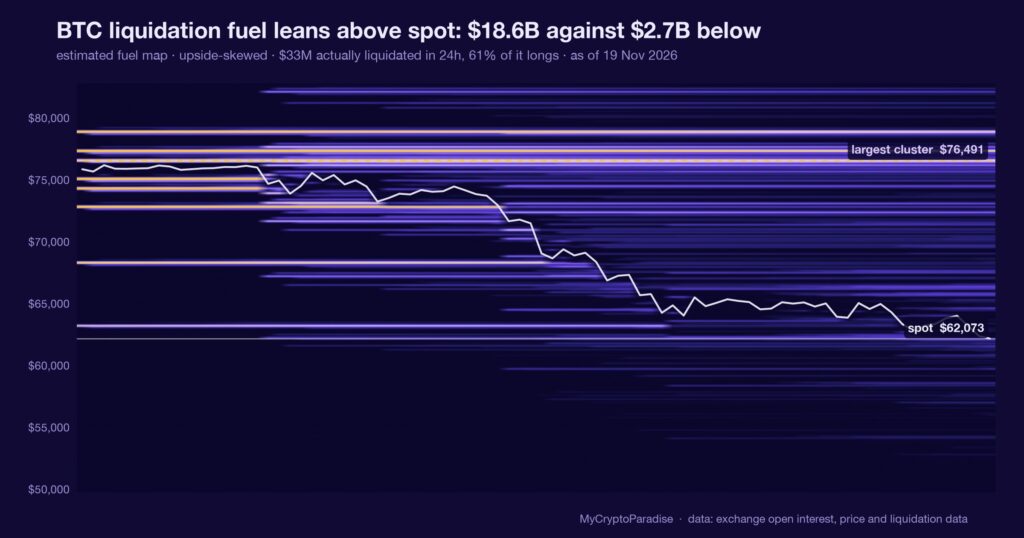
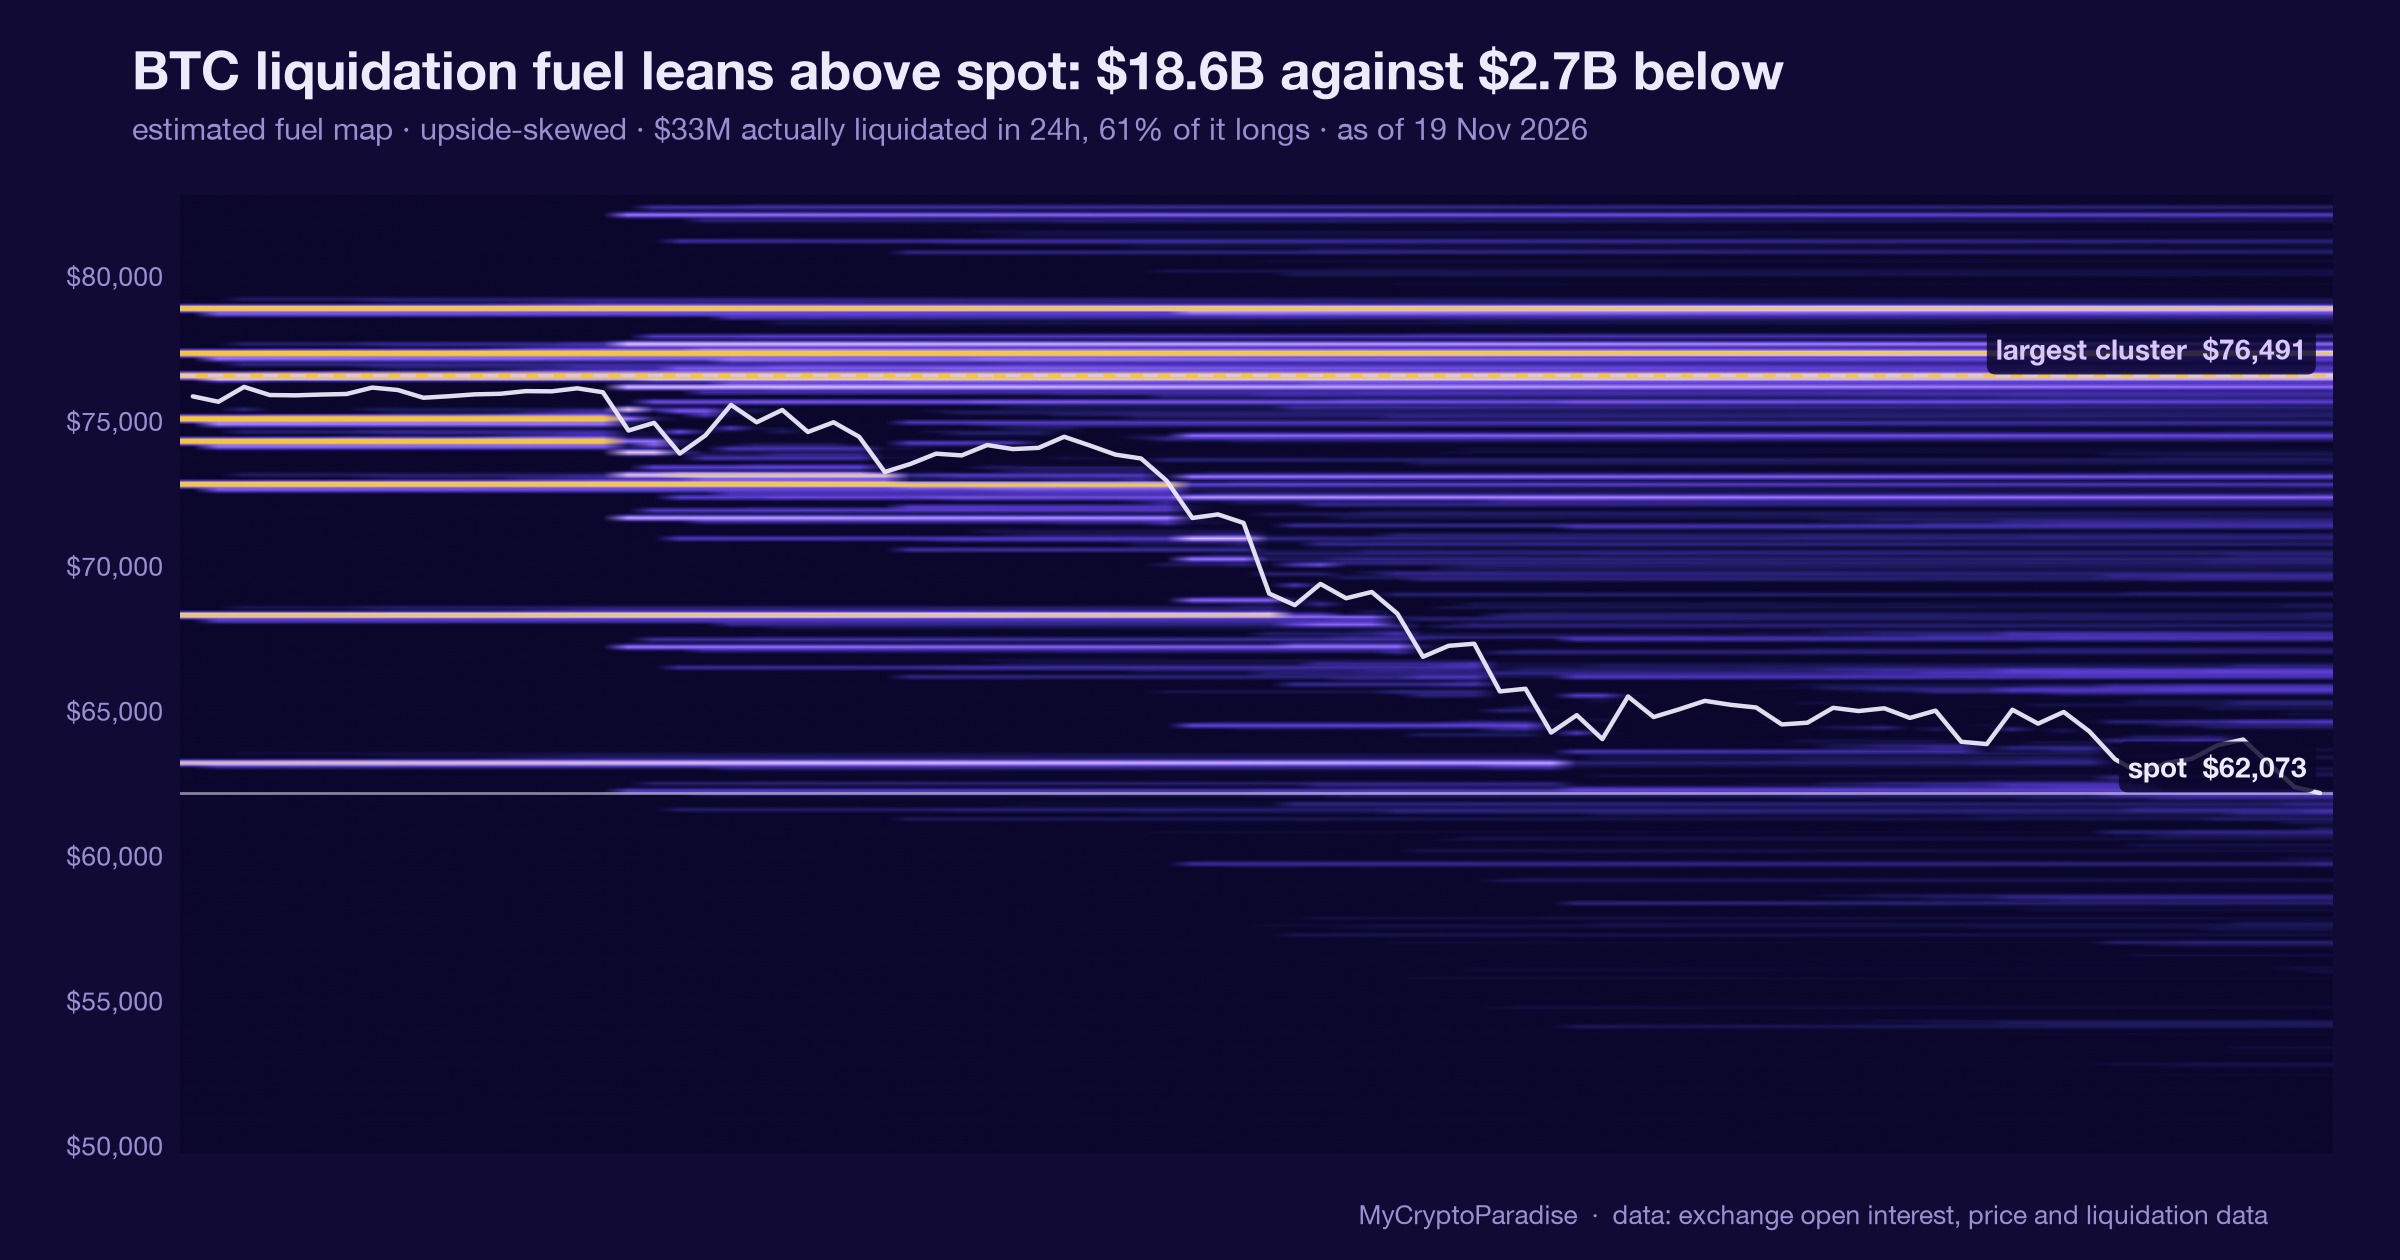
A liquidation fuel map estimates where forced orders sit above and below the current price, while order-book walls are the large resting bids and asks parked near it. On 19 November 2026, with BTC near $62,100, our MCP Insights reading showed an estimated $18.6B of fuel above spot against $2.7B below, 6.8 to 1. That series carries a model-estimate flag, so we quote it as a recon reading, not a rate, and we called the overall picture defensive rather than constructive. The near book leans mildly to the bid, three of its walls are flagged unstable, and 61 percent of the past day’s $32.7M in liquidations were longs. No base rate is wired for this regime, so we publish no historical frequency rather than decorate one. This piece shows you how to read the fuel map against the order book yourself, and where it flips.
Key facts
- BTC spot at the reading
- $62,073
- Estimated BTC liquidation fuel above spot
- $18.62B
- Estimated BTC liquidation fuel below spot
- $2.74B
- Fuel balance
- upside-skewed, +74 points toward the heavier side
- What would prove this read wrong
- A daily close that drags the heavier estimated fuel pocket below spot, or the 24-hour forced tape turning majority short, or the flagged near-book bids thinning out.
- Reading taken
- 19 November 2026
- Source
- Our MCP Insights tools, from exchange data
A wall you can trust is not a trap
A liquidation fuel map estimates where forced orders sit: the stops and margin calls that, once price reaches them, must transact regardless of what anyone wants. An order book wall is different. It is resting size, bids or asks parked near the current price, that a trader can pull at will.
That difference is the whole of today’s reading. Forced orders cannot be bluffed. Resting walls can, and a wall that appears and vanishes is not liquidity a trader has committed to defend.
A level is only support while the size behind it stays put. Size that flickers is a question, not an answer.
The overhead fuel and the near book disagree
Per our MCP Insights liquidation reading on 19 November 2026, with BTC near $62,100, an estimated $18.6B of liquidation fuel sits above spot against $2.7B below: 6.8 to 1, an imbalance score of 74. That series carries a model-estimate flag, so we treat it as a recon reading, not a calibrated rate.
The resting book tells a quieter story. Within 2 percent of spot our order-book data holds $1.15B of bids against $1.02B of asks, a net ratio of 0.53 that leans mildly to the bid and firmed 2.2 points from yesterday. Three large walls near price are flagged unstable.
The forced tape splits the other way. Over the past 24 hours $32.7M of BTC positions were liquidated, 61 percent of them longs against 39 percent shorts, on our OKX, HTX, Gate, Kraken and dYdX feed.
Three series, three directions. A reading that only quotes the one that agrees with a bias is decoration.
What is different here
The ParadiseTeam does not read the fuel map alone. We print it beside the resting order book and the 24-hour forced tape, then weight the lean by whether the three agree. When a series carries a model-estimate flag, we quote it as a recon reading and never as a historical rate.
Overhead fuel is a lean, not a level
The obvious misread is that overhead fuel pulls price up. It does not. The ratio says only that if BTC rallies, more forced buying waits above than below, so an advance could accelerate once it starts.
Nothing in the map says the advance starts. The near-book bids and the long-heavy liquidation tape both argue the opposite is just as live, and the model-estimate flag means we cannot put a frequency on either.
An asymmetry tells you where a move would run, never that it runs. The trigger is a separate question with a separate answer.
Unstable walls are where the hunt happens
The integrity flag is the part most readers skip. Our order-book read marks three large walls near price as behaving unusually: sizes that flicker rather than hold, the pattern of liquidity placed to be seen and then pulled.
Why that incentive exists is simple. A visible wall invites traders to lean on it, and whoever placed it can withdraw it the moment price arrives, turning a level that looked like support into empty air above the next pocket of forced orders.
The question a flagged wall asks is not how big it is. It is whether anyone intends to be there when price tests it.
This is one layer, and today it is split
Treat the fuel map as a single input. It sits alongside the resting book, the forced tape and the squeeze gauge, and today it is the layer that disagrees with the other two.
That disagreement is the finding. When the overhead fuel leans up, the near book leans mildly down and three of its walls are flagged unstable, the honest posture is defensive, not constructive. More layers of this read sit inside PRO Paradiser.
One indicator pointing up while two point sideways is not an edge. It is a reason to size smaller and wait for agreement.
Reading the fuel map against the book yourself, step by step
- Open the liquidation heatmap and read the fuel above spot against the fuel below, as a ratio, not a raw dollar figure.
- Check whether the series carries a model-estimate flag; if it does, treat the ratio as a recon reading, never a calibrated rate.
- Pull up the order book walls within 2 percent of spot and compare resting bids against asks for a confirming or conflicting lean.
- Read the wall integrity note: count how many large walls near price are flagged unstable before you trust any as support.
- Cross the 24-hour forced liquidation tape: see whether longs or shorts are being stopped out and which way that pressure points.
The step people skip is the integrity check. A wall sized like support means nothing if it flickers, and three flagged walls today are exactly that question.
Every number above is checkable against the live data. Start with the crypto liquidation heatmap, then cross-read the MCP Insights hub and the Crypto Fear and Greed Index.
Act and invalidate
| Scenario | What confirms it | What kills it |
|---|---|---|
| Overhead fuel resolves up | Daily close back above the near walls | Close dragging fuel below spot |
| Near book defends the range | Bids keep outweighing asks | Walls pulled, bids thin out |
| Long tape forces a flush | Shorts stay the minority of liquidations | 24-hour tape flips majority short |
Posture: Defensive while three series disagree. The constructive lean is only the overhead fuel, and a model-estimate flag sits on it, so the highest-probability posture for most is no new risk until the book and the forced tape confirm.
Frequently asked questions
What does the 6.8 to 1 fuel ratio mean?
It means our estimated liquidation map holds roughly $18.6B of forced orders above spot against $2.7B below on 19 November 2026. The ratio shows where a move would accelerate, not which direction price takes from here.
Why not call this bullish?
The overhead fuel leans up, but the near-book bids lean mildly down and three walls are flagged unstable, while the 24-hour tape is 61 percent long liquidations. Three series disagree, so a directional call would overstate one reading.
What is an order-book wall?
A wall is a large block of resting bids or asks parked near the current price. Unlike liquidation fuel, which must transact when hit, a wall can be pulled at any moment, so its size only matters while it stays put.
What would change this read?
A daily close that drags the heavier fuel pocket below spot would flip the map. So would the 24-hour forced tape turning majority short, or the near-book bids thinning out as the flagged walls are pulled from the book.
Why no historical frequency here?
Our base-rate lake is not wired for liquidation-fuel regimes yet, and the fuel series carries a model-estimate flag that has not cleared its calibration gate. Quoting a frequency we have not measured would be decoration, not evidence.
Crypto trading involves substantial risk and is not suitable for everyone. Nothing here is financial advice; it is education only. Never risk more than you can afford to lose.
The private Extras feed, where the fuel map, the resting order-book walls and the forced-liquidation tape update intraday with invalidation levels, is part of PRO Paradiser, the intelligence layer behind the ParadiseFamilyVIP strategies.











Join the discussion
No comments yet. Members, share how you are reading this.