

In short
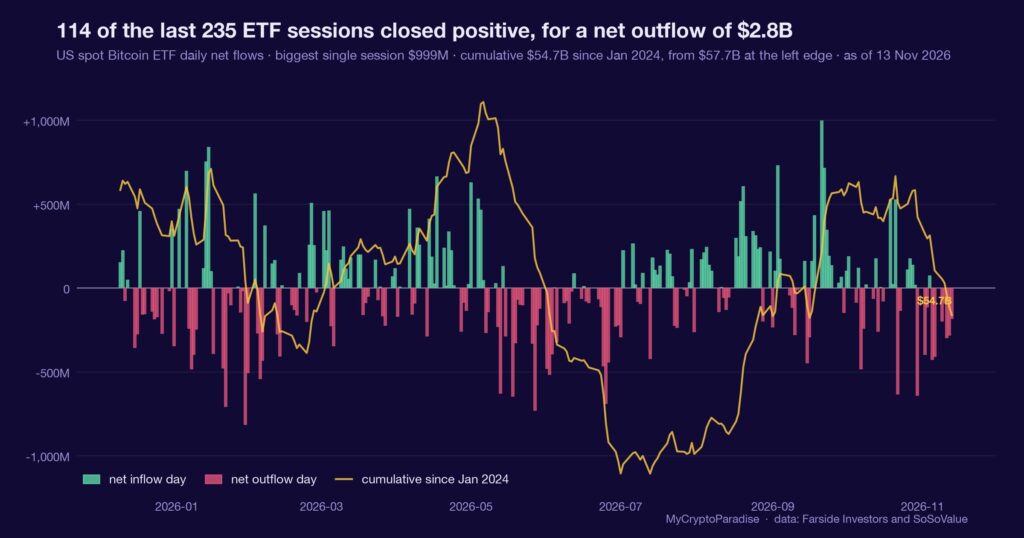
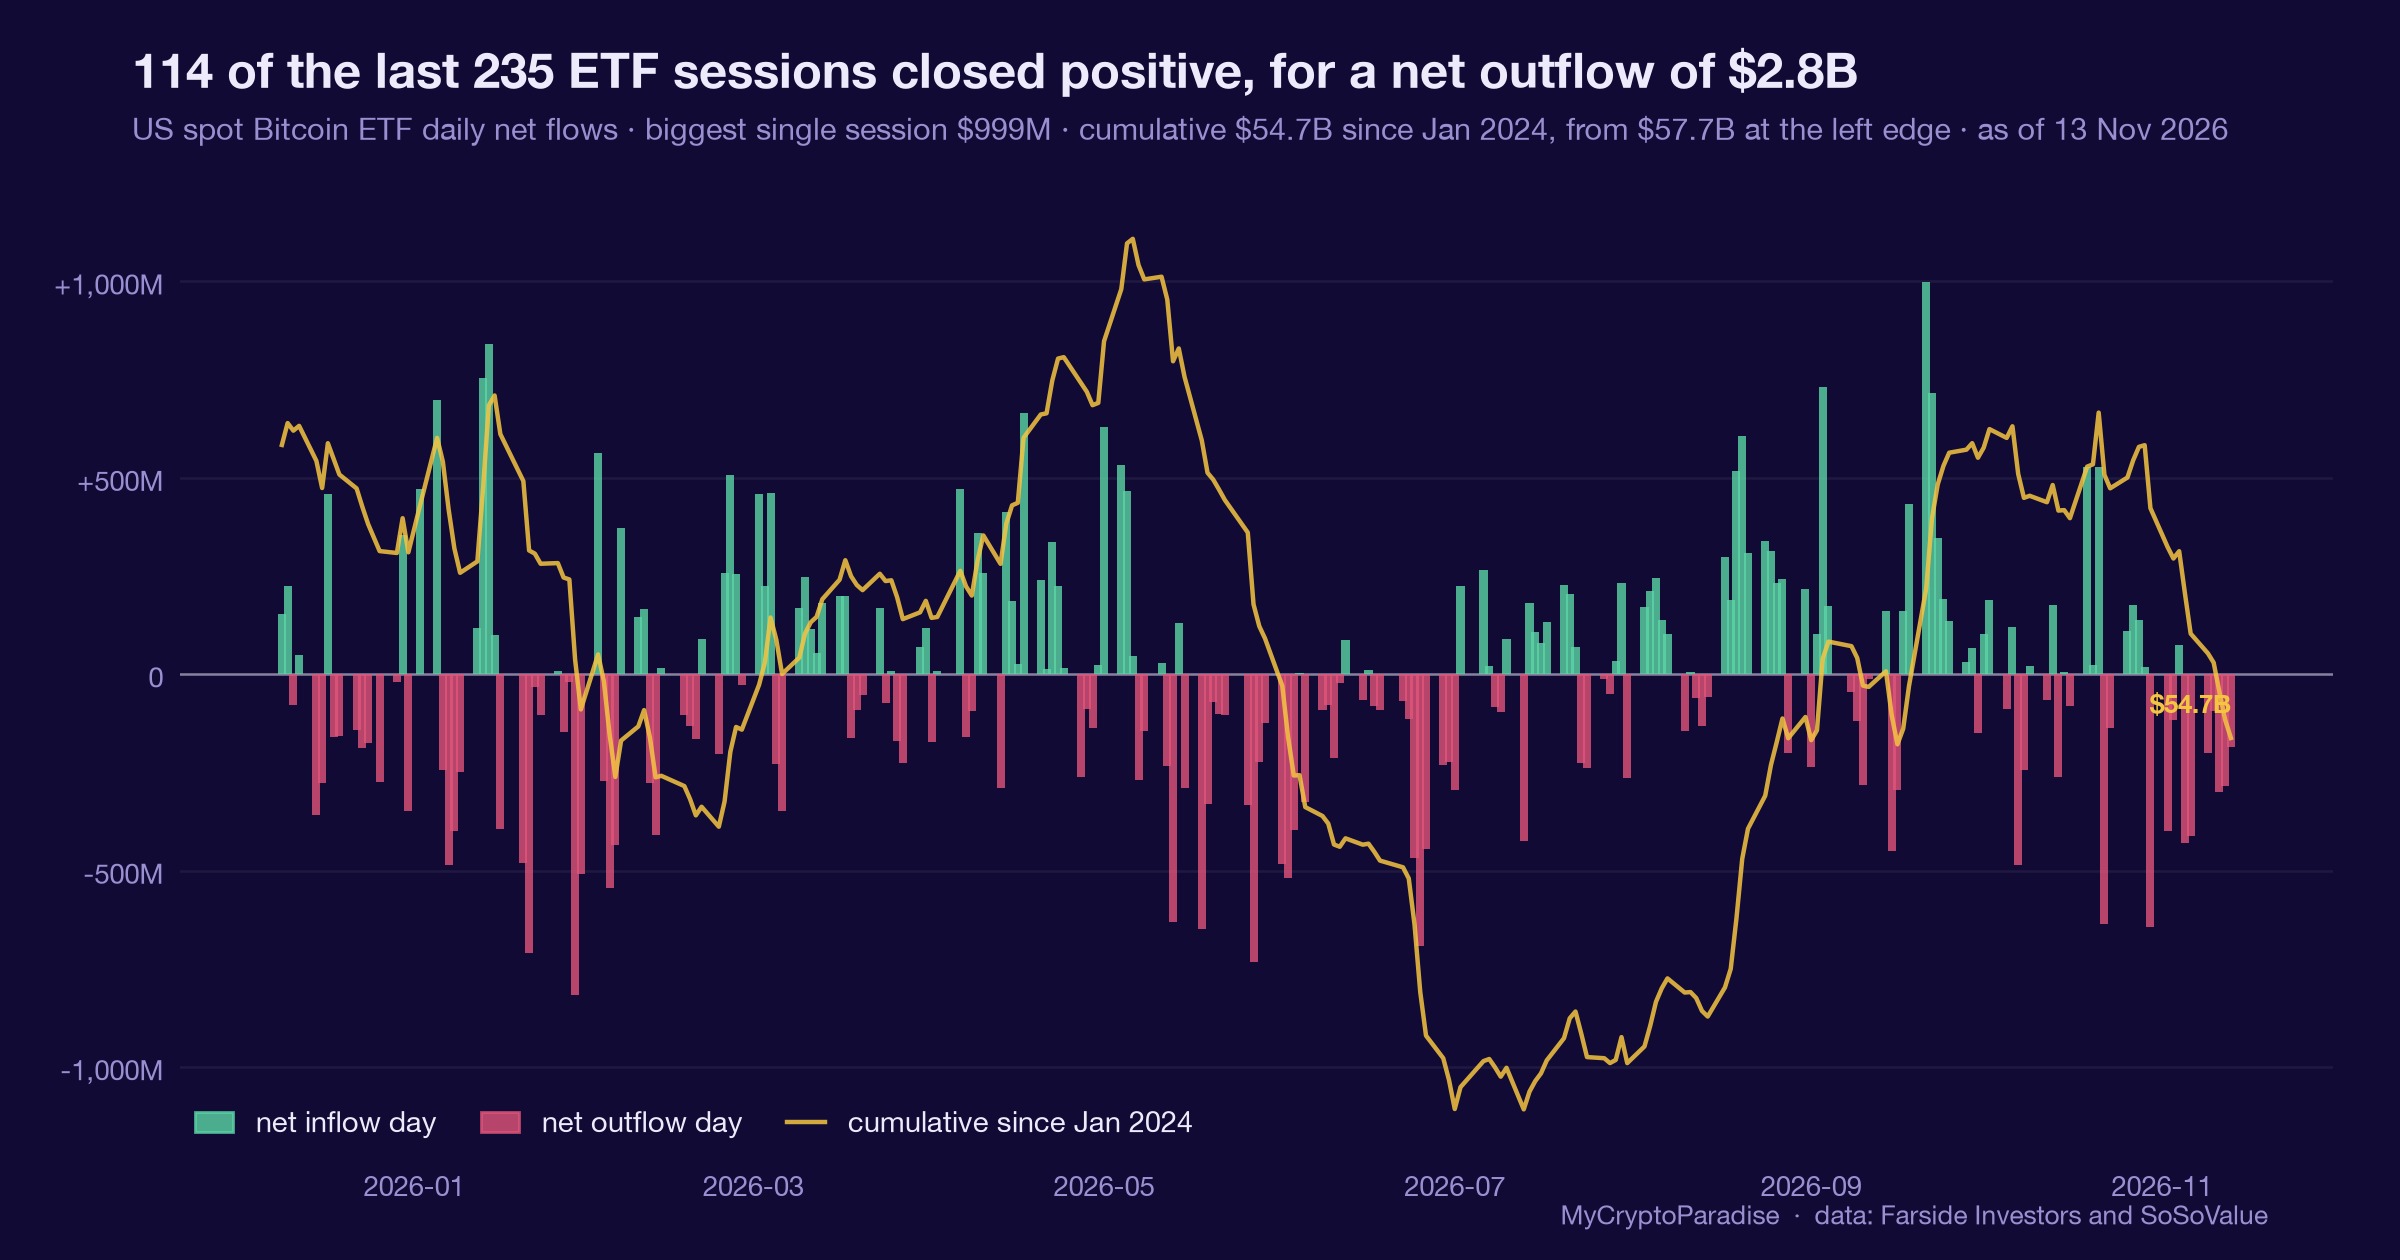
A spot Bitcoin exchange-traded fund (ETF) flow is the net dollar amount created or redeemed across the US funds in a session: money entering or leaving the wrapper. On 13 November 2026 the funds shed a net $185.5 million, our recon reading, a seventh straight outflow day. The 30-day net sits at minus $2,322.3 million. We call this defensive, not a top: the weekly pace actually cooled, minus $1,065.5 million against the prior week’s minus $1,281.7 million. Our 7 November defensive read has held, though it has not timed anything. The tide gauge reads a 17 percent outflow impulse and assigns no grade and no edge: a little better than even. Base rates are not wired here, and the flow carries a model-estimate flag, so we quote no frequency. This piece shows you how to read ETF flows yourself, deceleration and all.
Key facts
- Latest session net flow
- -$185.5M
- Net flow over the last five sessions
- -$1.07B
- Cumulative net flow since January 2024
- $54.70B
- What would prove this read wrong
- A positive flow week that lifts the 30-day net back above zero, or the Coinbase premium turning decisively US-led while the streak breaks to inflow.
- Reading taken
- 13 November 2026
- Source
- Our MCP Insights tools, from Farside Investors and SoSoValue. Upstream data published by Farside Investors
A fund flow is a redemption receipt, not a vote
A spot ETF does not express an opinion. It creates shares when authorised participants deliver Bitcoin and redeems them when holders want cash, and the net of those two is the flow we publish.
An outflow means redemptions outran creations: the wrapper handed coins back to the market. That is selling pressure with a paper trail, which is rarer than it sounds.
A flow is the one sell most of the market cannot hide. The receipt is the whole of its value.
Seven outflow days, but a lighter week than the last
Per our MCP Insights ETF recon, 13 November 2026 marked a seventh consecutive outflow day: a net minus $185.5 million, with BlackRock’s IBIT down $143.5 million, Fidelity’s FBTC down $41.9 million and the Grayscale Mini fund down $52.6 million.
The week of 9 to 13 November lost a net $1,065.5 million. That is heavy, yet lighter than the prior week’s minus $1,281.7 million, and the 30-day net reads minus $2,322.3 million, our recon figure.
IBIT carries most of it: a 30-day net of minus $1,430.3 million, and per the source feed roughly $2.21 billion redeemed since 30 October. Spot sat near $64,000 with the five-session return at minus 14.87 percent.
Flow and price fell together, so there is no divergence to exploit: just a heavy tape that is not hiding anything.
What is different here
The ParadiseTeam does not read a flow streak as a mood. We separate the slope from the level: the 30-day net tells you the regime, while the week-over-week change tells you whether the selling is accelerating or tiring, and only the second one is new information today.
IBIT is doing the selling, not the small funds
The streak is not broad-based panic across every issuer. It is concentrated: BlackRock’s IBIT accounts for the bulk, a 30-day net near minus $1,430.3 million against a fund that still holds the largest share by a wide margin.
Redemptions at that scale are rarely retail clicking sell. They are the authorised participants and the large allocators trimming, which means the flow is an institution-sized decision printed in public.
When one fund carries the whole streak, the question is not sentiment. It is who at that fund decided to leave, and why.
A seventh red day is not a capitulation bottom
The obvious misread is to treat a long outflow streak as a contrarian buy: everyone has sold, so the low is in. The flow data does not support that leap.
Our tide gauge puts the outflow impulse at just 17 percent and refuses to grade it, calling the state a little better than even. The redemptions are persistent but not violent, and persistence is the opposite of a flush.
This is one input. It sits alongside funding, open interest (OI) and the Coinbase premium, and today all three lean the same tired way: funding shows longs paying 1.05 percent a year, and the US premium is flat, with only 2 of the last 22 sessions US-led.
A gauge that admits it has no edge is more useful than one that always finds an edge. Exhaustion is a story; the receipt is still red.
The weekly pace is the tell worth watching
Here is the honest grade. Our 7 November defensive read has not been wrong: seven more outflow days followed, and the 30-day net stayed deep below zero. It also has not been a trade, and we do not pretend it timed anything.
What changed this week is the slope. Outflows shrank week-over-week for the first time in the run, from minus $1,281.7 million to minus $1,065.5 million. A decelerating outflow is not an inflow, and treating it as one is how people buy the third lower high.
The direction has not resolved; the pace has eased. That is worth one line of risk, not a reversal.
Reading the ETF flow tide yourself, step by step
- Start with the single-day net, then ignore it: one session is noise and tells you almost nothing on its own.
- Pull the current streak length and direction, so you know whether today extends a run or breaks one.
- Compare this week’s net against last week’s to read the slope, not just the sign of the flow.
- Check the 30-day net for the regime, and note which single fund is driving the total.
- Cross the flow against funding and the Coinbase premium before you size anything: one metric is a lean, not a verdict.
The step people skip is the week-over-week slope: most read only the sign of the flow and stop, missing that a shrinking outflow says something a growing one does not.
Every number above is checkable against the live data. Start with the Bitcoin ETF flow tracker, then cross-read the MCP Insights hub and the Crypto Fear and Greed Index.
Act and invalidate
| Scenario | What confirms it | What kills it |
|---|---|---|
| Outflows keep tiring | Next weekly net shrinks again | A week heavier than minus $1.28B |
| Streak snaps to inflow | A positive daily net print | Another red day extends the run |
| Flush re-accelerates | Weekly outflow deepens | A positive, US-led premium turn |
Posture: Defensive while the streak and the 30-day net stay negative, with position sizes kept to what a single model-estimate input deserves. The eased weekly pace earns patience, not a long.
Frequently asked questions
What were the Bitcoin ETF flows on 13 November?
Our recon reading shows a net $185.5 million leaving the US spot funds on 13 November 2026, the seventh straight outflow day. BlackRock’s IBIT led the redemptions at $143.5 million, with Fidelity and the Grayscale Mini fund making up most of the rest.
Does a seven-day outflow streak mean a bottom?
Not on its own. A long outflow run can mark exhaustion, but our tide gauge puts the impulse at only 17 percent and assigns no edge, calling it a little better than even. Persistent selling is not the same as a violent flush that clears sellers.
Why does the weekly pace matter more than the daily number?
A single session is mostly noise. The week-over-week change shows whether selling is accelerating or tiring: this week lost $1,065.5 million against the prior week’s $1,281.7 million, so the outflow is shrinking. That slope, not the daily print, is the new information.
Which fund is driving the ETF outflows?
BlackRock’s IBIT carries most of the streak, with a 30-day net near minus $1,430.3 million. Redemptions at that scale usually reflect large allocators trimming rather than retail selling, which makes the flow an institution-sized decision printed openly in the tape.
Is this a reason to sell Bitcoin?
This is one input, not a verdict. The flow leans defensive while outflows and the 30-day net stay negative, and it would start to turn if a positive week lifted that net back toward zero. We quote no probability, since base rates are not wired and the flow carries a model-estimate flag.
Crypto trading involves substantial risk and is not suitable for everyone. Nothing here is financial advice; it is education only. Never risk more than you can afford to lose.
The private Extras feed, where the ETF flow tide, the weekly outflow slope and the fund-by-fund split, each with its invalidation level, is part of PRO Paradiser, the intelligence layer behind the ParadiseFamilyVIP strategies.












Join the discussion
No comments yet. Members, share how you are reading this.