

In short
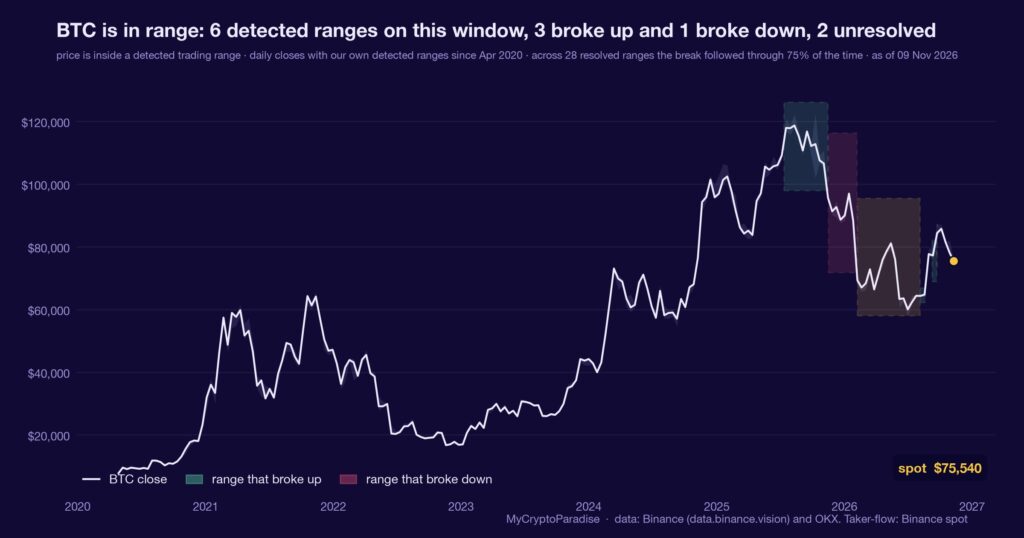
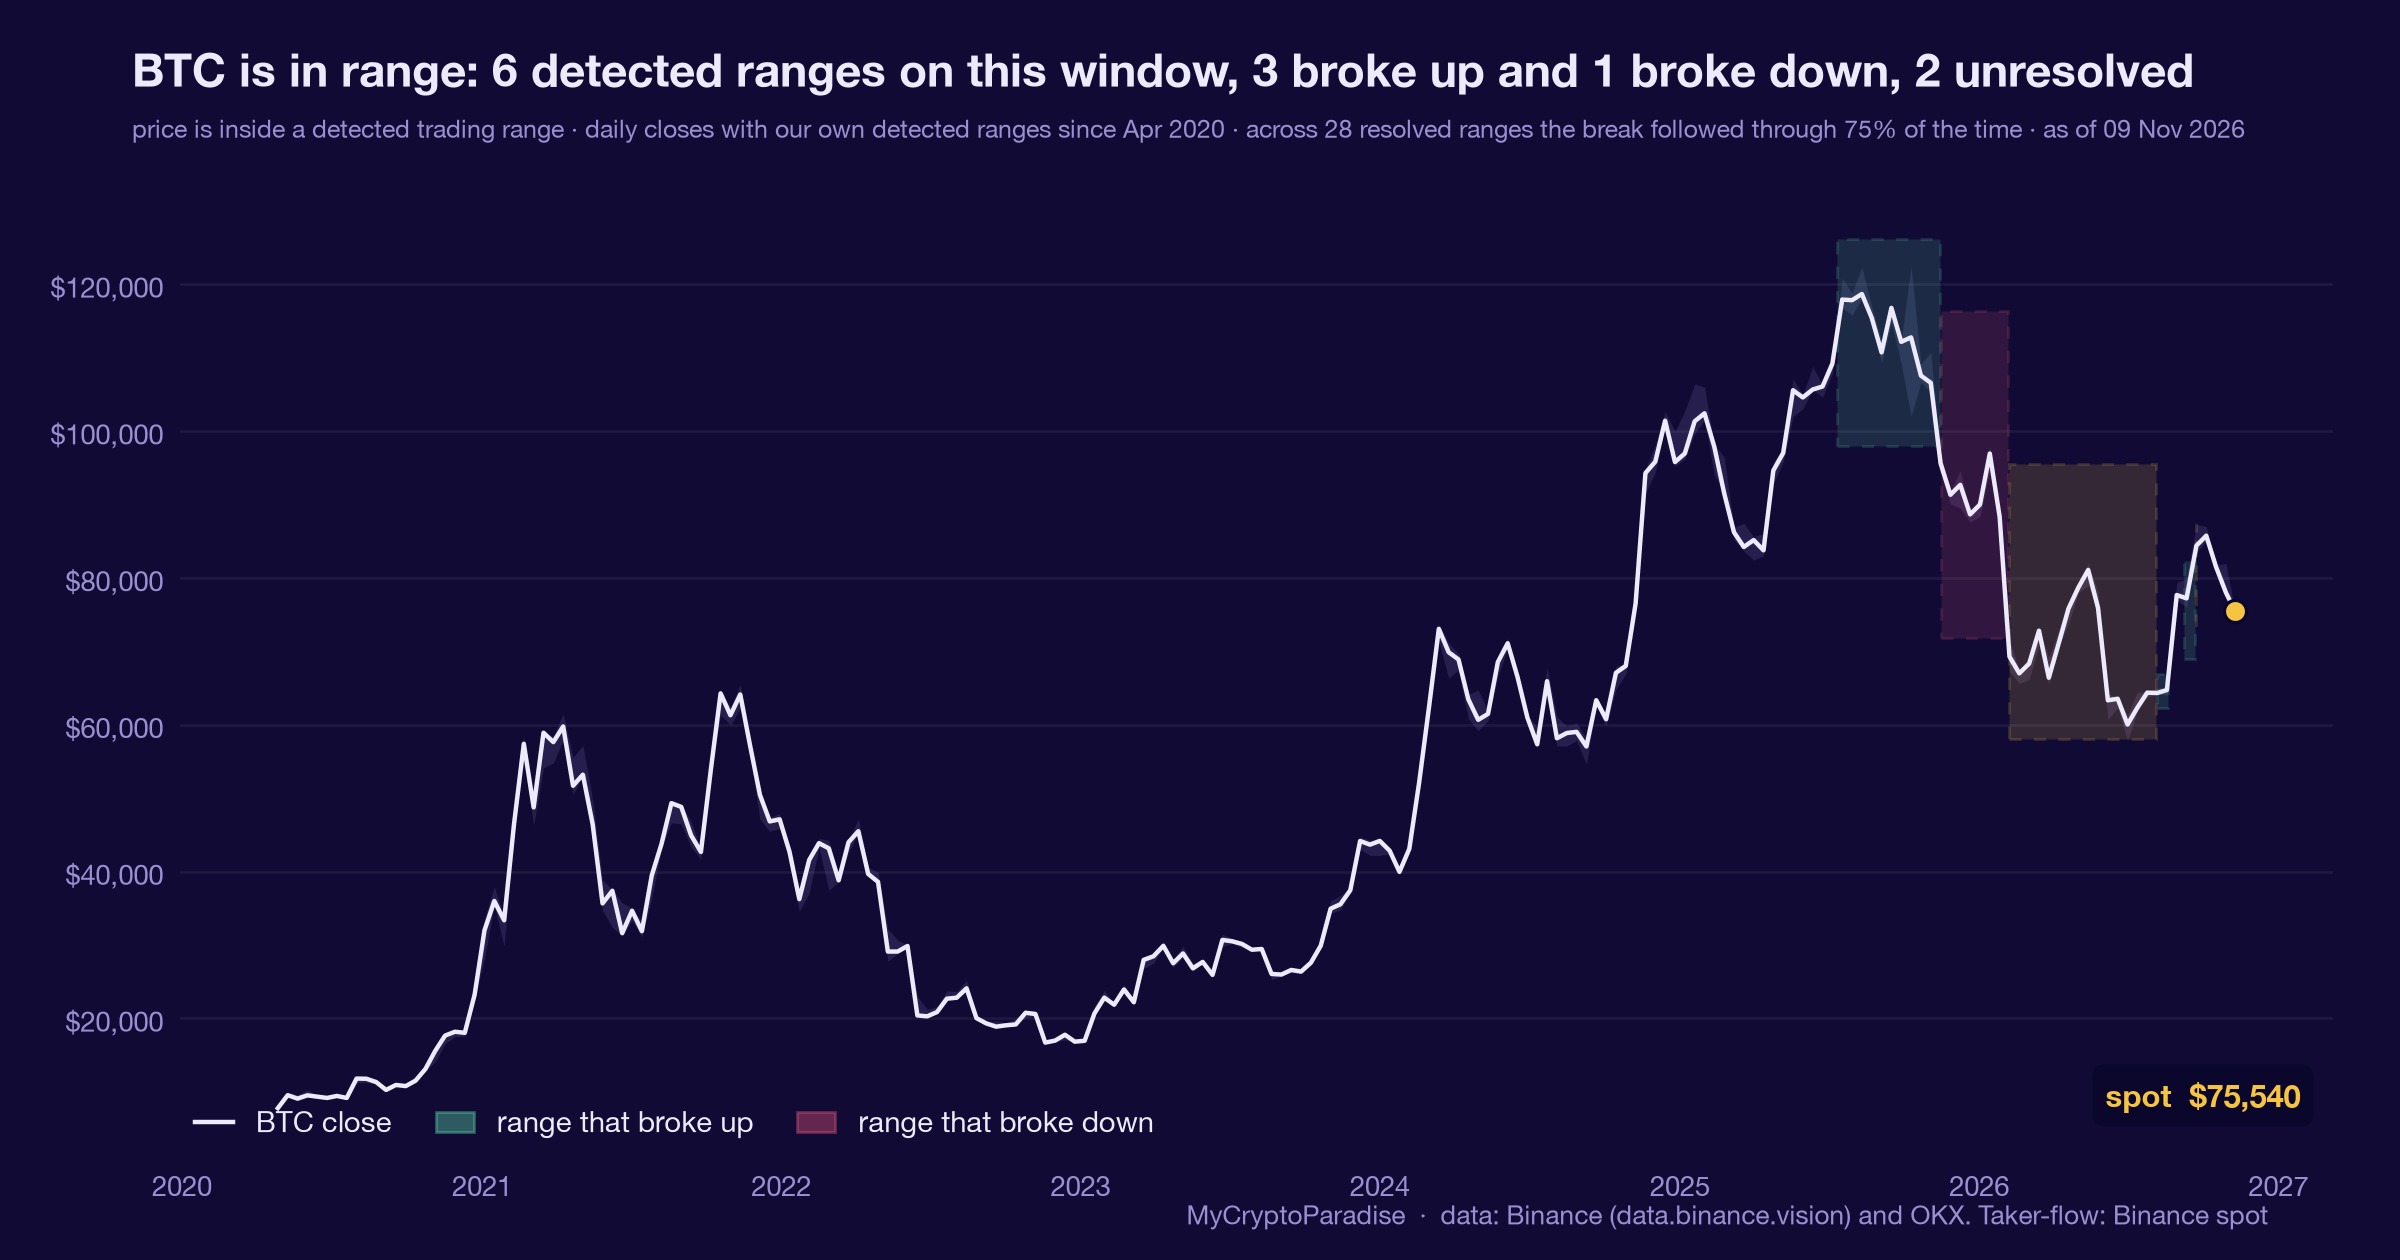
A liquidation tally counts the leveraged positions that exchanges forcibly closed, sorted into longs and shorts, so it shows who was actually forced out rather than who merely chose to sell. On 9 November 2026, with BTC near $75,540 on our MCP Insights range model and the source feed calling sellers in control, our own 24-hour tally reads $42.7M of short liquidations against $23.6M of longs, a 64 to 36 split on a thin $66.3M total. We called this neutral, not a downside lean: the forced flow leans against the sellers even as spot demand stays absent. Our 5 November range-floor read leaned constructive, and price has since slipped from $76,084 toward the lower edge, so that lean is on probation. The series is a model estimate with no calibrated rate wired, so we quote no frequency. This piece shows you how to read a liquidation tally yourself, line by line.
Key facts
- BTC price at the reading
- $75,540
- Range state
- price is inside a detected trading range
- Top of the current detected range
- $87,399
- Bottom of the current detected range
- $74,956
- What would prove this read wrong
- A daily close below the lower range edge at $74,955.5, or longs overtaking shorts in the 24-hour liquidation tally while spot demand stays absent.
- Reading taken
- 09 November 2026
- Source
- Our MCP Insights tools, from Binance (data.binance.vision) and OKX. Taker-flow: Binance spot. Upstream data published by Binance public market data
Forced sellers are not the same as sellers
A liquidation tally measures something narrower than selling pressure. It counts only the leveraged positions an exchange closed by force, when margin ran out and the position had no say in the matter.
Cumulative volume delta (CVD), the running difference between aggressive buying and aggressive selling, tells you who leaned on the tape. A liquidation tally tells you who got carried off it. The two can point in opposite directions.
A market can fall while its shorts are the ones being stopped out. Who chose to sell and who was forced to buy back are different questions, and only one of them is about pain.
The 9 November reading cuts against the sellers
On 9 November 2026 our MCP Insights range model puts BTC at $75,540, inside the band it confirmed on 22 September, whose lower edge sits at $74,955.5 and whose ceiling is $87,399. Price is pressed against that floor.
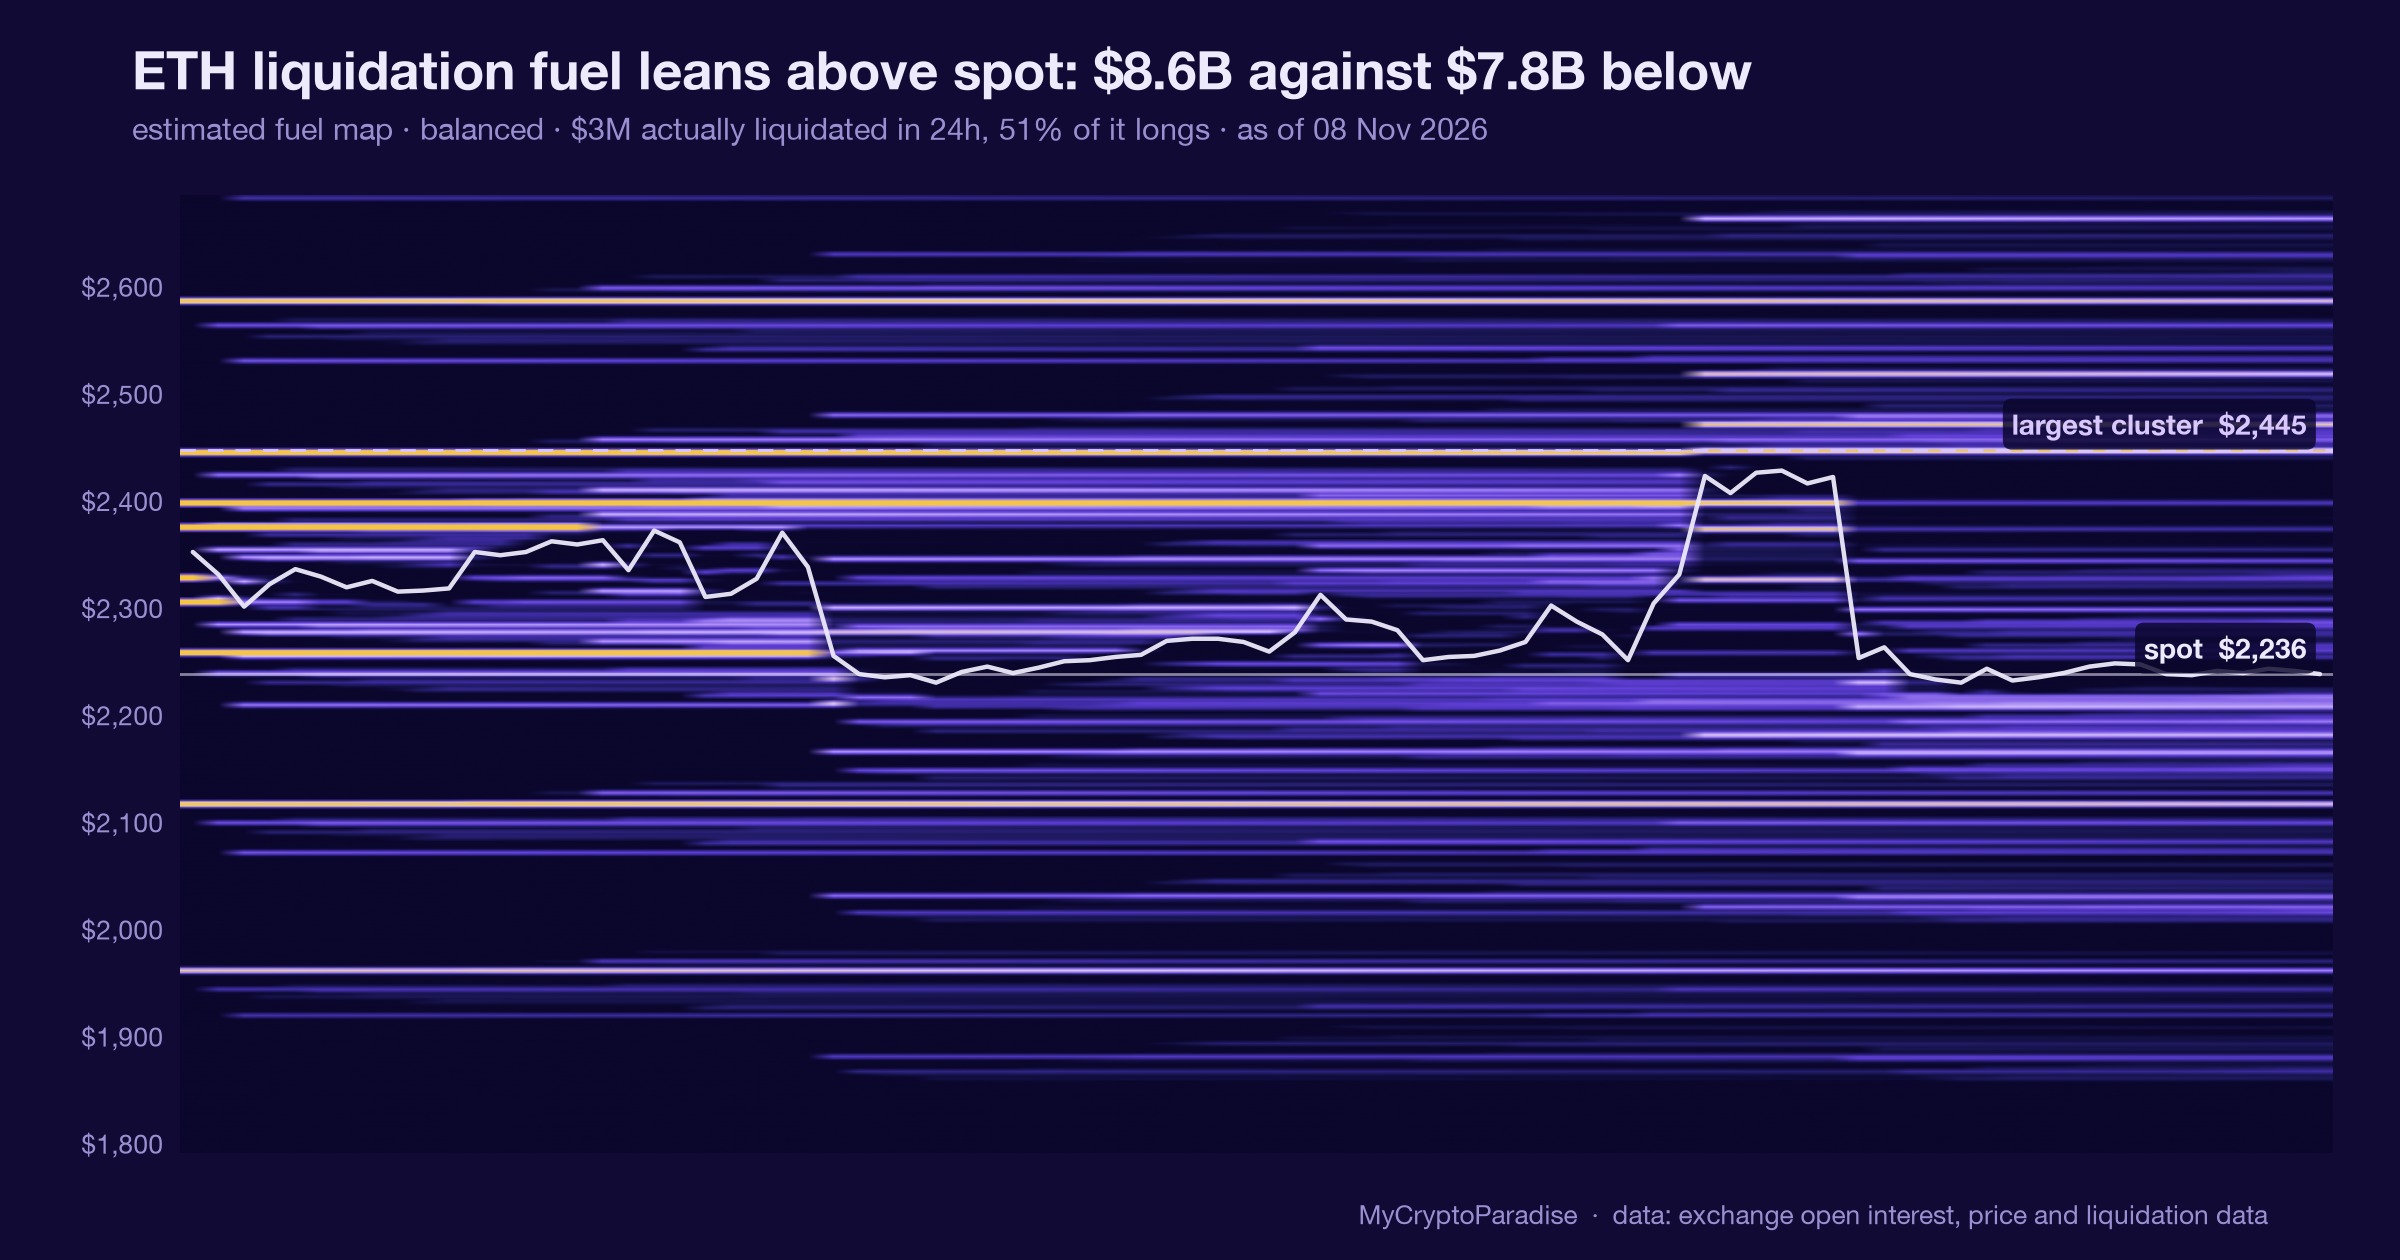
Per our MCP Insights liquidation data, the past 24 hours forced out $42.7M of shorts against $23.6M of longs: a 64 to 36 split on a $66.3M total. The resting fuel map still leans upside, $19.95B above spot against $11.82B below, about 1.7 to 1.
The source feed reports the opposite tone on flow: futures CVD at minus $5.29B against spot CVD at minus $378.9M, with futures selling far outweighing spot. We cannot verify those two figures in our own series, so we flag them as the feed’s.
So the flow leans down and the forced book leans up. A reading that only quotes the half that agrees with the headline is decoration: the disagreeing half is what sizes the risk.
What is different here
The ParadiseTeam separates forced flow from chosen flow before reading a level. Most takes merge every red candle into one bucket of selling pressure: we split the tape’s sellers from the margin calls, because a market whose shorts are being liquidated into a decline is telling a different story than one where longs capitulate.
The obvious short read ignores who is bleeding
The tempting read is linear: sellers in control, price at the lows, so press it. That read ignores that the leverage being punished over the last day belonged to shorts, not longs, by nearly two to one.
Shorts covering into a decline can accelerate it or cap it, depending on who meets them. The tally alone cannot tell you which, and anyone reading it as a bottom is borrowing certainty the $66.3M print does not carry.
This is one input. It sits alongside the range structure, the resting fuel map and the flow tape, and today it is the one that disagrees with the ‘sellers in control’ framing. On its own it is a lean, not a verdict.
A day’s forced flow can temper a one-sided story without reversing it. Tempering and turning are different claims, and only one of them needs this little evidence.
Spot demand is the missing confirmation
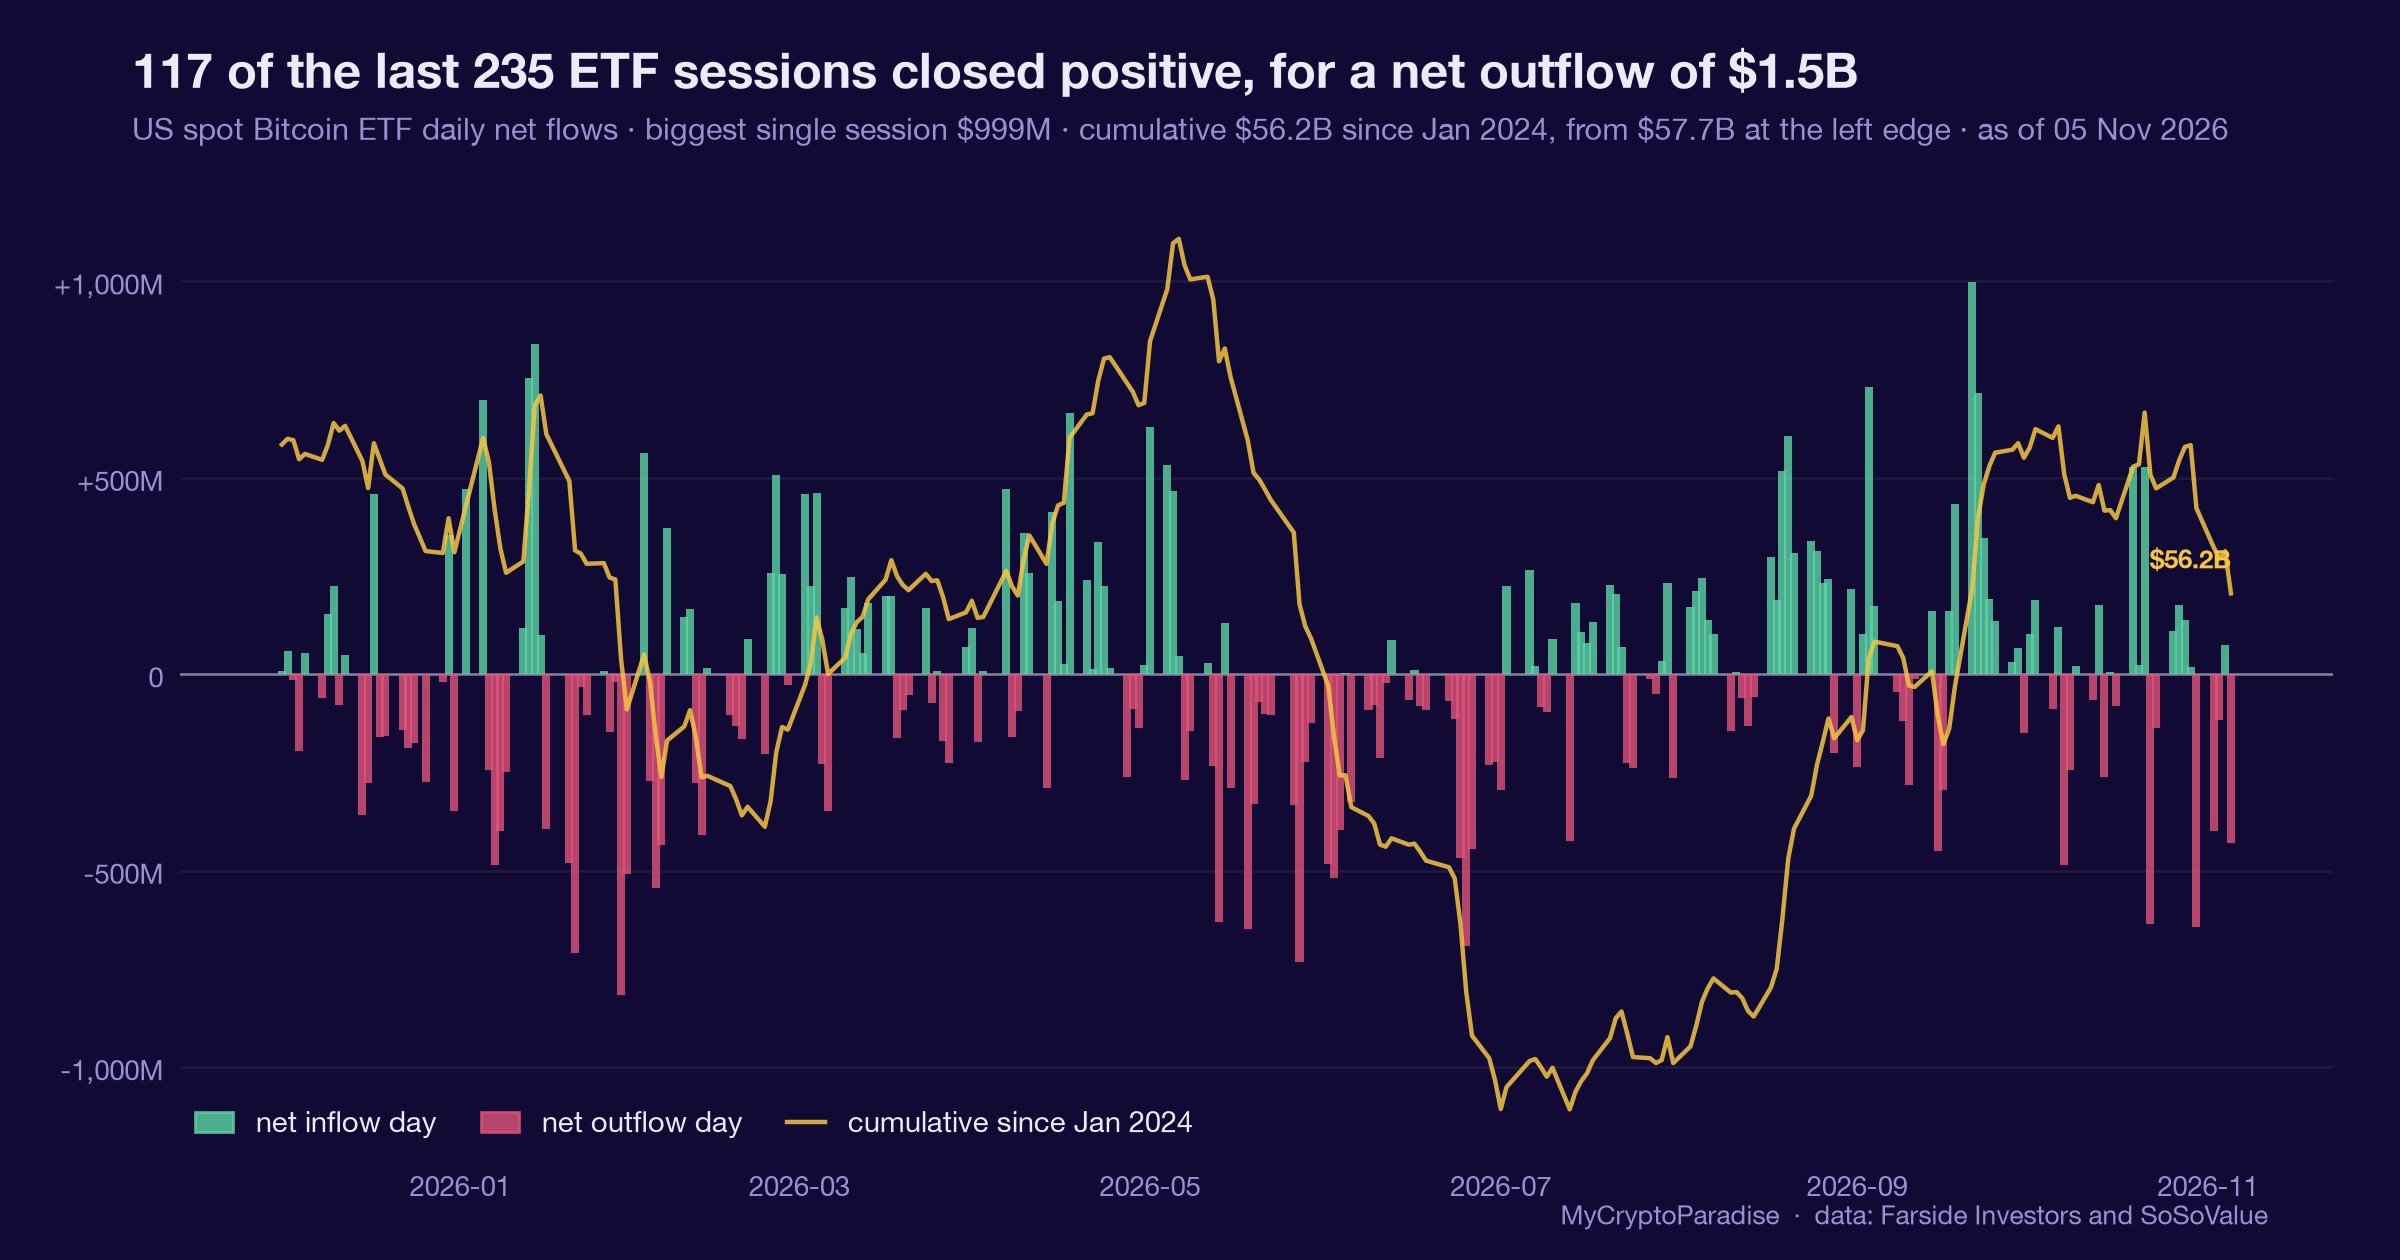
The forced book leaning short only matters if real buyers step in behind it. So far they have not. The source feed’s spot selling, though far smaller than its futures figure, is still negative, which means cash markets are not yet absorbing the decline.
That is the asymmetry worth stating plainly: leverage is being punished on the short side, but spot has not turned. A squeeze needs both the trapped positioning and the fresh demand to run it over, and today only the first is present.
Trapped shorts are fuel. Fuel does not ignite itself: without a buyer willing to light it, a lopsided tally stays a condition and never becomes a move.
What this read owes you next
We will not pretend this resolves. No calibrated base rate is wired for range-floor defenses, and both the range and liquidation series carry a model-estimate flag, so we attach no historical frequency to any of it.
Our 5 November read leaned constructive on the same floor, built on spot demand absorbing futures selling. Since then spot demand has not followed through and price has drifted from $76,084 toward the $74,955.5 edge. That lean is now on probation, and we are saying so here rather than quietly dropping it.
A read that grades itself in public, including the half that is not working, is worth more than one that only resurfaces when it happened to be right.
Reading a liquidation tally yourself, step by step
- Pull the 24-hour liquidation total and split it into longs and shorts before you read any price chart.
- Compare the two sides: the larger number names the leverage that was just forced to cover, not the direction of the trend.
- Check the total size against recent days; a figure in the low tens of millions is a whisper, not a capitulation.
- Lay the tally against the flow tape, so chosen selling and forced buying sit side by side rather than blurring together.
- Mark the range edge that would break the read, and watch for longs overtaking shorts, which is what tells you the balance has turned.
Most people skip the size check and treat any liquidation print as a reversal. A $66.3M day moves nothing on its own: scale tells you whether the tally even matters.
Every number above is checkable against the live data. Start with the MCP Insights hub, then cross-read the Crypto Fear and Greed Index and the live crypto funding rates.
Act and invalidate
| Scenario | What confirms it | What kills it |
|---|---|---|
| Floor holds, shorts keep covering | Longs stay the smaller side | Daily close below $74,955.5 |
| Grind lower resumes | Longs overtake shorts in the tally | Reclaim of $77,000 to $78,000 |
| Range chop continues | Price stays $75K to $76K | Break of either range edge |
Posture: Defensive and patient. The forced book leans against the sellers, but spot demand is absent and the floor is close, so this sizes a lean rather than a position.
Frequently asked questions
What does a liquidation tally actually measure?
It measures the dollar value of leveraged positions that exchanges closed by force over a window, split into longs and shorts. It captures forced exits only, so it says nothing about traders who chose to sell while still solvent.
Why are shorts being liquidated in a falling market?
Price can grind lower while sharp upticks stop out shorts that entered too early or too tight. Over the past 24 hours those upticks forced $42.7M of shorts against $23.6M of longs, even as the broader tone stayed heavy.
Does this mean the bottom is in for Bitcoin?
No. A thin forced-flow day tempers a one-sided story without reversing it. The range floor at $74,955.5 still has to hold, and spot demand has not yet shown up to confirm any turn.
What level invalidates this neutral read?
A daily close below the lower range edge at $74,955.5 breaks the structure the read rests on. The opposite confirmation is longs overtaking shorts in the tally while price holds its current $75K to $76K zone.
How much should one liquidation reading move my risk?
Very little on its own. It is one input among the range structure, the resting fuel map and the flow tape, and today it merely disagrees with the headline. Treat it as a weight, not a decision.
Crypto trading involves substantial risk and is not suitable for everyone. Nothing here is financial advice; it is education only. Never risk more than you can afford to lose.
The private Extras feed, where the liquidation tally, range model and resting fuel map update intraday with their invalidation levels attached, is part of PRO Paradiser, the intelligence layer behind the ParadiseFamilyVIP strategies.












Join the discussion 3
so the shorts getting 64 percent is what i keep looking at when the floor is near.... does that usually mean people are fighting the move or just getting squeezed out early? trying to learn the pattern here, still new to reading these
honestly teh bit that gets me is i learned the hard way that leverage is just the bookies with better graphics 😤 people see a 64 percent tally and read it as a signal when its mostly a leverage scoreboard 📉
ok but the part that scares me is being the one who gets squeezed right at the floor 😅 got farmed like that in 2021 and still have the screenshot, nobody wants to be the exit liquidity!! 📉