

In short
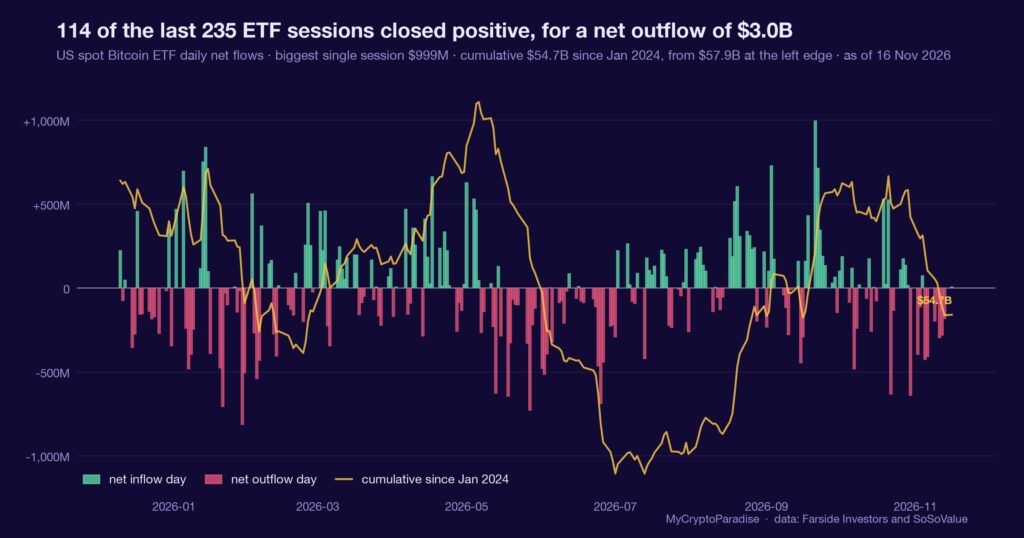
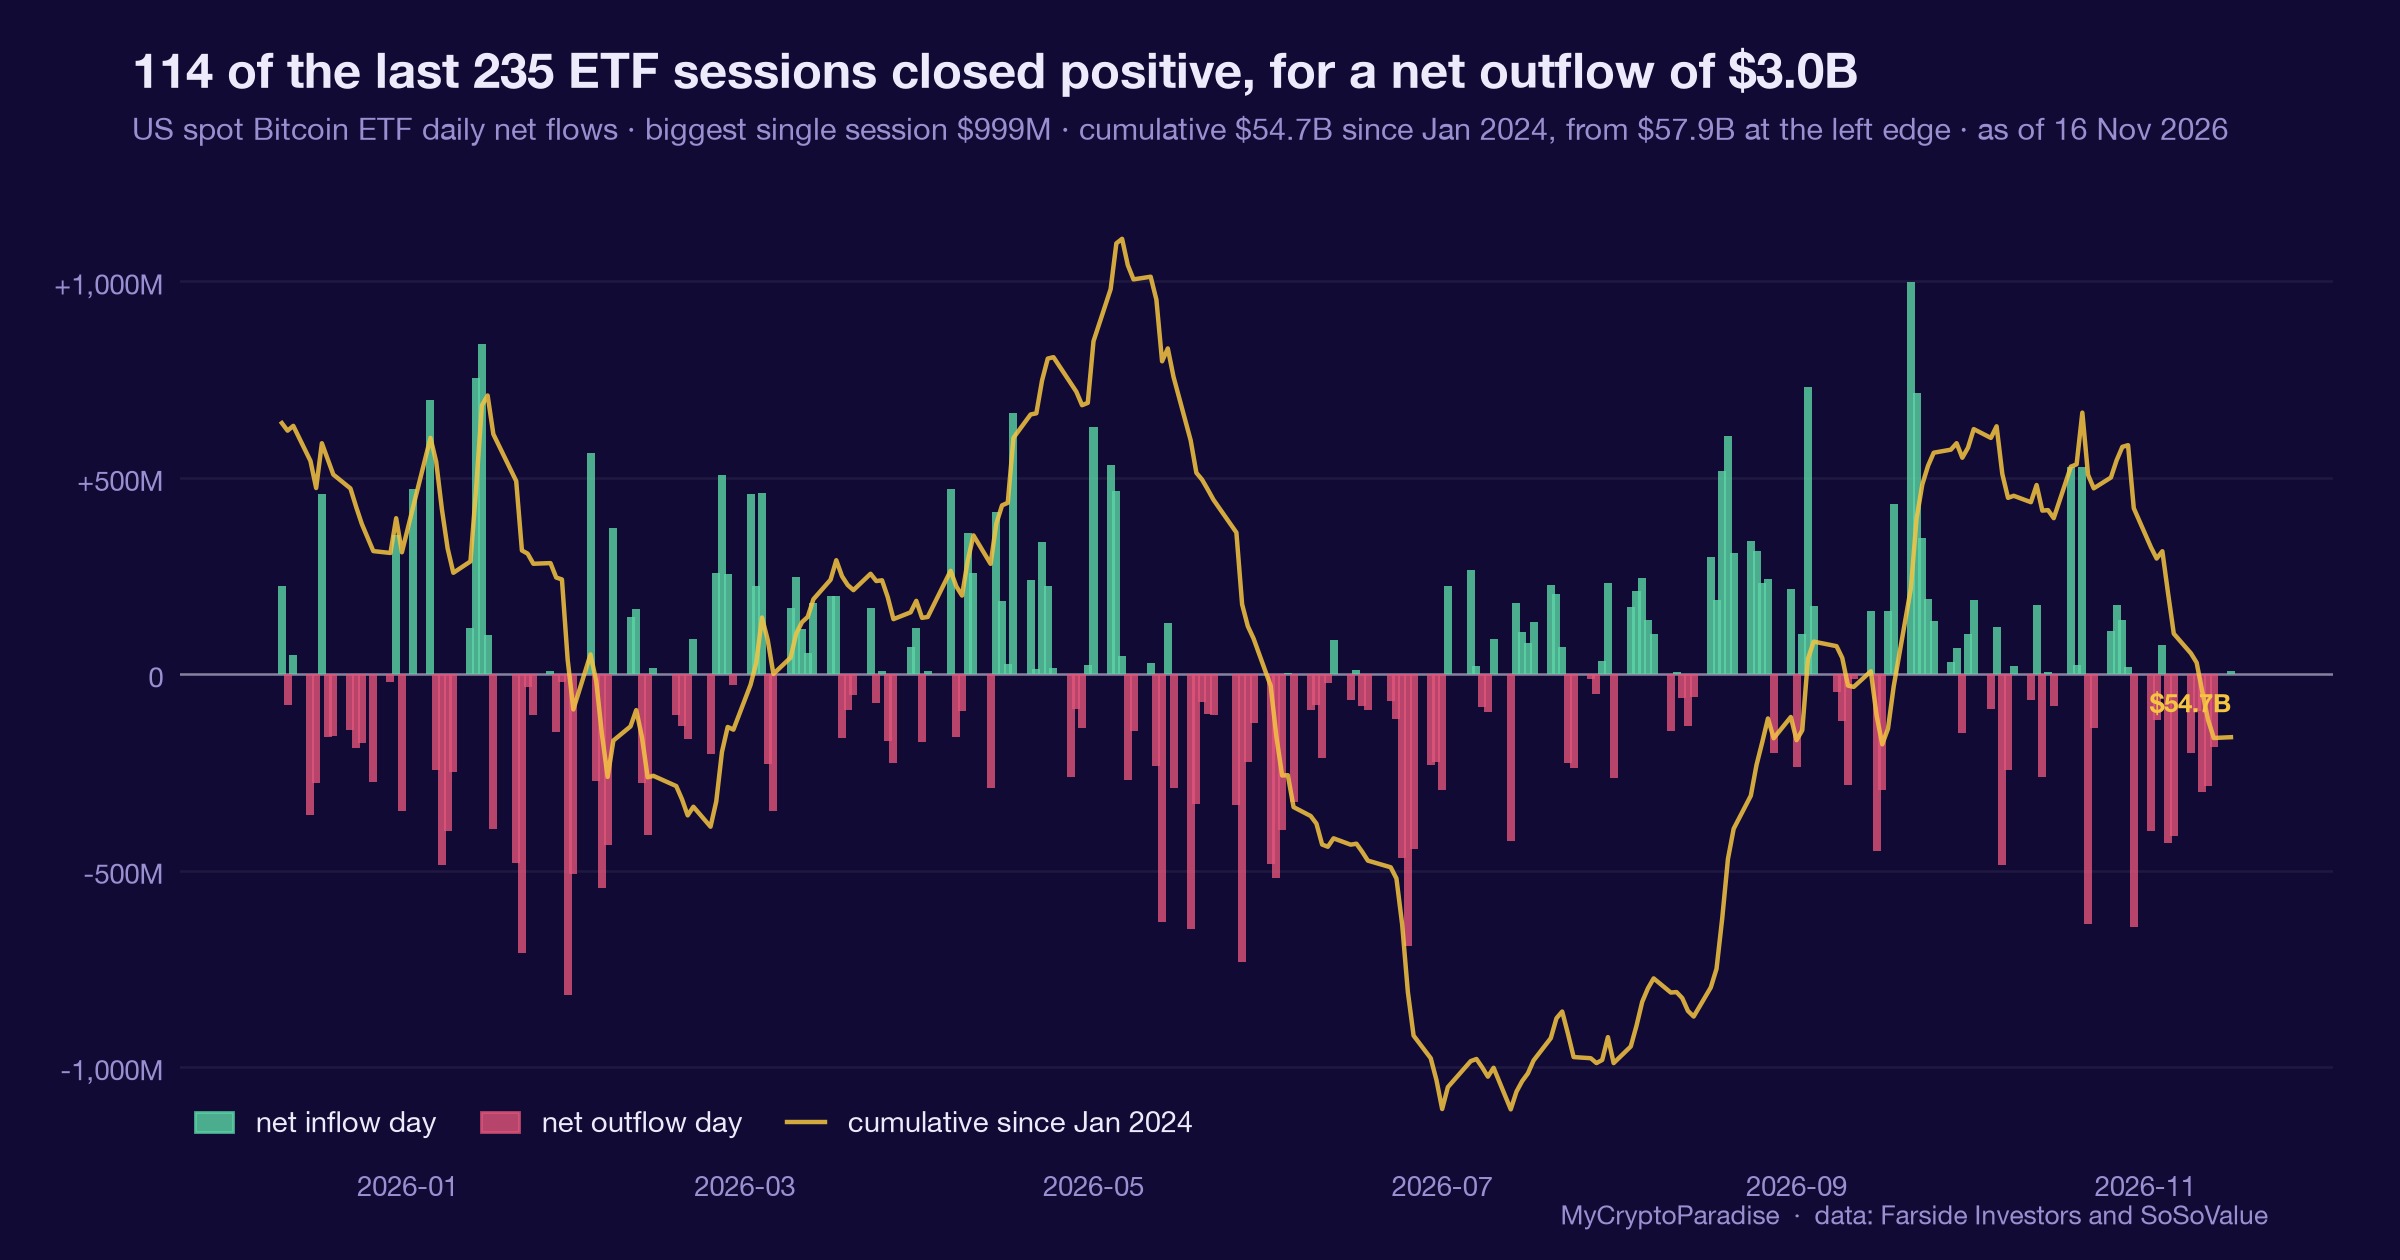
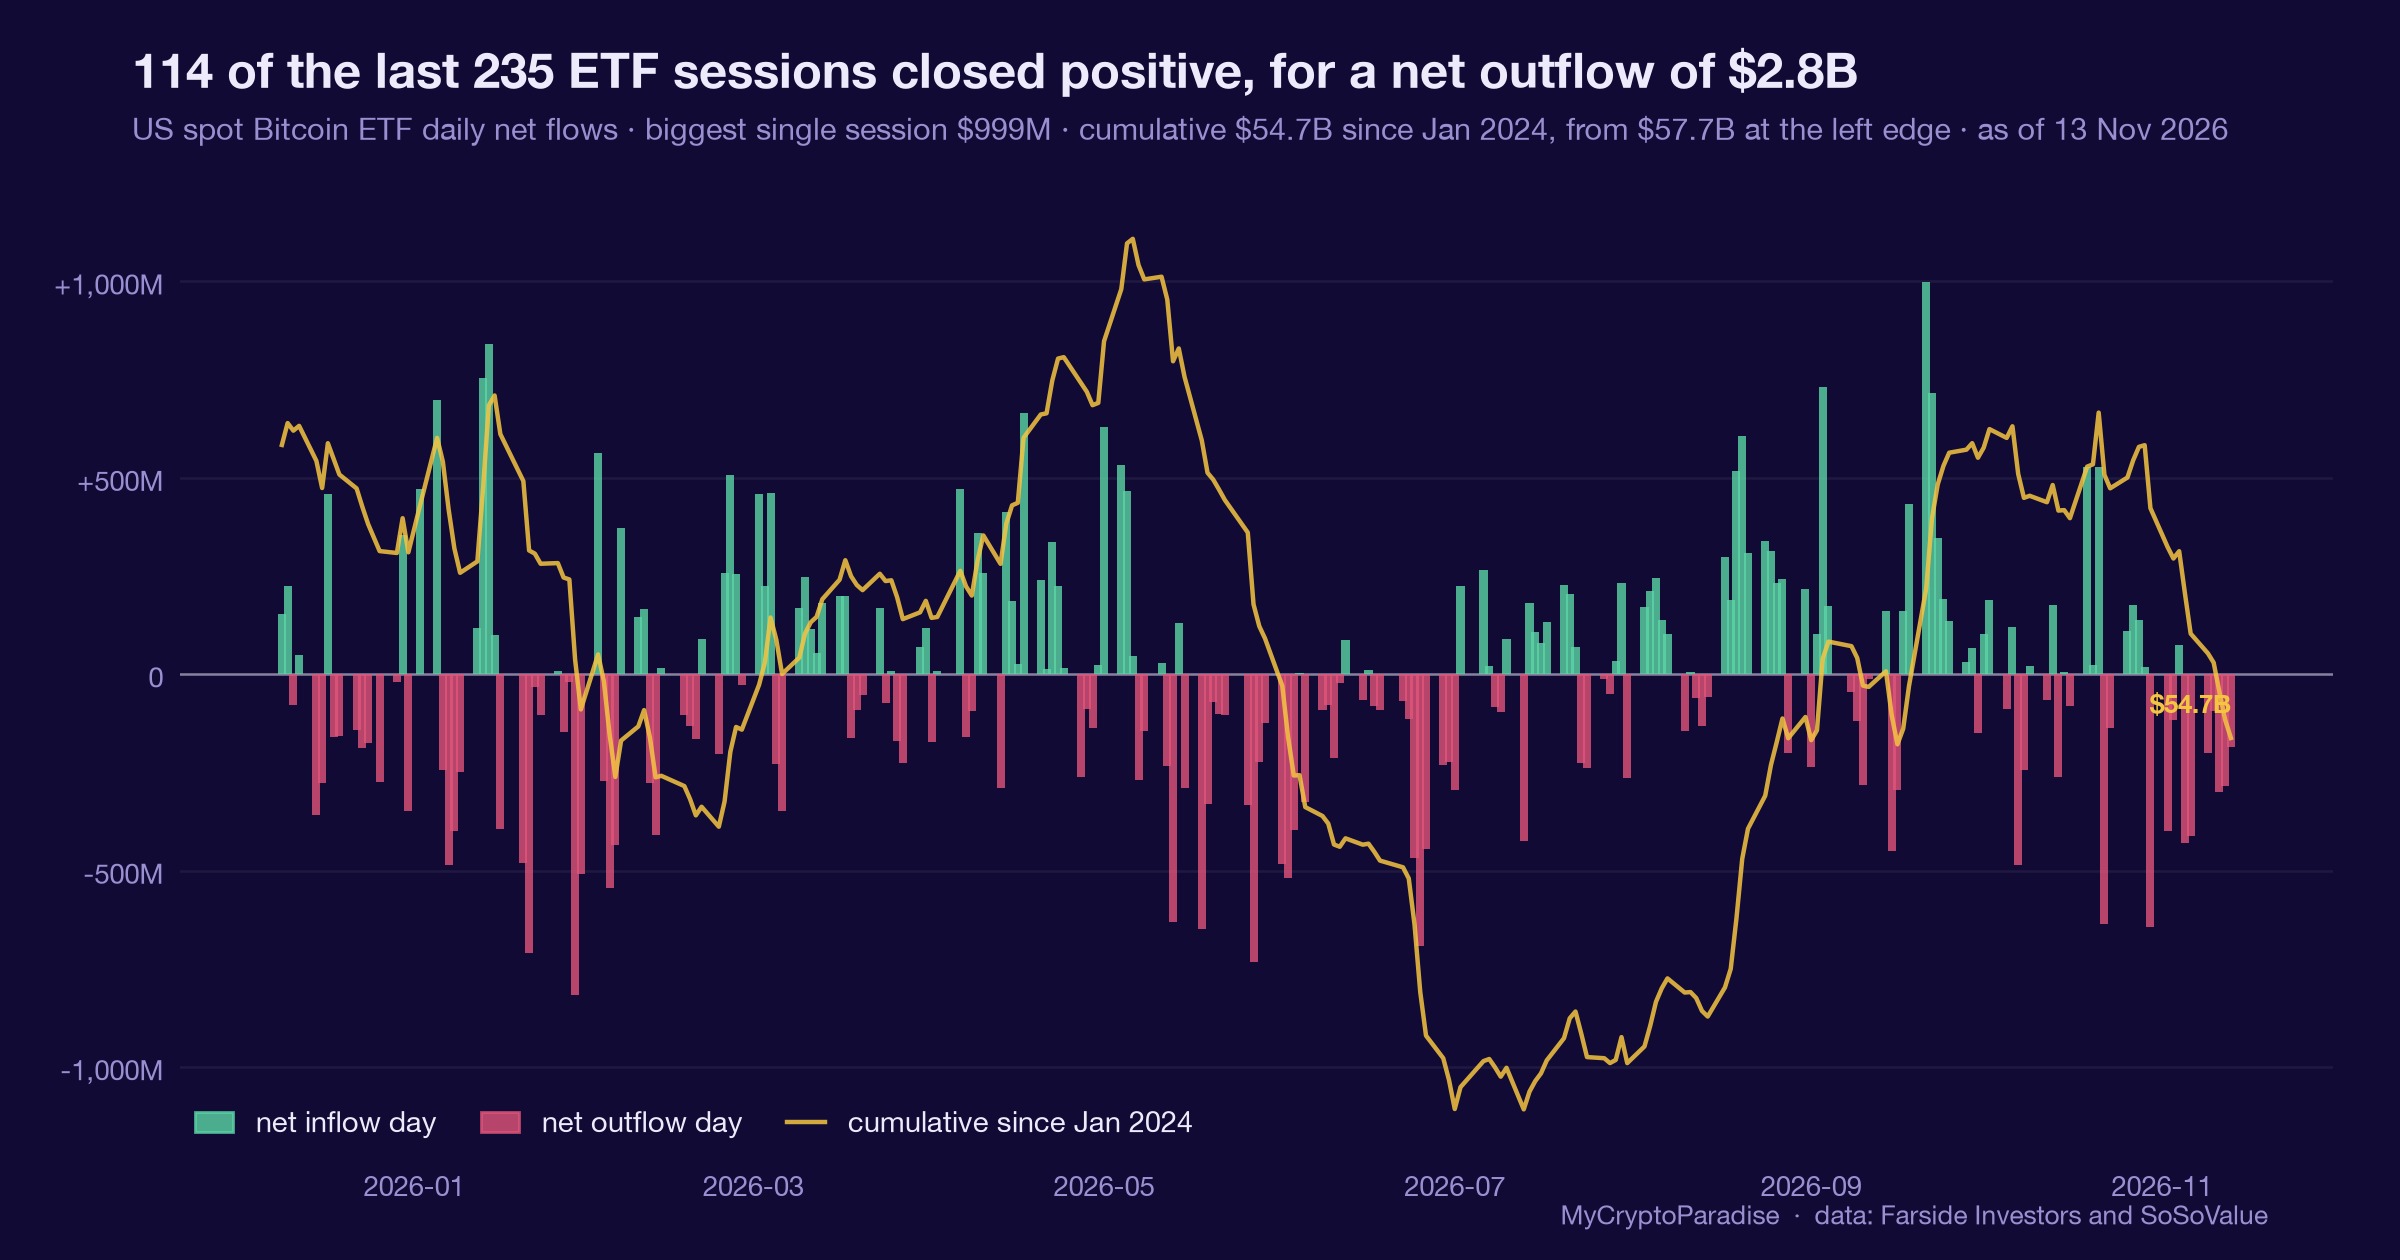
US spot Bitcoin exchange-traded fund (ETF) net flows measure how much money enters or leaves the regulated fund wrappers each session, a clean proxy for institutional demand. Our MCP Insights ETF reading for 16 November 2026 shows a five-day net of minus $856.4 million, an outflow that registers in only the 22nd percentile of impulse while spot price fell 12.35 percent across the same sessions. We read this as neutral with a mild constructive lean, explicitly not a bottom call: a drain this shallow during a sharp drop is holders sitting still, not fleeing. The streak graded our way, flipping to a token plus $8 million inflow on 16 November after seven red sessions. It has also missed before: the 30-day net remains minus $2,237 million, so distribution is cooling, not reversed. This piece shows you how to read ETF flow impulse yourself, percentile and all.
Key facts
- Latest session net flow
- $8.0M
- Net flow over the last five sessions
- -$856.4M
- Cumulative net flow since January 2024
- $54.71B
- What would prove this read wrong
- A return to outflows that pushes the five-day impulse back out of the lower third, or a weekly close dragging the 30-day net below minus $2.2 billion.
- Reading taken
- 16 November 2026
- Source
- Our MCP Insights tools, from Farside Investors and SoSoValue. Upstream data published by Farside Investors
A fund flow is demand with a receipt
A spot Bitcoin ETF holds real coins and issues shares against them, so every creation or redemption moves actual Bitcoin on or off a balance sheet. Net flow is the day’s creations minus its redemptions, converted to dollars. It is the cleanest public trace of regulated demand there is.
What it is not is a vote on price. Flows can drain while price rises and swell while price falls, because the two are set by different crowds at different venues. The wrapper records who showed up, not what they were right about.
A flow number tells you who moved, never whether they were correct. Those are separate questions, and reading them as one is the most common error here.
The 22nd-percentile drain, dated
Per our MCP Insights ETF flow reading, US spot Bitcoin ETFs gave up a net $856.4 million across the five sessions to 16 November 2026. That impulse sits in the 22nd percentile: a little better than even, our own banding, and well short of a violent exit.
The context that reframes it is price. Over the same five sessions spot fell 12.35 percent, yet the wrapper shed under a billion. On 16 November the complex even took in a net plus $8 million, breaking a seven-session outflow streak, led by BlackRock’s IBIT at plus $76.5 million.
The longer window stays heavy. The 30-day net is minus $2,237 million, the prior week ran minus $1,065.5 million, and IBIT alone has shed $1,298.8 million over 30 days. This reading carries a model-estimate flag that has not cleared its calibration gate, so we quote it as our recon reading, not a calibrated rate.
A single green day inside a red month is data, not deliverance. The streak flipped; the season has not.
What is different here
The ParadiseTeam does not read a flow number in isolation: we convert the day’s dollars into a percentile against the series’ own history, then weigh that impulse against price, the Coinbase premium and funding. The method is ranking the drain, not reacting to its headline size.
The loud story was the streak, not the size
The obvious misread is to price the seven-day outflow streak as capitulation. A streak counts days, not dollars, and seven small red sessions summed to a drain our own banding calls mild. The magnitude never matched the narrative.
Weigh the two against the tape instead. A 12.35 percent price slide usually drags frightened money out of the wrapper first; this time redemptions stayed in the lower third of their own range. That is holders declining to sell the fund into weakness, a different posture than panic.
A streak is a headline; an impulse percentile is a measurement. When they disagree, size beats day-count every time.
One gauge among several, and where it sits
This flow read is one input, not a verdict. It sits alongside the Coinbase premium, open interest (OI) and funding, and today it is the one leaning least bearish: our Coinbase premium gauge shows spot trading at a slight US discount, and perp funding runs near 3.93 percent a year with longs paying.
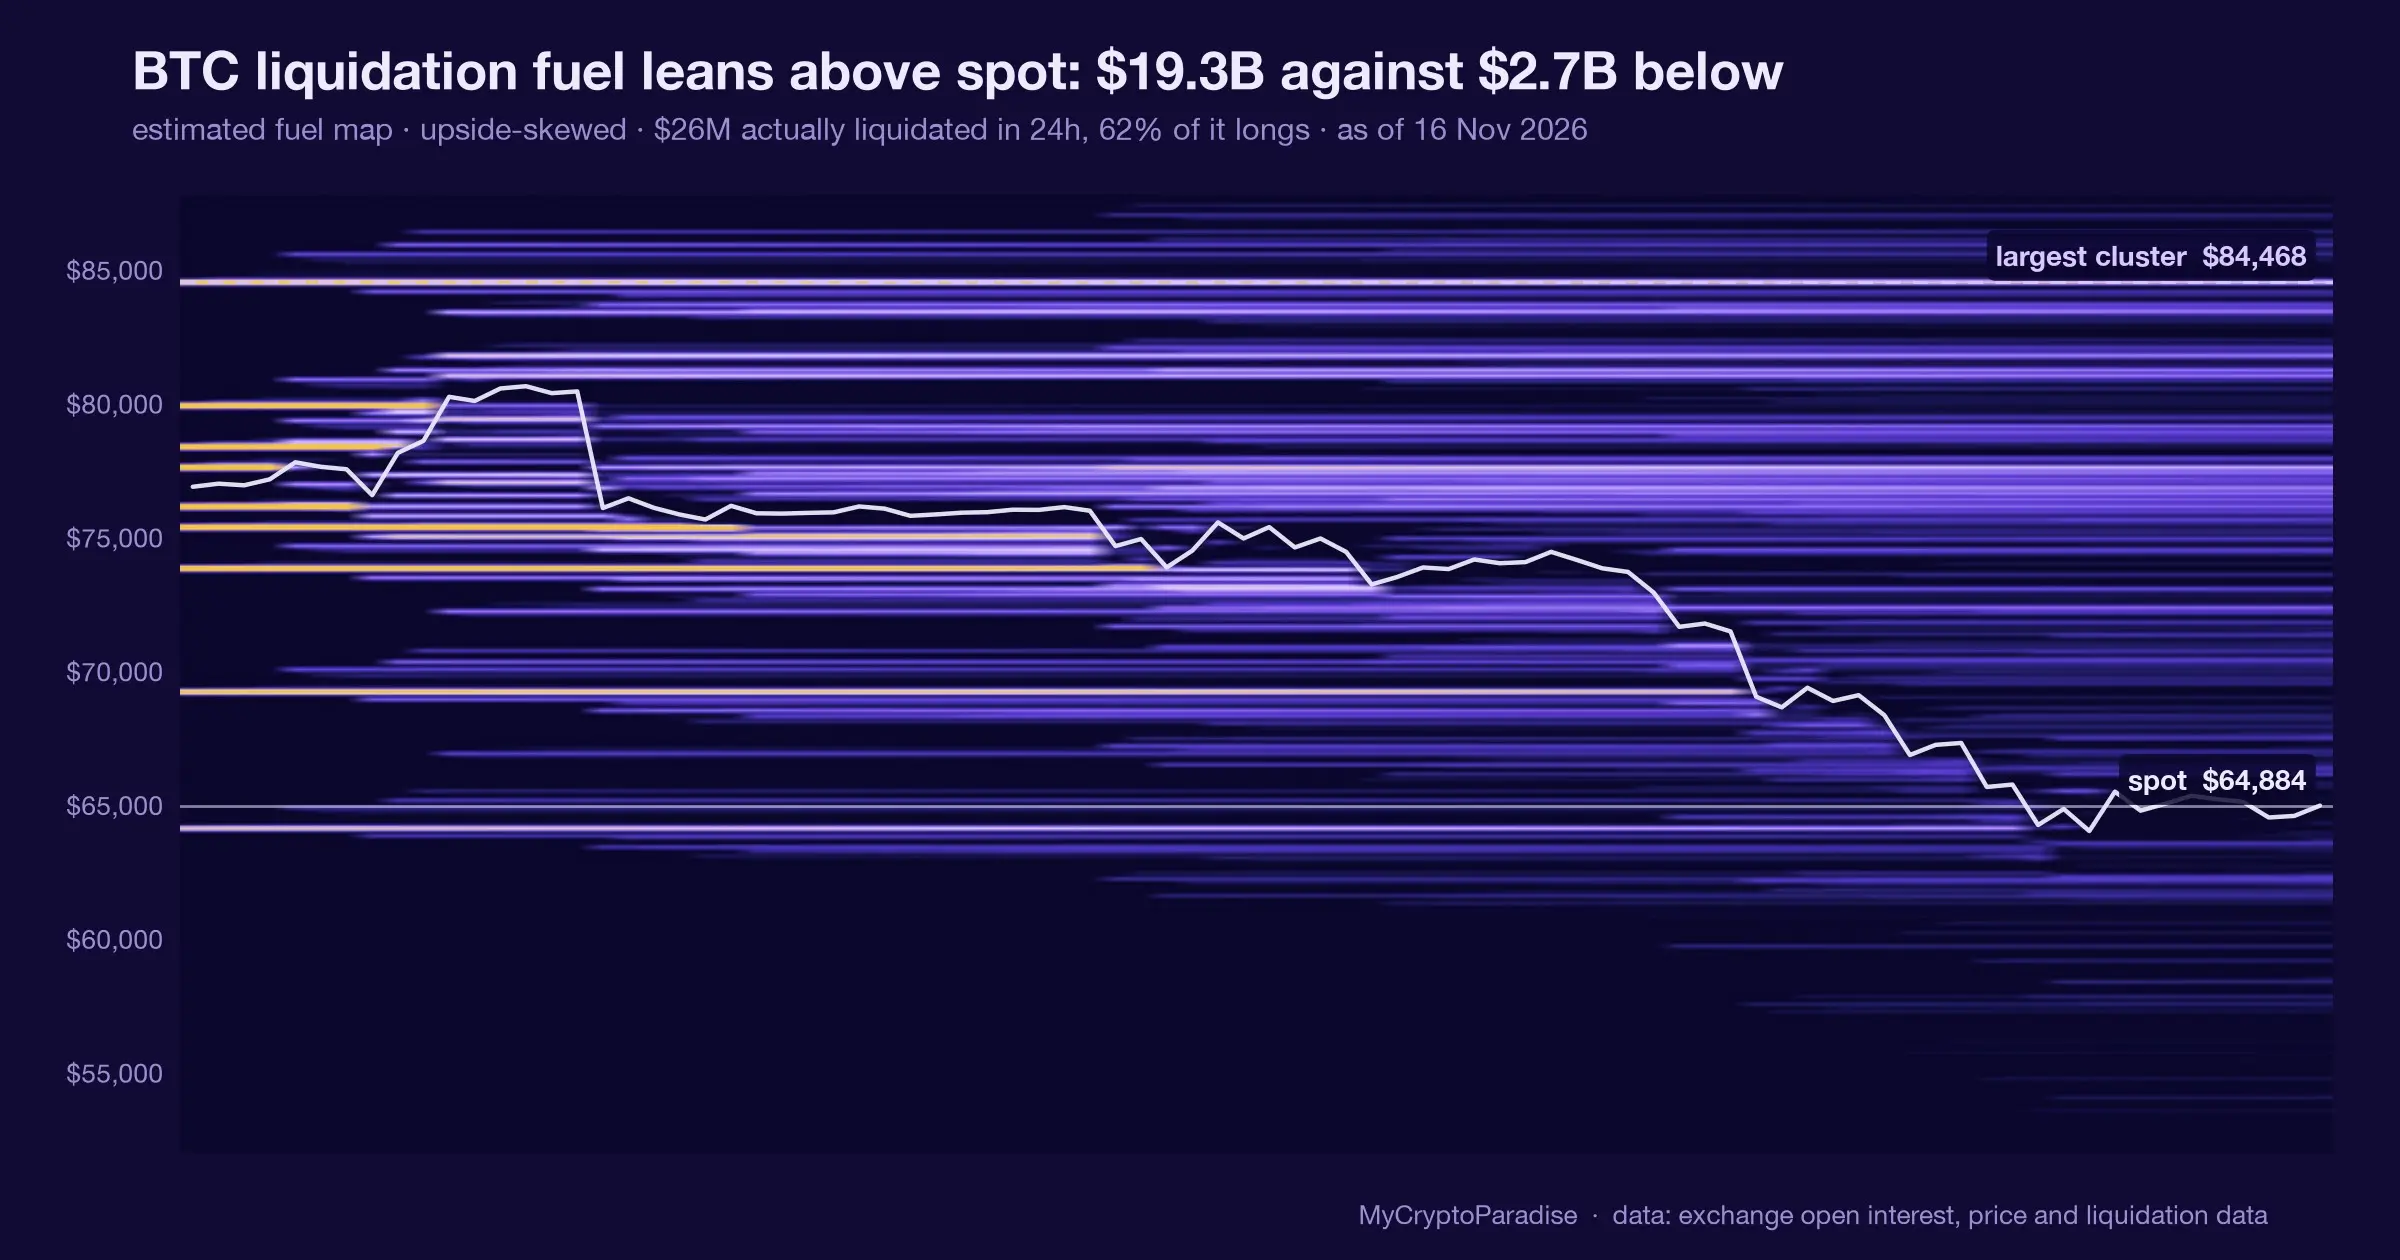
Our order-flow reading frames the drop as a hollow flush: price bleeding lower with open interest fading and no committed seller behind it. Pair that with a mild-impulse ETF drain and the picture is drift, not distribution accelerating. The 30-day net still says the month belonged to the sellers.
A flow map is a probability weight on a bias, never the bias itself. This one leans against the gloom; it does not overturn it.
What would flip this back to defensive
Grade it honestly going forward. The constructive lean lives entirely on the shallow impulse and the single green day; neither is load-bearing on its own. If 17 and 18 November print fresh outflows that push the five-day impulse back out of the lower third, the mild read is gone.
The bearish alternative is still fully alive in the 30-day number. A weekly close that deepens the net below minus $2.2 billion, or a Coinbase premium that turns decisively US-led to the downside, would confirm distribution rather than drift. We would mark the lean wrong and say so.
The honest posture here is patience with a tripwire. One mild day earns a lean, not a position, and the invalidation is what keeps the lean from becoming a story.
Reading ETF flow impulse yourself, step by step
- Open the Bitcoin ETF flow tracker and read the five-day net, not the single loudest session.
- Convert that dollar figure into its percentile against the series history, so you grade size, not just direction.
- Lay the five-day flow beside the five-day price return; a mild drain into a sharp drop is the tell.
- Check the 30-day net to see whether one green day sits inside a red month or a real turn.
- Confirm whether the reading carries a model-estimate flag, and treat an ungraded estimate as a recon number, not a rate.
The step skipped most is the percentile. A dollar figure feels precise, but without ranking it against its own history you cannot tell a mild drain from a rout.
Every number above is checkable against the live data. Start with the Bitcoin ETF flow tracker, then cross-read the MCP Insights hub and the Crypto Fear and Greed Index.
Act and invalidate
| Scenario | What confirms it | What kills it |
|---|---|---|
| Mild drain, holders sit still | Impulse stays sub-30th percentile | Fresh outflow exits lower third |
| Streak flip holds | Second inflow day prints | Outflow streak restarts |
| Distribution reasserts | 30-day net deepens below -$2.2B | Premium turns US-led down |
Posture: Neutral with a mild constructive lean while the impulse stays shallow and the streak holds its flip. No position is the highest-probability stance until a second green day or a deeper 30-day print picks the side.
Frequently asked questions
What does a 22nd-percentile ETF outflow mean?
It ranks the five-day drain against every prior five-day flow in our series: only about a fifth of past readings were smaller. In plain terms the $856.4 million exit is real but mild, far from a historically violent redemption wave.
Did the Bitcoin ETF outflow streak actually break?
Yes. After seven straight red sessions, 16 November 2026 recorded a net plus $8 million inflow, led by BlackRock’s IBIT. It is a token figure, enough to end the streak but not enough to reverse the negative 30-day trend.
Why does price falling 12 percent not show bigger outflows?
Because fund holders and spot sellers are different crowds. A sharp price slide can run on leverage and offshore selling while regulated holders sit tight, which is exactly what a shallow-impulse flow reading during a 12.35 percent drop describes.
Is this a reason to buy Bitcoin here?
No. The reading is one input that leans mildly constructive, not a direction to trade. It says redemptions stayed calm during weakness; it does not clear the heavier 30-day net, and the honest stance for most remains no position.
What would prove this mild read wrong?
A return to outflows that pushes the five-day impulse back out of the lower third, or a weekly close dragging the 30-day net below minus $2.2 billion. A decisively US-led Coinbase premium drop would confirm the bearish case.
Crypto trading involves substantial risk and is not suitable for everyone. Nothing here is financial advice; it is education only. Never risk more than you can afford to lose.
The private Extras feed, where the five-day flow impulse, the streak flip and the 30-day net update with their invalidation levels, is part of PRO Paradiser, the intelligence layer behind the ParadiseFamilyVIP strategies.












Join the discussion
No comments yet. Members, share how you are reading this.