

In short
Bitcoin’s cycle gauge blends five top-detection metrics into one reading of how late the cycle runs, and on 14 November 2026 it sits cold. Our MCP Insights cycle series, a model estimate that has not cleared its calibration gate, reads the regime as accumulation with four of its five components in the bottom third of their range: the Mayer Multiple at 0.88 against a 2.4 threshold, the 2-year moving-average multiplier at 10 percent, the Puell Multiple at 16 percent. Only the hashrate ratio runs warm, at 73 percent. We call this low top-risk, not a timing call: a cold gauge says the cycle top is unlikely to be in, nothing about next week. The valuation read sits in its value zone at the 12th percentile, down four grade points since we last recon-read it. This piece shows you how to read each cycle component yourself.
A cycle gauge measures distance from a top
A cycle gauge is not a forecast. It takes a handful of metrics that have historically run hot near market tops and cold near bottoms, then blends them into a single reading of how late the cycle sits. The output is a position on a map, not an arrow.
Each input carries its own logic. One compares price to a long moving average; another watches miner revenue; another tracks how two hashrate averages cross. None of them knows what price does tomorrow, and none claims to.
That is the point of a gauge: it tells you which part of the ride you are on, and leaves the steering to you. A reading cold across most of its inputs is a statement about risk of a top, not a schedule for a bottom.
The components read cold, one by one
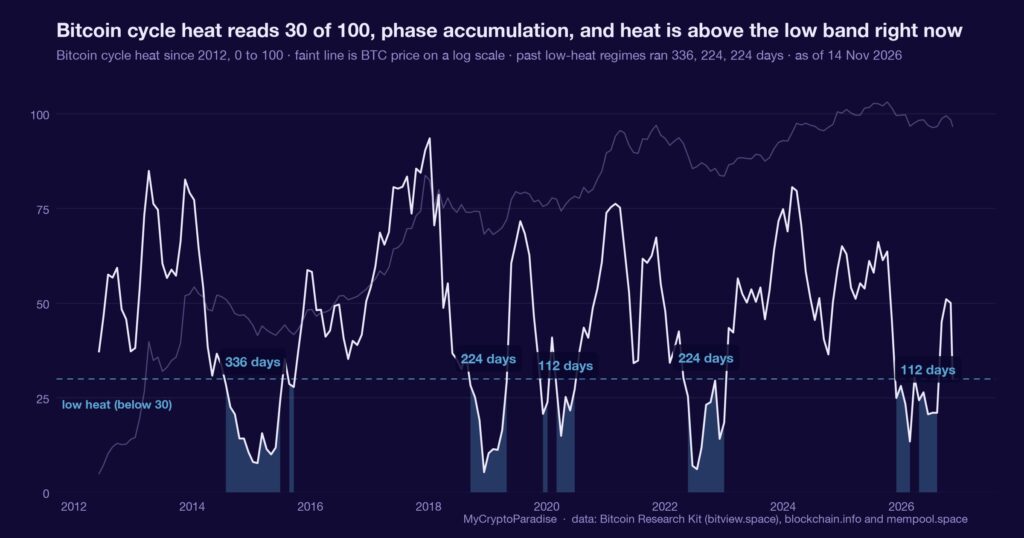
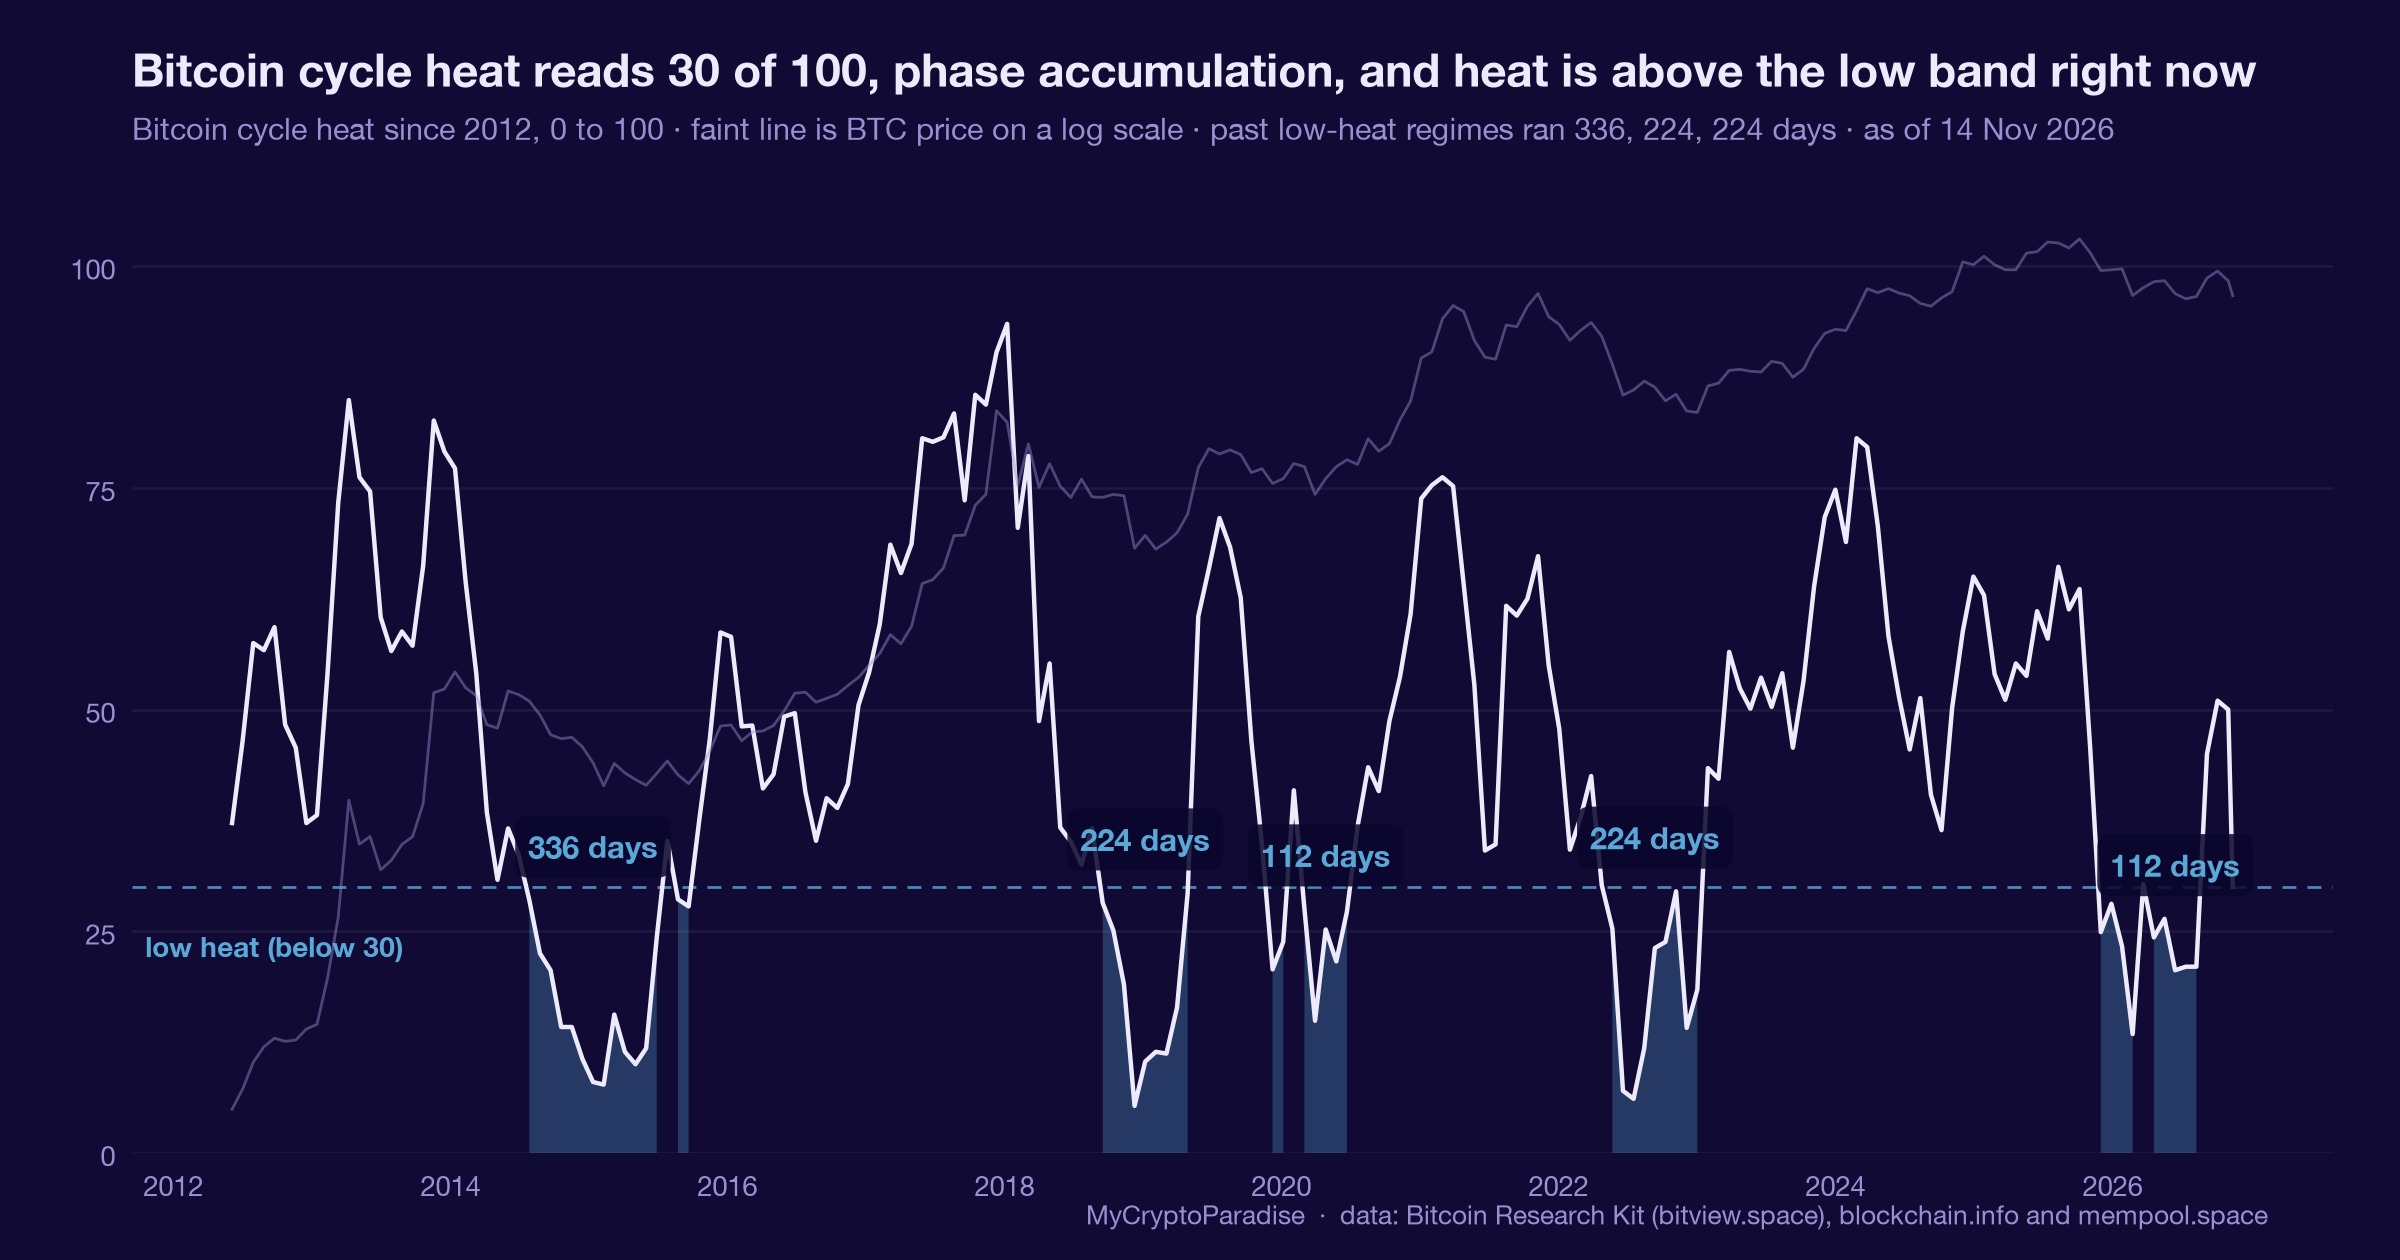
On 14 November 2026 our MCP Insights cycle series puts Bitcoin at roughly $64,500 with the regime in accumulation and cycle heat at 30 of 100. Four of the five components sit in the bottom third of their historical range.
The Mayer Multiple, price over its 200-day average, reads 0.88 against a 2.4 top threshold. The 2-year moving-average multiplier sits at the 10th percentile, the Puell Multiple at the 16th, Pi Cycle proximity at the 32nd.
Only the Hash Ribbons reading runs warm, at the 73rd percentile, with the 30-day hashrate holding just above the 60-day at 1.03, so no miner inversion. Valuation agrees: MVRV, market value to realised value, reads 1.21, with net unrealised profit or loss at 0.18, the 12th percentile, firmly in the value zone.
One warm metric among five does not warm the gauge. The hashrate strength is a health reading, not a top reading, and it is the only input leaning the other way.
Cold is not the same as cheap-and-going-up
The easy misread is to treat a cold gauge as a green light. It is not. A reading at the 12th valuation percentile says a cycle top is historically far away; it says nothing about whether next week is green or red.
Read it as what it is: a model estimate that has not cleared its calibration gate, so we quote it as a recon reading, never as a calibrated probability. This is one input. It sits alongside funding, open interest and spot absorption, and on the cycle horizon it says the top is not close.
A gauge that reads cold and admits it cannot time the bottom is more useful than one that always finds a signal.
What is different here
The ParadiseTeam does not read a cycle gauge as a single verdict. We split it into its five components, check each against its own threshold and provenance, flag that the series is a model estimate, and weigh it against funding and flow rather than letting one blended number carry a bias alone.
The gauge cooled, and the grades drifted down
Since our last cycle recon the picture has cooled, not heated. The valuation gravity grade slipped four points to 32, and the top-risk grade eased a point to 32, both pointing down. The cycle has not advanced toward a top; if anything it stepped back.
For scale, every prior cycle peak in our comparison set printed MVRV above 2.9, from 2.94 in late 2021 to 6.03 in 2013. Today’s 1.21 is less than half the mildest of them. That is distance, measured, not a promise about the path there.
Distance from a top is real information and it is worth exactly one line of risk. It is not a bottom bell, and nobody rings one.
The one warm reading is the miners
The lone warm input is worth a sentence of its own. Hash Ribbons compares the 30-day hashrate to the 60-day; a cross below one flags miner capitulation. At 1.03 it sits just above, with the capitulation gauge at 23 of 100 and no inversion live.
Mining economics frame why that matters. Our production-cost read puts the all-in cost near $84,000 against spot near $64,500, a ratio of 0.77, so miners are producing below cost yet have not been forced to capitulate in the hashrate.
Below-cost production with a steady hashrate is a tension, not a trigger. It resolves when the hashrate rolls over or when price lifts back above cost, and until one of those prints it is simply context.
Reading the cycle gauge yourself, step by step
- Open the cycle valuation tool and note the regime label and the cycle-heat number before reading any single component.
- Read each of the five components as a percentile of its own range, not as a raw value you half-remember.
- Compare the Mayer Multiple and Puell Multiple to their top thresholds, 2.4 and 4, to see how far a top sits.
- Check Hash Ribbons for a cross below one, which flags miner capitulation, and note whether any inversion is actually live.
- Cross the valuation percentile against prior cycle peaks in the comparison panel, then set the level that would warm the gauge.
The step people skip is checking whether the series cleared its calibration gate. A model estimate flagged as ungated is a lean to weigh, never a frequency to quote.
Every number above is checkable against the live data. Start with the MCP Insights hub, then cross-read the Crypto Fear and Greed Index and the live crypto funding rates.
Act and invalidate
| Scenario | What confirms it | What kills it |
|---|---|---|
| Cold gauge holds | Components stay bottom-third | Mayer clears 1.4 |
| Miners capitulate | Hash Ribbons inverts below one | 30-day reclaims 60-day |
| Cycle warms late | Valuation leaves value zone | Percentile falls under 12 |
Posture: The cold gauge is a low-top-risk backdrop, not a timing tool, so for most readers the highest-probability stance here is patience with a defined level that would change it. Size this as one line of context behind your own bias, not the bias itself.
Frequently asked questions
What does a cycle heat reading of 30 mean?
It places the cycle in its accumulation phase, roughly a third of the way up a top-detection scale from zero to one hundred. Thirty is a cold reading: it says a cycle top is historically distant, while saying nothing about short-term direction.
Is Bitcoin cheap at the 12th valuation percentile?
By this gauge it sits in the value zone, with market value to realised value at 1.21 and the reading below the 25th percentile. Cheap by history is not the same as about to rise, and the gauge makes no claim about timing.
Why is only one cycle metric warm?
The lone warm input is Hash Ribbons, at the 73rd percentile, which tracks hashrate health rather than price froth. A strong hashrate is a sign miners have not capitulated, so it leans healthy, not toppy, and does not warm the blended gauge.
Can this cycle gauge call the bottom?
No, and it does not try. It measures distance from a historical top, which is a different question from where a bottom sits. The reading tells you top risk is low; it offers no bell for a floor, and nobody honest rings one.
What would change this cold cycle read?
The gauge warms if components climb together: the Mayer Multiple clearing 1.4, valuation leaving the value zone, or Hash Ribbons inverting below one. Any of those would move the regime off accumulation and bring top-risk metrics back into the conversation.
Crypto trading involves substantial risk and is not suitable for everyone. Nothing here is financial advice; it is education only. Never risk more than you can afford to lose.
The private Extras feed, where the cycle gauge, its five top-detection components and the valuation zone update with their invalidation levels, is part of PRO Paradiser, the intelligence layer behind the ParadiseFamilyVIP strategies.











Join the discussion
No comments yet. Members, share how you are reading this.