

In short: RSI measures momentum: whether recent gains or recent losses have been bigger. Read the 50 line first, because it shows which side controls momentum. Then judge how strong the reading is and check swings for divergences. Treat every reading as evidence, not as an entry.
The Relative Strength Index (RSI) is the momentum gauge most crypto traders open first. Most of them only watch 70 and 30. The line that tells you more sits quietly in the middle, at 50.
MyCryptoParadise is a professional crypto signals and trading education service operating since 2016. This MCP University FREE class follows the order the ParadiseTeam reads momentum in. First who controls it, then how strong it is, then where it disagrees with price. Only then the plan.
What does RSI actually measure?
RSI compares the size of recent gains with the size of recent losses and expresses the result on a scale from 0 to 100. J. Welles Wilder introduced it in 1978, and most charts still use his default of 14 periods. It measures the speed of price change, not price itself.
An RSI of 80 means gains have heavily outweighed losses over that window. An RSI of 55 means buyers have only just had the better of it. The number tells you who has been winning and by how much, which is exactly what momentum is. Investopedia’s RSI definition walks through the arithmetic if you want it.
Why is the 50 line the most important level on the RSI?
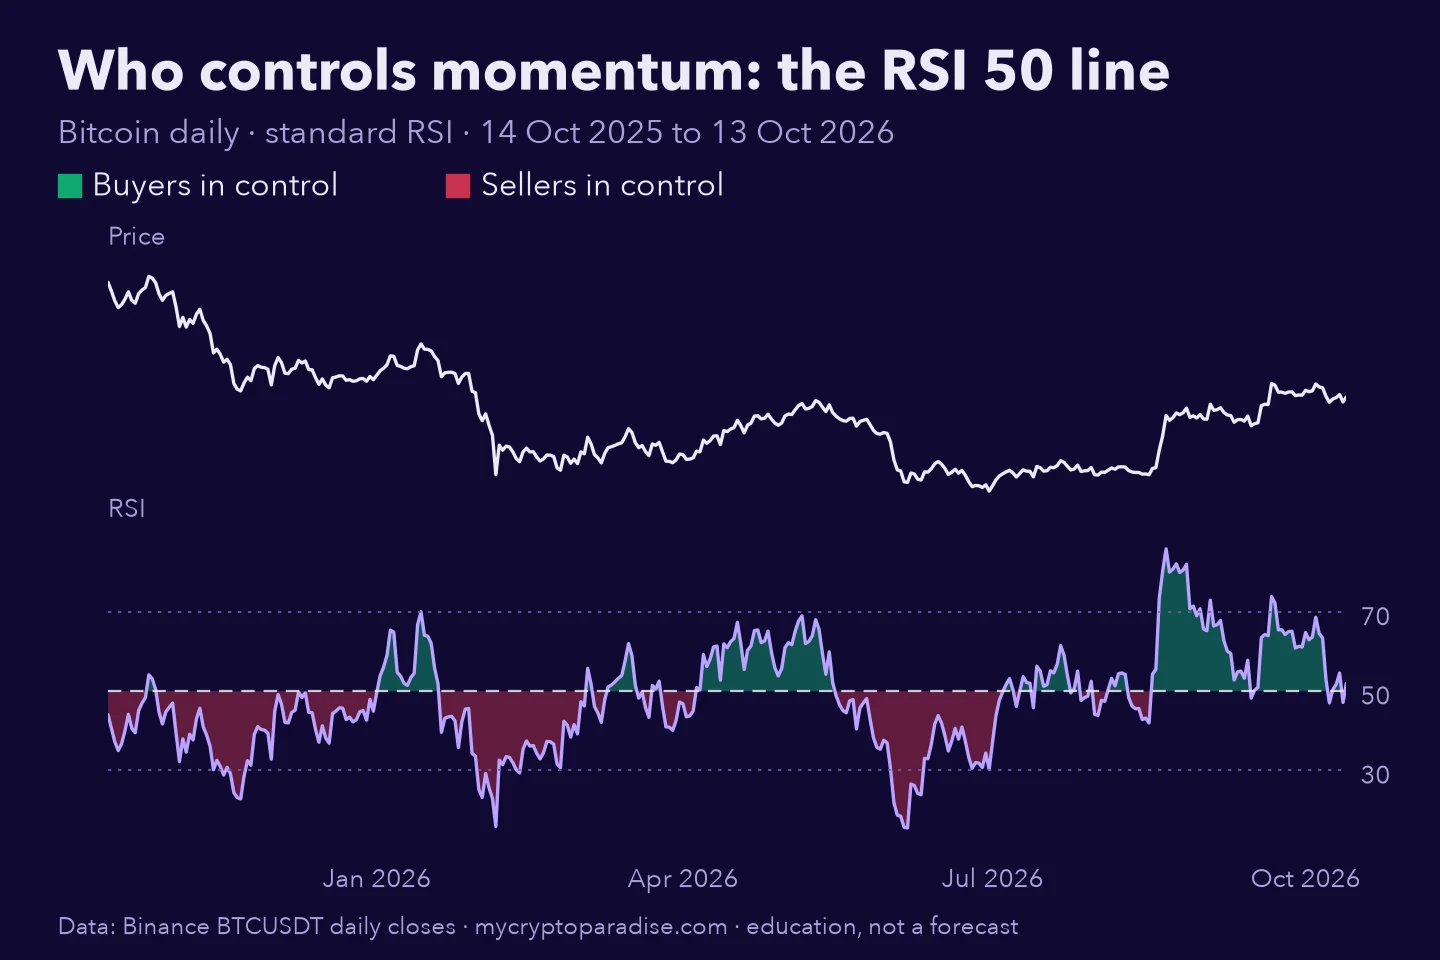
The 50 line is where average gains and average losses are equal. Above it, recent gains are bigger than recent losses, so buyers control momentum. Below it, sellers do. That makes 50 the boundary between two momentum regimes, and the first thing to read on any RSI.
Above the 50 line: buyers own the momentum
In a healthy uptrend the RSI spends most of its time above the 50 line. Pullbacks drag it down toward the line, and buyers tend to step back in before it gives way. When the RSI dips toward the line and turns back up, the trend is pausing, not necessarily ending.
Below the 50 line: sellers own the momentum
The mirror applies in a downtrend. Rallies lift the RSI toward 50 and stall there, because sellers still control the bigger moves. Oversold readings can stretch further than feels possible while sellers are in charge.
Is a cross of the 50 line a trade signal?
No. A cross of 50 says control is changing hands, not that a trade is ready. In a sideways market the RSI chops back and forth across 50, and every cross looks meaningful. A cross that agrees with a broken price level carries far more weight than one inside a sideways range.
Why are 70 and 30 not sell and buy signals?
Overbought, beyond the 70 line, and oversold, beyond the 30 line, describe a stretch, not a turning point. In a strong trend the RSI can stay overbought for days while price keeps climbing. Treat both lines as a reason to pay closer attention, never as an automatic exit or entry.
Our lesson on overbought and oversold RSI conditions goes deeper into those two lines, and combining RSI with other indicators shows how to add confirmation.
How much weight does an RSI reading deserve?
Weigh an RSI reading by where it happens, not by the number alone. A bullish reading that comes off a tested support level deserves more weight than the same reading inside a sideways range. A reading that fights the price structure deserves less, however stretched it looks.
A divergence against the reading, explained in the next section, is a reason to lower your conviction, not to flip your view. Most of the time the honest answer sits somewhere in between. Some indicators now grade their own reading so you do not have to guess, as the probability points section below shows.
What is an RSI divergence?
An RSI divergence is a disagreement between price and momentum at two swings. Price makes a new high or low, but the RSI does not confirm it. It warns that the force behind the move may be tiring. It does not tell you when, or even whether, price will turn.
A divergence can only be confirmed after a swing has finished forming, so it always appears a few candles late. That delay is the price of not being fooled by a swing that is still moving.
The four divergences the ParadiseTeam names
- Classic: price makes a new high or low, the RSI does not.
- Exaggerated: price makes an equal high or low, a double top or bottom.
- Weak: price makes a new extreme, the RSI only matches its last swing.
- Hidden: the continuation shape, where the RSI overshoots on a pullback.
Ranked from strongest to weakest, the reversal shapes run Classic, Exaggerated, then Weak. Hidden sits outside that ranking, because it points to continuation rather than reversal. When the same disagreement repeats across several swings, it is called an extended divergence. It is slower to play out, so it needs a wider stop and a smaller position.
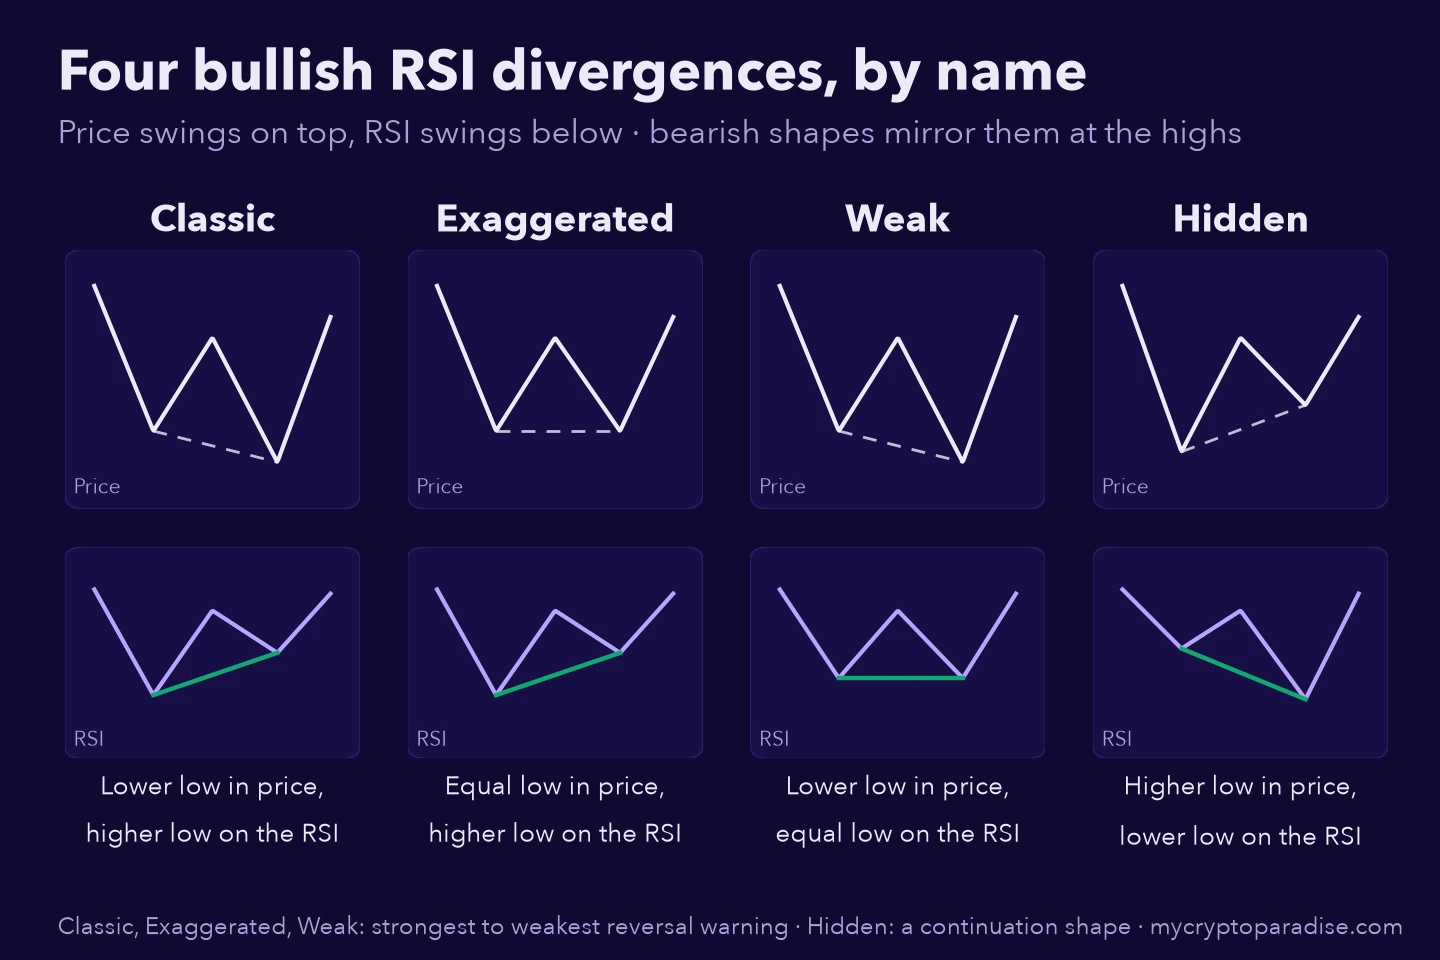
Each shape has its own lesson: the bullish divergence class, bearish divergences ranked by strength and the hidden divergence guide.
What do probability points mean?
Probability points are a score from 0 to 5 that grades how strong an indicator’s reading is. Think of it as a strength grade, not a prediction. More points mean a stronger reading. Zero points means no edge. The score describes the reading itself, never where price goes next.
The idea solves a problem every RSI user knows. Two readings can both look bullish while one is barely awake and the other is firmly set. A plain RSI leaves that judgement to you. A graded reading puts a measured strength next to the word, so the difference is visible at a glance.
MCP uses the same 0 to 5 scale on every tool in AI Indicators by MCP. The points are calibrated with AI on years of market behaviour, then locked before a tool reaches your chart. Three points mean the same thing on every tool, so a strong reading always looks the same.
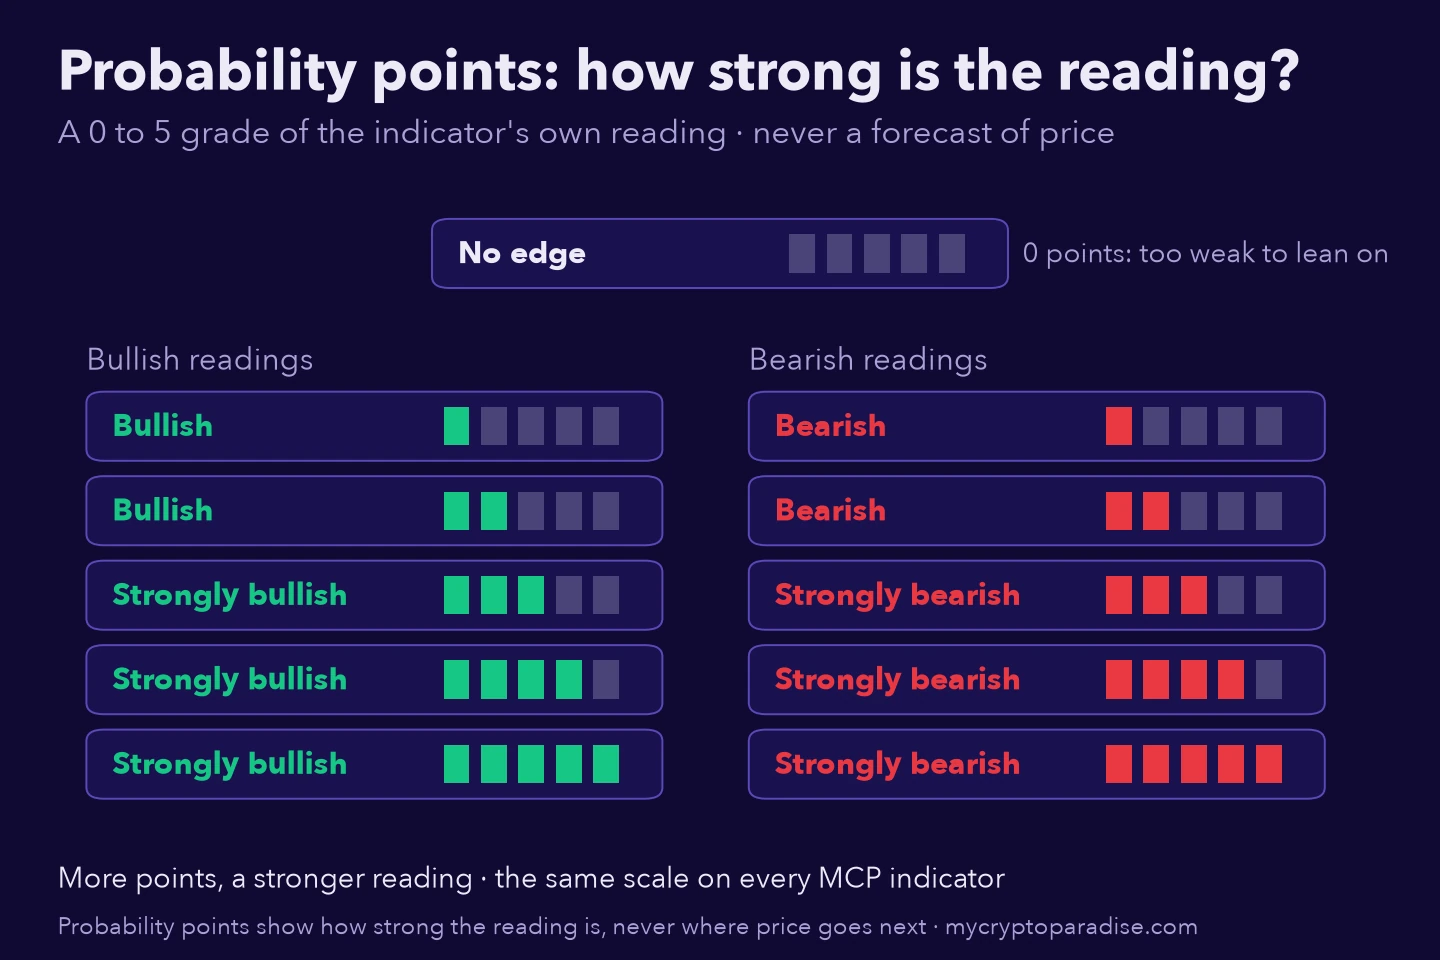
Why is No edge a useful answer?
Most of the time, markets offer nothing worth leaning on. An indicator that admits it shows zero points and the words No edge. That saves you from the trades you only took because the chart looked busy. As our piece on the no-trade day puts it, waiting is a position too.
What probability points are not
- Not a forecast that your trade will win.
- Not a price target or a forecast of direction.
- Not an instruction to enter or exit on their own.
How do you use the RSI indicator, step by step?
Use the RSI indicator as a short routine, never as a single number. Start from the price levels that matter, then read who controls momentum and how firmly. Check for a divergence at your level, and decide what would prove you wrong before you risk anything. Five steps keep the order honest.
- Mark the key levels on the price chart first.
- Check whether the RSI is above or below the 50 line, and whether it is building.
- Look for a divergence at your level, and name its type.
- Weigh the strength: a weak reading earns less of your conviction.
- Write your invalidation and position size before you enter.
The order matters. Levels come first, because a strong RSI reading far from any level is still far from any level. Momentum comes second. The plan comes last, and always before the entry, never after it.
Common RSI mistakes
- Selling every touch of 70 in a strong uptrend.
- Treating a cross of 50 as an entry on its own.
- Calling every wiggle a divergence before the swing confirms.
- Reading a fast intraday RSI as if it were a daily one.
- Ignoring how strong, or how weak, the reading actually is.
Practice this
Open a daily Bitcoin chart with a standard RSI. Mark where it crossed 50 over the past year and note how price behaved on each side of the line. Then find two divergences, name their type, and write down what would have proved each one wrong.
The ParadiseTeam built every idea in this class into MCP RSI Intelligence, its TradingView RSI indicator calibrated with AI. It names the momentum in plain words, grades it with probability points and labels each divergence by type. The next step shows how to read it on a live chart.
Next step
See it on a chart: how to use MCP RSI Intelligence
FAQs
What is a good RSI setting for crypto?
Most traders keep Wilder’s default of 14 periods, and it works on crypto charts as well as anywhere else. Shorter settings react faster but flip more often. Longer settings are smoother but slower. Changing the setting changes what every level means, so pick one and stay consistent.
Is an RSI above the 50 line bullish?
Above the 50 line, recent gains have outweighed recent losses, so buyers control momentum. That is a bullish momentum regime, not a buy signal. Price can still fall from there, and in a sideways market the RSI crosses the line often. Use it as context next to price structure.
Which RSI divergence is the strongest?
A classic divergence, where price makes a new extreme and the RSI does not, is the strongest reversal warning. Exaggerated comes next, then weak. Hidden divergence is a continuation shape, so it sits outside that ranking. No divergence is a complete trade on its own.
What does No edge mean on an indicator?
No edge means the reading is too weak to lean on right now. A well-built indicator says so instead of forcing a bullish or bearish call. It is a useful answer, because it tells you to wait for a clearer reading or to rely on other evidence.
Do probability points predict price?
No. Probability points show how strong the indicator’s own reading is, on a fixed scale from 0 to 5. They never forecast price direction, targets or timing. Past behaviour is not a promise, so every trade still needs its own invalidation and position size.
Risk disclaimer: Crypto trading involves substantial risk of loss. This class is education only, not financial advice. Never trade with money you cannot afford to lose. Past results do not guarantee future results.











Join the discussion 3
For accumulation, I find the 50 line particularly useful. How do you assess its significance when a crypto asset is range-bound versus trending strongly?
Priya, it's a good anchor, particularly in chop. I find the slope of the 50 line itself, not just the crossing, offers some decent insight into liquidity absorption.
yeah priya, the 50 is so good for confirming direction after a chop fest! 📉 anyone else get stuck in the middle there a lot? 😅