


In short: The Fibonacci golden zone is the band between the 0.618 and 0.786 retracement of an impulse leg. A pullback that reaches it and closes on the zone’s side has held it. The leg’s origin marks where the idea is wrong, and the extensions at 1.272 and 1.618 mark the usual targets.
Most traders draw a Fibonacci retracement, see price reach a level and act on that alone. A level on its own is only part of a plan. A golden-zone trade needs three prices before any entry: the zone, the line that proves it wrong, and the targets.
MyCryptoParadise is a professional crypto signals and trading education service operating since 2016. This MCP University FREE class reads a pullback the way the ParadiseTeam does. The leg comes first, then the zone and its invalidation, and only then the targets and the size.
What is the Fibonacci golden zone?
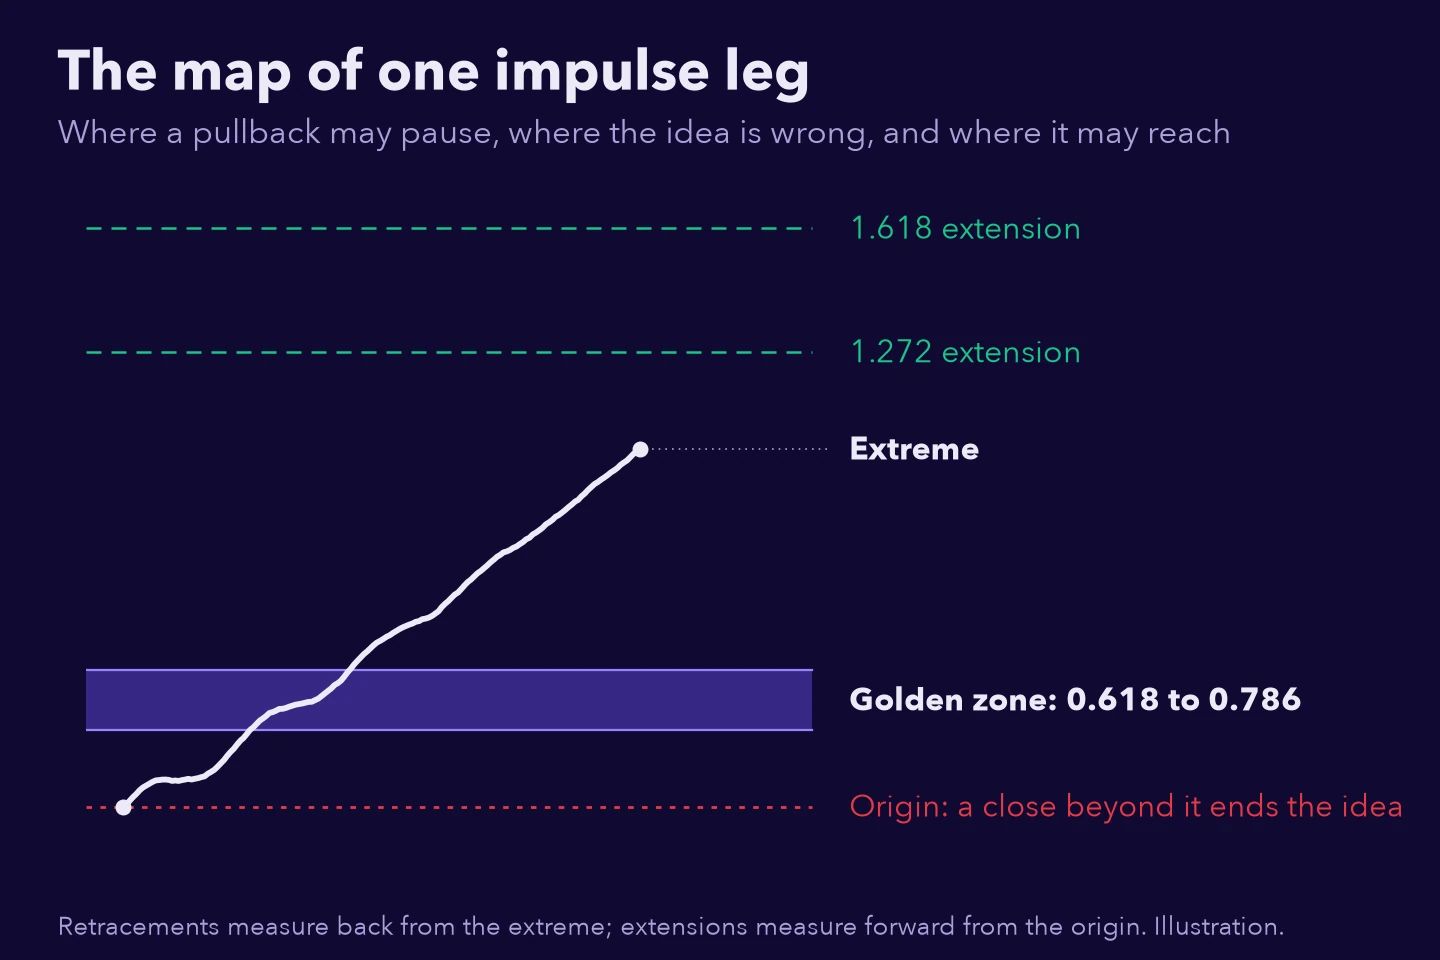
The Fibonacci golden zone is the band where a pullback has given back between 0.618 and 0.786 of an impulse leg. In an up-leg it sits below the high, and in a down-leg above the low. Traders watch it as the last area where a pullback still reads as a pause.
The numbers come from the Fibonacci sequence. 0.618 is the inverse of the golden ratio, 1.618, which gives the zone its name, and 0.786 is the square root of 0.618. Wikipedia’s page on Fibonacci retracement covers the ratios and their history.
Definitions vary between traders. Many call a narrower band at the 0.618 end the golden pocket. Our class on Fibonacci retracement levels and the golden pocket covers it, along with how to draw the tool. This class uses the wider band and builds a whole trade plan around it.
What is an impulse leg?
An impulse leg is a one-directional move that a pullback later retraces. It has two ends. The origin is where the move started, and the extreme is the furthest point it reached. Every price on the Fibonacci map, from the zone to the targets, comes from those two points.
Which leg you measure is the decision that matters most, because a different leg gives a different map. Our guide to reading market structure with higher highs and lows helps you see the moves themselves.
What does it mean when the golden zone holds?
The golden zone holds when price pulls back into it and closes without going through it. Reaching the zone is only half of the read. The close says whether the pullback was defended there, on that candle, and the panel names the read.
A held zone describes one candle at one level. Price can still turn later, and held zones do give way. Our piece on telling a pullback from a reversal shows how structure separates a pause from a real change of direction.
Where is a golden-zone trade wrong?
At the leg’s origin. A candle closing beyond the origin means the pullback has undone the whole impulse, so the idea behind the trade is gone. That makes the origin the natural invalidation line, and the stop belongs beyond it rather than inside the zone.
Inside the zone, price often wobbles before it decides. A stop placed there can be taken by that noise before the idea has had room to work out.
If the distance to the origin is too wide for your risk, the answer is a smaller position, or no trade at all. The stop stays where the idea is wrong, and the size adapts to it.
What are Fibonacci extensions?
Fibonacci extensions are levels past the leg’s extreme, in the direction of the impulse. Each one is a multiple of the whole leg, counted from the origin. The 1.272 extension sits a little beyond the extreme, and the 1.618 extension further out. Traders use them as targets for the move after a held pullback.
A worked example makes the map concrete. Take an up-leg from an origin at $60,000 to an extreme at $80,000.
- The golden zone: $67,640 at 0.618 down to $64,280 at 0.786.
- The invalidation: a candle closing below $60,000, the origin.
- The targets: $85,440 at the 1.272 extension and $92,360 at the 1.618 extension.
- The reward-to-risk: for an entry at the centre of the zone, $65,960, about 3.3R to the 1.272 and 4.4R to the 1.618.
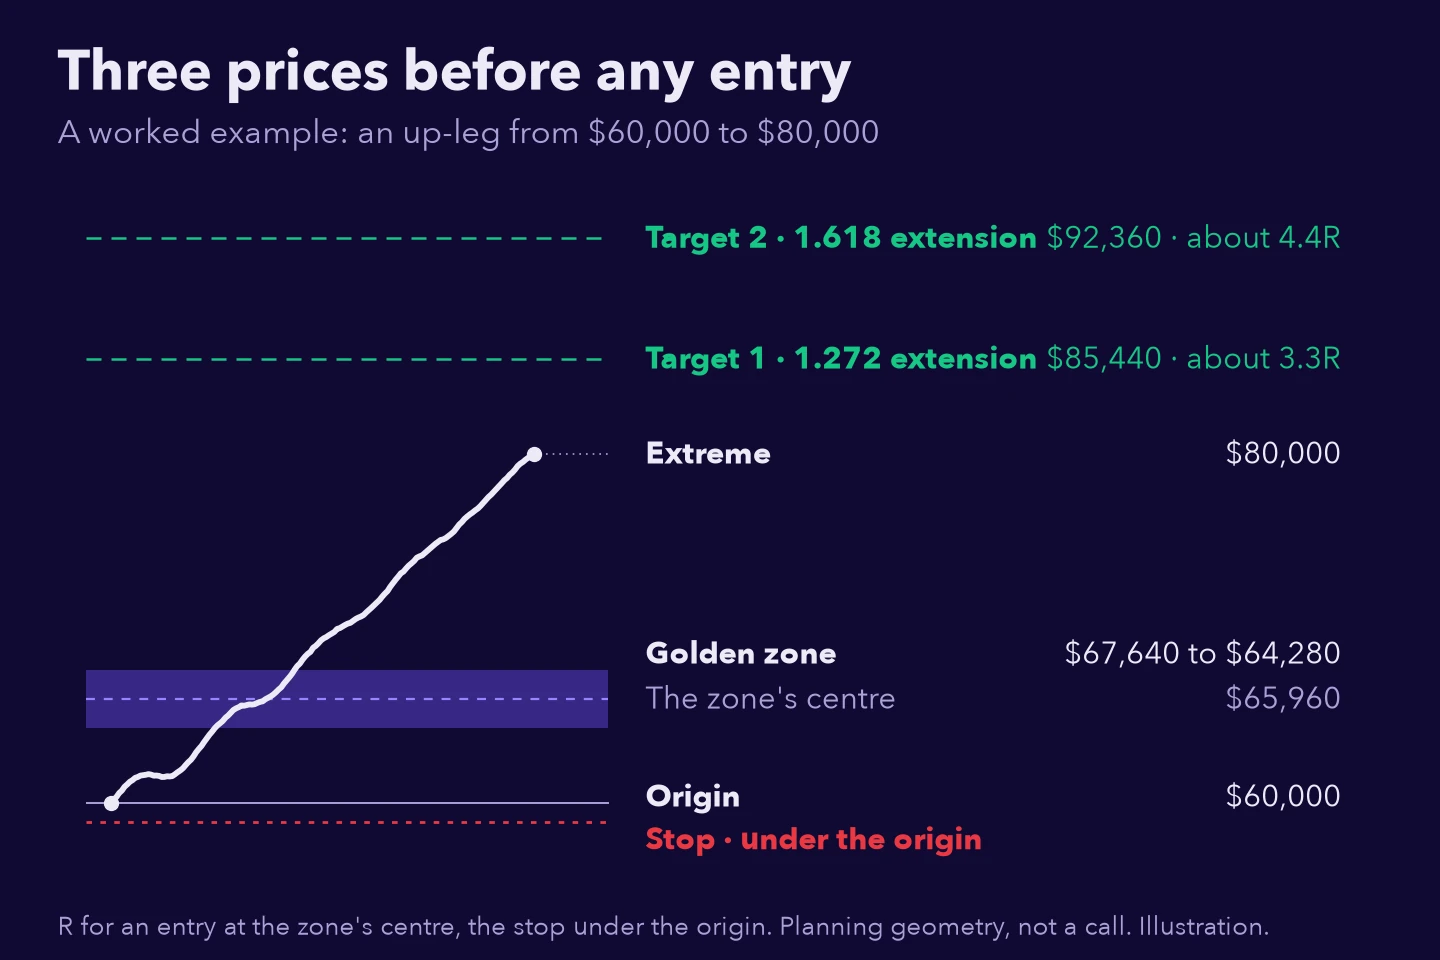
R is reward divided by risk: the distance to the target over the distance to the stop. Your real R depends on your real entry, so measure it from the price you actually get. Our explainer on the risk/reward ratio works through it in more detail.
What do probability points mean?
Probability points are a 0 to 5 grade that some indicators put on their own reading. For a golden-zone test, the grade answers one question: how firmly has a test like this one held in the past? More points mean a firmer history. The grade describes the test, and your plan decides the trade.
Zero points is a complete answer too. It means a test like this one has held about as often as a typical one, so it is described, not graded. MCP uses one 0 to 5 scale across its indicators, so a strong grade looks the same on every tool.
What probability points are not
- Not a forecast of direction, a price target or a timing call.
- Not a promise about the next candle.
- Not an entry or an exit on their own.
How do you plan a golden-zone trade, step by step?
A golden-zone plan is a short routine in a fixed order, written before the entry. Each step narrows the next one. The leg sets the map and the close at the zone sets the read. The origin sets the risk, and the extensions decide whether the trade is worth taking.
- Mark the impulse leg: its origin and its extreme.
- Mark the golden zone and the 1.272 and 1.618 extensions.
- Wait for price to reach the zone and close on its side.
- Place the invalidation beyond the origin, and size from that distance.
- Check the reward-to-risk to the extensions before you enter.
Size comes from the stop, whatever the setup looks like. Our guide on writing a trade plan before you open a position shows how to put all five steps on paper.
Common golden-zone mistakes
- Acting the moment price reaches the zone, before a candle has closed.
- Placing the stop inside the zone, where ordinary noise takes it out.
- Holding on after a candle has closed beyond the origin.
- Reading the 1.618 extension as a promise rather than a target.
- Treating a held zone as a reason to skip the plan.
Practice this
Open a chart you already follow and find three impulse legs. For each, mark the origin, the extreme, the golden zone and both extensions. Then scroll forward. Did price reach the zone, and did a candle close on its side? Did the origin survive, and which extension came first?
Write the answers down before you scroll on. Over a few weeks you start to see which held zones led somewhere and which gave way, and your plan starts to account for both.
Where does MCP Precision Fibonacci V2 fit?
The ParadiseTeam built this map into MCP Precision Fibonacci V2, a TradingView indicator in AI Indicators by MCP, included with PRO Paradiser. It keeps the map of the latest impulse leg up to date, with a price on every line, and speaks at the golden-zone test.
MCP Precision Fibonacci V2 grades each golden-zone test with a machine-learning model inside, on the charts where the research confirmed it. A test with points is drawn on the chart, and the panel names every read in plain words.
Next step
See it on a chart: how to use MCP Precision Fibonacci V2
FAQs
What is the golden zone in Fibonacci trading?
It is the band where a pullback has given back between 0.618 and 0.786 of an impulse leg. Traders watch it as the last area where a pullback still reads as a pause. A pullback that reaches the zone and closes on its side has held it, which is a read rather than a signal.
Is the golden zone the same as the golden pocket?
Not quite. The golden pocket is a narrower band at the 0.618 end of the golden zone, and the golden zone runs all the way to 0.786. Both describe the same idea: the area where a pullback may pause. Both belong inside a written plan, with the stop beyond the origin.
Where do you put the stop on a golden-zone trade?
Beyond the leg’s origin, where the move began. A close beyond the origin means the pullback has undone the whole impulse, so the idea is gone. A stop inside the zone is easily taken by ordinary noise. If the distance is too wide for your risk, take a smaller position instead.
How do you use Fibonacci extensions as targets?
Mark the 1.272 and 1.618 extensions of the leg, past its extreme. The 1.272 is the nearer target and the 1.618 the further one. Many traders take part of the position off at the first and let the rest run toward the second, with the stop already written.
Is a held golden zone a buy signal?
Not on its own. A held zone means price reached the zone and the candle closed on its side, on that candle. Price can still turn and close beyond the origin later. Treat it as a reason to look closer at the trade you already plan, with the stop and the size written first.
Risk disclaimer: Crypto trading involves substantial risk of loss. This class is education only, not financial advice. Never trade with money you cannot afford to lose. Past results do not guarantee future results.











Join the discussion
No comments yet. Members, share how you are reading this.