

In short
MCP RSI Intelligence is an RSI indicator for TradingView from AI Indicators by MCP, built by the ParadiseTeam and calibrated with AI. It keeps the classic RSI and adds a small panel that names the reading in plain words, from Strongly bullish to Strongly bearish. Up to five probability points grade how strong that reading is on the 5m, 15m, 1h, 4h, daily and weekly charts. No edge appears when it is too weak to lean on. Divergences are drawn and named by type, and every mark explains itself on hover. There are no settings to change. Use it as one layer of evidence, never as an entry on its own.
What is MCP RSI Intelligence?
MCP RSI Intelligence is the first indicator in AI Indicators by MCP, built by the ParadiseTeam. It draws the RSI traders already know, then grades the reading on screen with probability points calibrated with AI on years of market behaviour. It names divergences, explains itself in plain words and is included with PRO Paradiser.
What is different here
Most RSI scripts leave the judgement to you. Here the AI does its work before the tool reaches your chart, so the reading arrives already graded on one 0 to 5 scale. When the evidence is thin it says No edge, and a weak reading never looks as convincing as a strong one.
It answers the momentum question, one of the eight questions professionals answer before they trade. If the RSI itself is new to you, start with the free class on how to read RSI. It covers the 50 line, divergences and probability points without any tool. This guide covers the indicator itself, element by element.
How do you add MCP RSI Intelligence to your chart?
The script is invite-only on TradingView, so access goes to your TradingView username. A free TradingView account is enough. Once the ParadiseTeam has added the script to your account, it appears under invite-only scripts in the Indicators menu, ready to add to any chart.
- Join PRO Paradiser, the membership that includes the indicator.
- Leave your TradingView username on your members’ page.
- The ParadiseTeam adds the script, usually within a day.
- On TradingView, open Indicators, then Invite-only scripts.
- Add MCP RSI Intelligence to any chart.
There are no inputs to set. Everything that produces the reading is fixed, so every member sees the same reading on the same chart. The Style tab only changes how it looks, and Defaults, then Reset settings, puts the house look back.
What does each line on the pane mean?
The pane keeps the standard picture of the Relative Strength Index, so nothing in it should surprise an RSI user. What changes is how much each element is allowed to say, and how clearly it says it. Four elements make up the picture, and each has one job.
- The violet line is the RSI itself, one colour on both sides of 50.
- The blue line is the RSI’s own average, a slower read of the same momentum.
- The grey band shows how far the RSI usually swings around that average.
- The dashed lines mark 70, 50 and 30: overbought, the regime line and oversold.

Two more things can appear on the pane: small coloured dots on the RSI line, and divergence lines with a name beside them. Both are covered below. Everything else on the pane lives in the panel at the top right.
How do you read the panel?
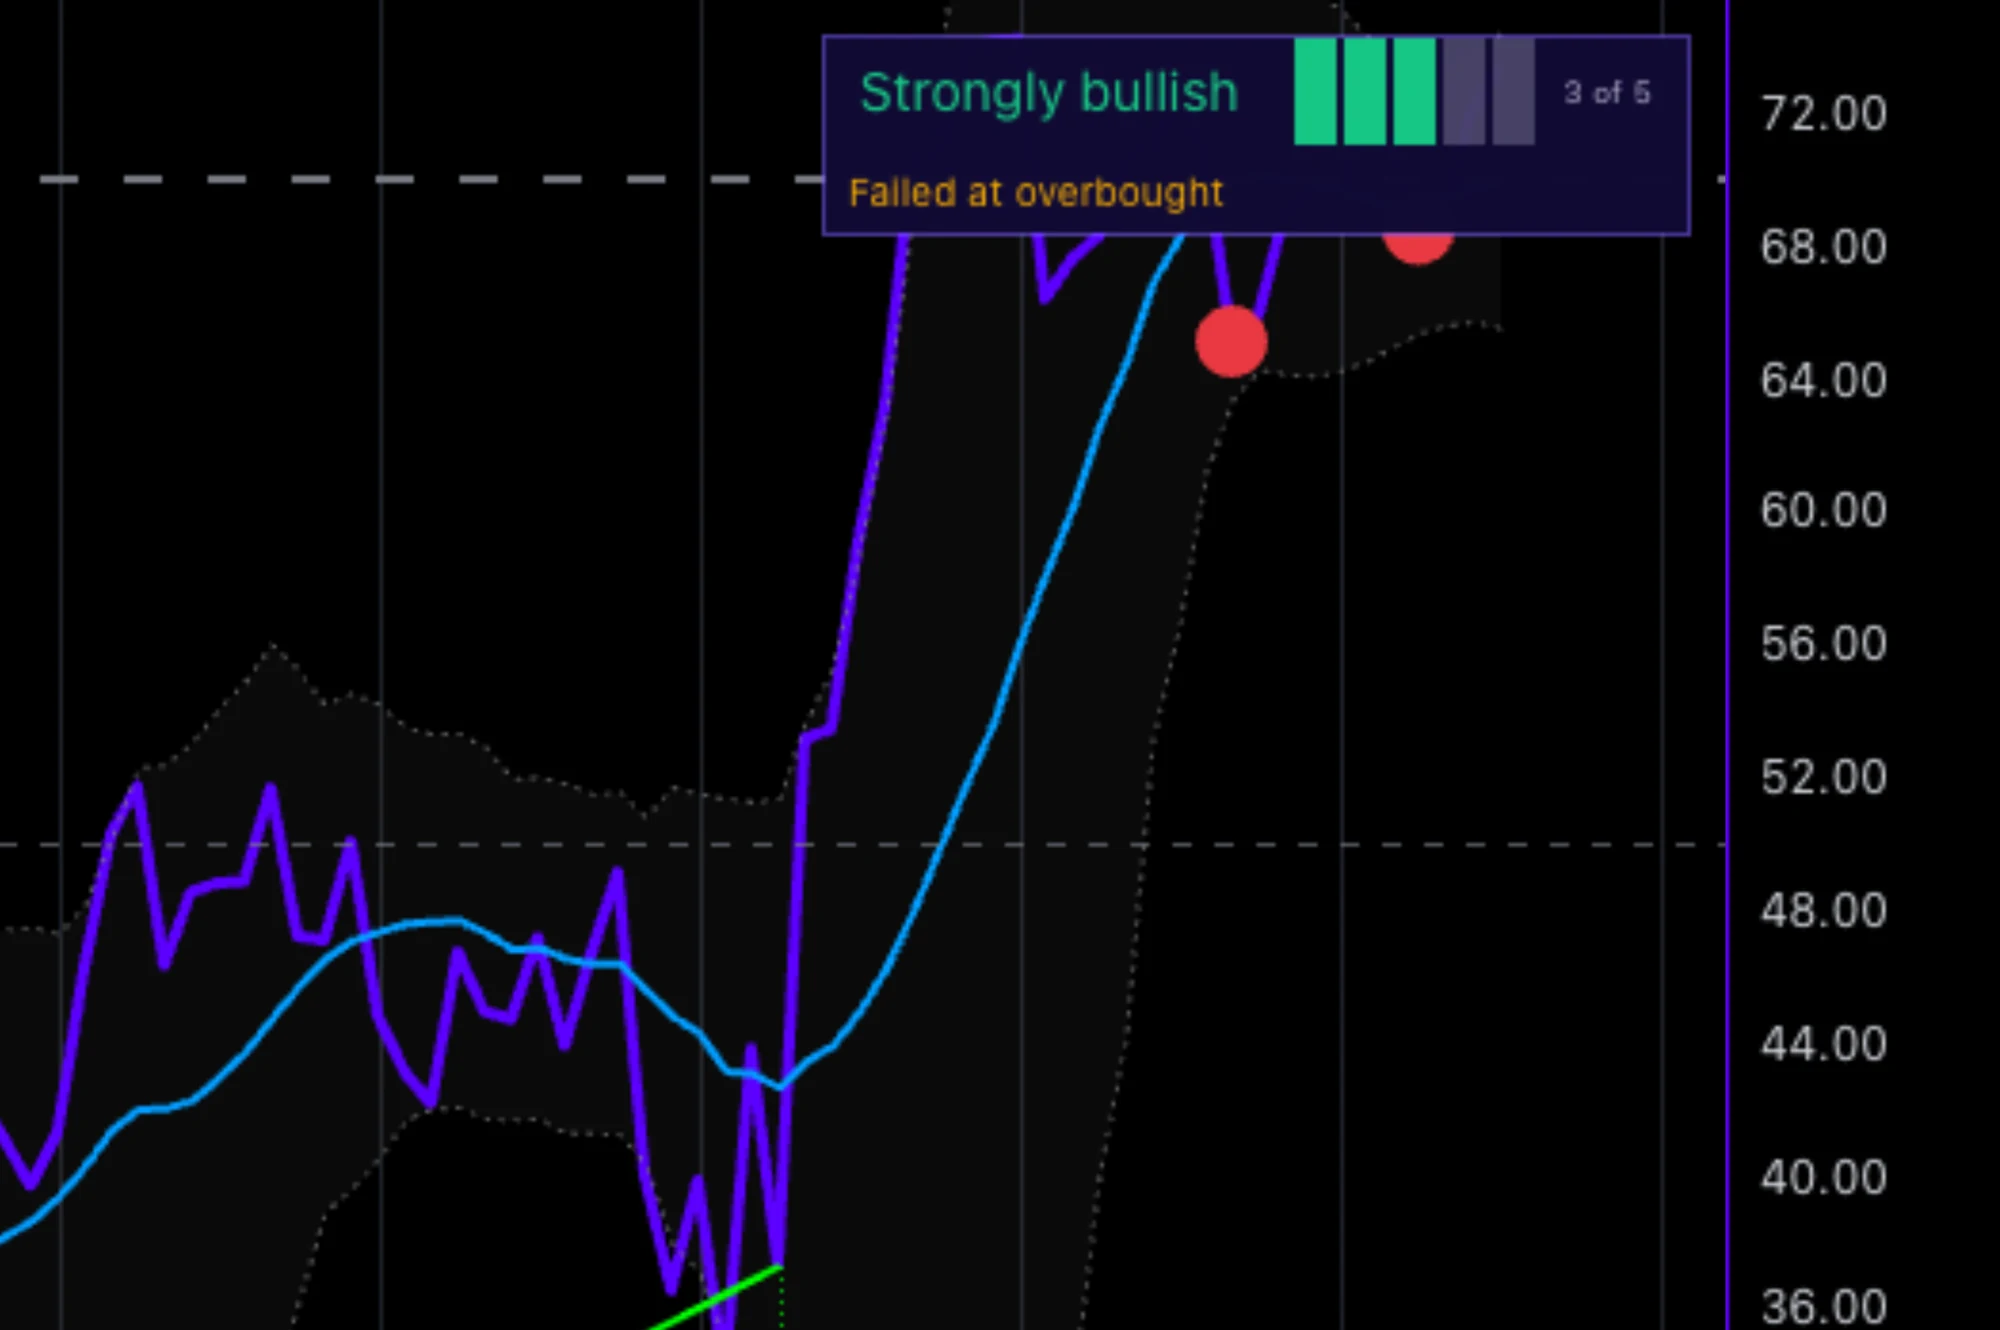
Read the panel from left to right. The word names the momentum reading. The five probability points grade how strong it is, and a small count says how many are lit. The second line says what to expect, or describes the momentum in words. Hover any part of the panel for the full explanation.
The word
There are five: Strongly bullish, Bullish, No edge, Bearish and Strongly bearish. Bullish and Bearish come with one or two points. Strongly needs three or more. No edge appears whenever the reading carries no points, whatever the RSI happens to be doing.
The probability points
Five small blocks sit beside the word. They light up green for a bullish reading and red for a bearish one, and stay grey when there is no edge. More lit blocks mean a stronger reading. They grade the RSI’s own reading, never where price goes next.
The count
A small count after the five blocks reads the meter for you, from 0 of 5 to 5 of 5. At 0 of 5, the reading was graded and is too weak to lean on, so the word says No edge.
A blank count means there is nothing to grade. Either the chart is still warming up, or you are on a timeframe without points. Hover the meter there and it names the six charts that carry them.
The second line
When the reading carries points, the second line turns them into a plain expectation. You can see at a glance how much weight the reading deserves. More points, a firmer expectation.
With no points, the second line describes the momentum in plain words instead, such as whether it is still building or starting to ease. That way the panel never goes silent, even when it has nothing to grade.
The gold line
For a few candles after an event, the second line turns gold and names it. The four events are New bullish divergence, New bearish divergence, Failed at overbought and Recovered from oversold. Then it returns to the reading.
The hover
Hover the word and the panel opens its full reasoning. It lists the strength in points, the reading, what supports it, what works against it and what would weaken it. Every hover carries the same reminder: the points describe how strong the reading on screen is, never where price goes next.
What do the probability points mean, and what do they not mean?
Probability points show how strong the RSI’s own reading is, on a fixed scale from 0 to 5. The more points, the stronger the reading, and No edge means it is too weak to lean on. The ParadiseTeam calibrated the scale with AI on years of market behaviour across many markets, then locked it.
Probability points appear on six timeframes: 5m, 15m, 1h, 4h, daily and weekly. On any other timeframe the panel still reads the momentum in words, without points. A reading never shows more points than it has earned. What changed in the latest update covers the newest improvements.
Three things the points are not. They are not a forecast that your trade will win. They are not a price target. And they are not a signal to enter or exit on their own. They answer one question only: how firm is this momentum reading right now?
How does MCP RSI Intelligence name divergences?
When price and the RSI disagree at two confirmed swings, the indicator draws a line between the two RSI swings. It labels the shape by name: Classic, Exaggerated, Weak or Hidden. Green lines point up, red lines point down. Hover a label and it describes the exact shape it found.
- Classic: price makes a new high or low, the RSI does not.
- Exaggerated: price makes an equal high or low, a double top or bottom.
- Weak: price makes a new extreme, the RSI only matches its last swing.
- Hidden: the continuation shape, where the RSI overshoots on a pullback.
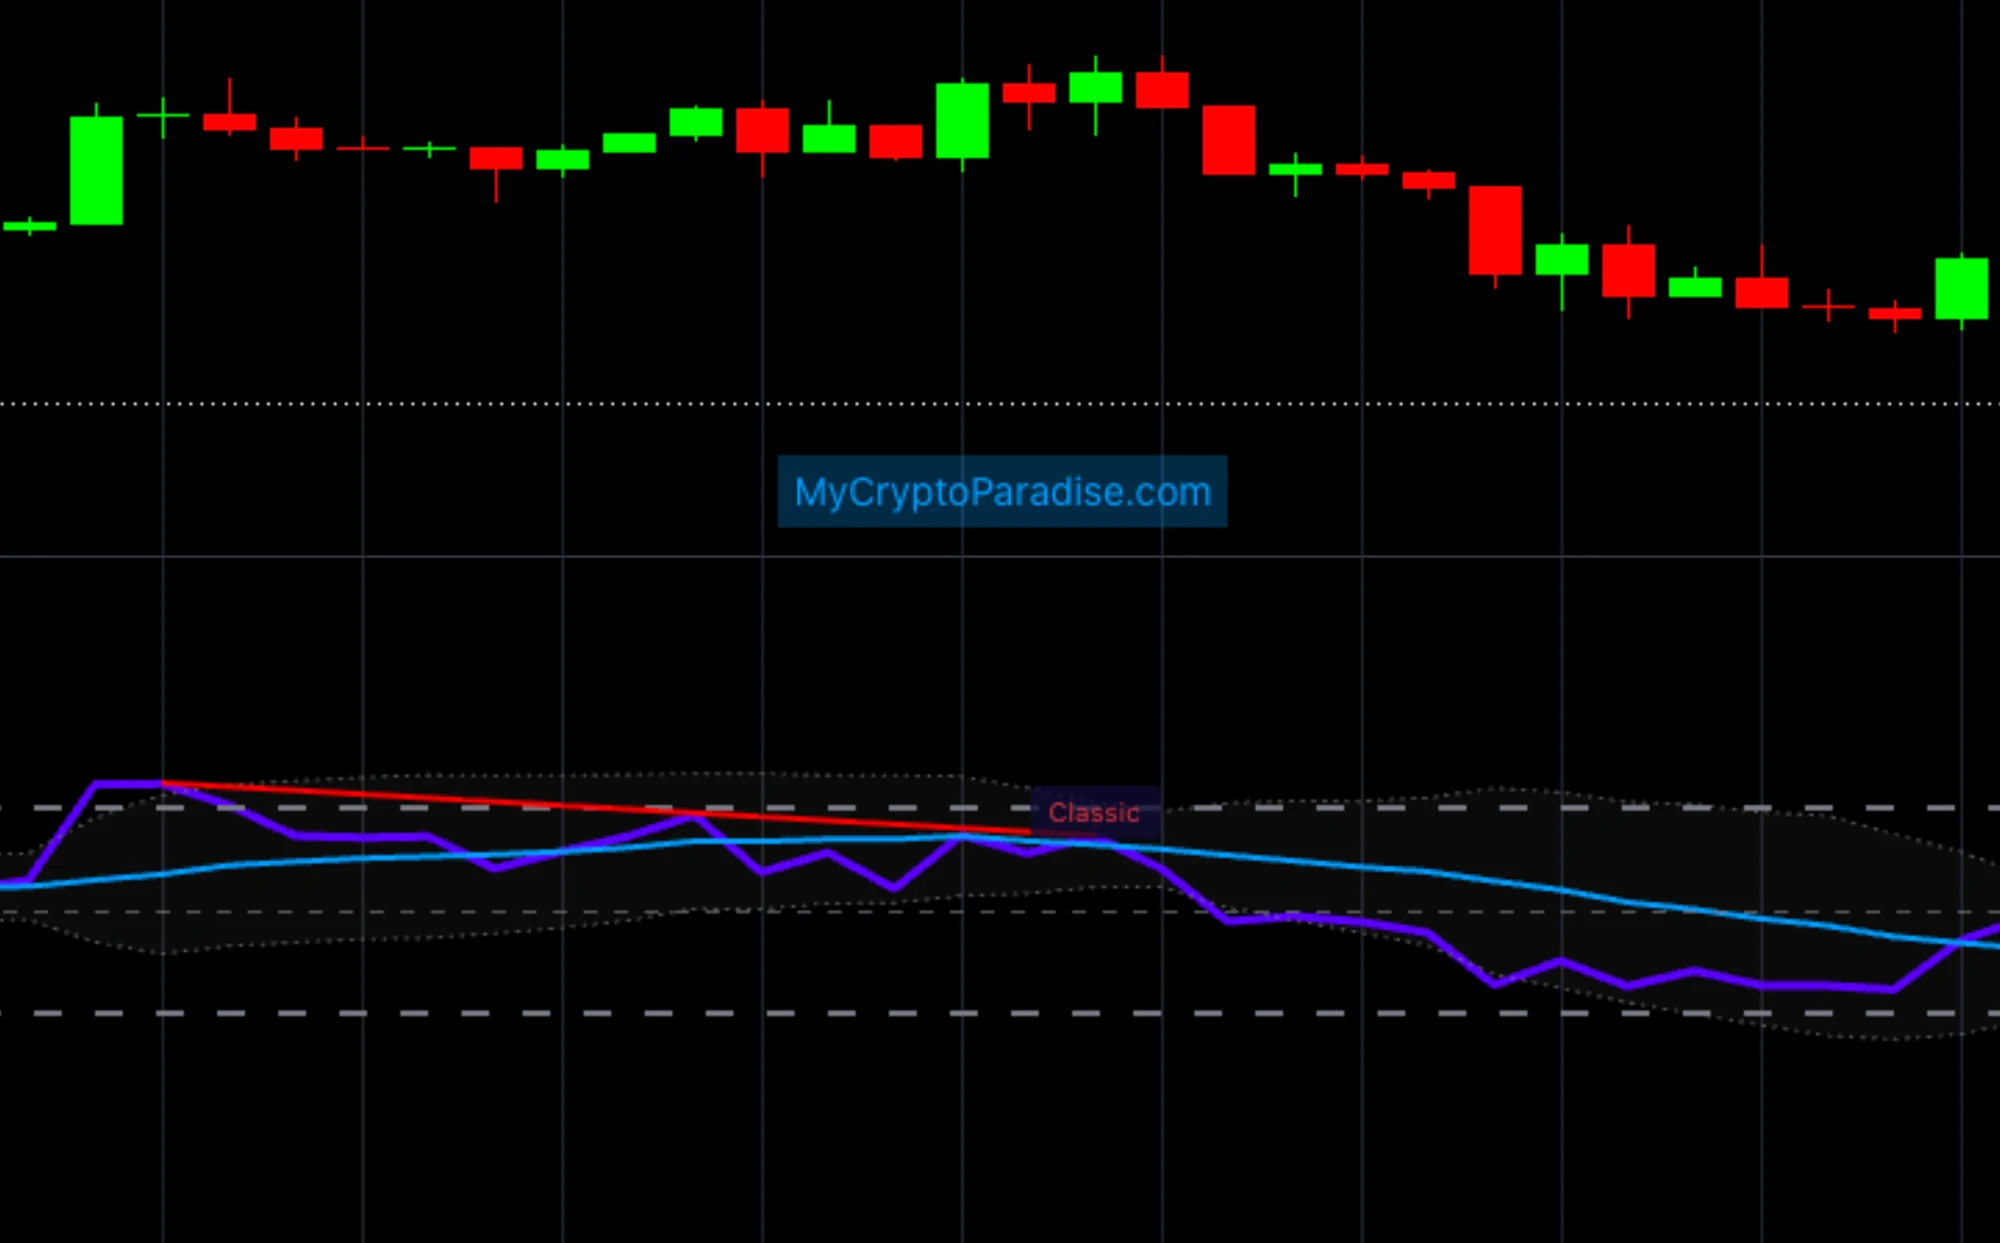
Divergences confirm only after the swing has formed, so labels appear a few candles late and never repaint. When a shape lines up with more than one earlier swing, the hover calls it an extended divergence.
For a while after a divergence confirms, the panel grades the divergence itself on the same 0 to 5 scale. Then it returns to the RSI’s own reading.
The names follow the house ranking from our class on divergences ranked by strength. Classic is the strongest reversal warning. Hidden is a continuation shape that sits outside that ranking.
What do the green and red dots mean?
The dots mark moments, not trades. A red dot means momentum failed at overbought: buying pressure is fading from a stretched high. A green dot means momentum recovered from oversold: selling pressure is fading from a stretched low. Both are evidence to weigh, never an order.
Read a red dot as a reason to protect gains, not as a sell signal, because in a strong uptrend the RSI can reclaim 70. Read a green dot as early evidence, not as a buy signal. Hover either one and it tells you the same thing in its own words.
Which alerts can you set?
Six alerts are built in, one for each event the indicator tracks. They cover the two regime flips, the two momentum turns at the extremes and the two confirmed divergences. Set each one to Once per bar close, so it only fires on a confirmed candle, never on one still forming.
- Regime flip up and Regime flip down.
- Momentum failed at overbought.
- Momentum recovered from oversold.
- Confirmed bullish and confirmed bearish RSI divergence.
Every alert message ends with the same line: education, not financial advice. An alert tells you that something happened on the chart. The decision about what to do with it stays yours.
A five-step routine for using it
- Mark the levels that matter on the price chart first.
- Read the panel: the word, the points, the second line.
- Hover it: what supports the reading, and what would weaken it?
- Check for a named divergence near your level.
- Write your invalidation and size the trade before you enter.
The indicator gives no entries, exits, stops or position sizes, and that is deliberate. It is one layer of evidence. Your levels and your risk budget carry the decision, so a weak reading never gets a strong reading’s size.
What can it not do?
MCP RSI Intelligence reads momentum and nothing else, so it cannot see news, liquidity or fundamentals. Its points summarise past market behaviour, and markets change. It gives no entries, exits or stops, so treat it as one layer of evidence next to your levels and your risk plan.
- Points appear on six timeframes; other charts get the words only.
- Divergences confirm late, by design, so they never repaint.
- A chart with little history shows Warming up until enough candles load.
AI Indicators by MCP
MCP RSI Intelligence is live for PRO Paradisers.
Frequently asked questions
Do I need a paid TradingView plan?
No. A free TradingView account runs invite-only scripts, including this one. Access is granted to your TradingView username, so there is nothing to download or install. Once the ParadiseTeam adds it, the indicator appears under invite-only scripts in your Indicators menu.
Does MCP RSI Intelligence repaint?
No. Every reading settles on closed candles, and divergences only confirm after the swing has formed. That is why a divergence label can appear a few candles after the swing, by design. What you see in the chart’s history is what would have shown live at the time.
Why does the panel say No edge when the RSI looks strong?
Because the reading has not earned a point, even if the line looks lively. If the count says 0 of 5, the reading was graded and is too weak right now. If the count is blank, this timeframe carries no points at all. Either way, the second line still describes the momentum in plain words.
Which timeframes show probability points?
Six: 5m, 15m, 1h, 4h, daily and weekly. On any other timeframe the panel still describes the momentum in plain words. It shows no points there, and the count next to the meter stays blank. Hover the meter and it lists the six.
Is MCP RSI Intelligence a buy and sell signal?
No. It grades momentum and names divergences, but it never gives entries, exits, stops or position sizes. Use it as one layer of evidence next to price structure and a written risk plan. This is education and market intelligence, not financial advice.
Crypto trading involves substantial risk and is not suitable for everyone. Nothing here is financial advice; it is education only. Never risk more than you can afford to lose.










Join the discussion
No comments yet. Members, share how you are reading this.