



In short: A market regime is the kind of market you are trading in. It is either a trend the bigger picture backs, or a mixed market with no trend worth leaning on. It also covers the size of the moves: calm, normal or uncertain. Name the regime first, then pick the tactic that fits it.
Most traders blame the tactic when a trade goes wrong. Often the tactic was sound and the market regime was wrong for it. Buying a dip is a trend tactic. Inside a ranging market, the same entry often gets chopped up between the edges, and a good tactic fails in the wrong market.
MyCryptoParadise is a professional crypto signals and trading education service operating since 2016. This MCP University FREE class reads a market the way the ParadiseTeam does. First the regime, then the tape, and only then the tactic and the size.
What is a market regime?
A market regime is the state a market is in for a stretch of time. The two questions that define it are simple. Is price trending, or moving sideways in a range? And are the moves calm, normal or unusually large? Each answer changes which tactics fit and how much risk makes sense.
A regime describes the conditions right now, the way a weather report describes the sky. It does not say where price goes next. It says which kind of plan suits the conditions you are in. Wikipedia’s overview of market trends covers the textbook terms behind it.
How do you tell a trending market from a ranging one?
Look at the swings first. A trending market keeps making higher highs and higher lows, or lower highs and lower lows on the way down. Pullbacks stall before they undo the last swing. A ranging market rotates between support and resistance, and breaks of either edge often snap back inside.
- Trending: each swing sets a new high or low, and pullbacks stop short of the last one.
- Ranging: swings overlap, and price keeps returning to the centre of the range.
- In between: one chart trends while the bigger picture points the other way.
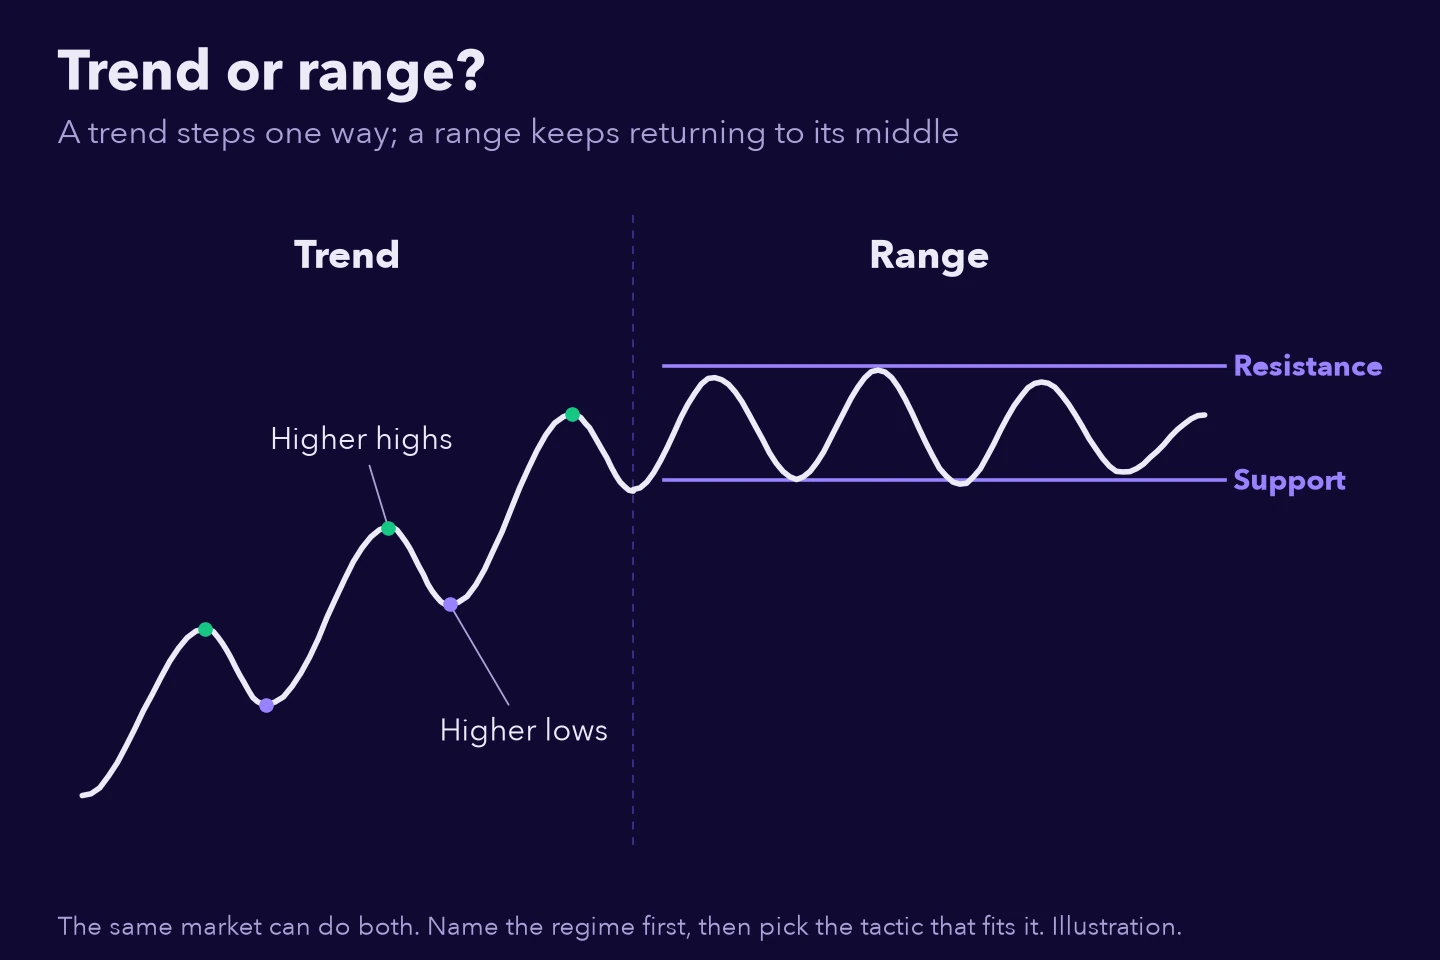
Our guide to reading market structure with higher highs and lows goes deeper into the swings themselves.
Why does the bigger picture decide whether a trend is real?
Because every chart sits inside a slower one. A short-term rise can be a pullback inside a bigger downtrend. Read alone, that chart looks like an uptrend. Read against the bigger picture, it is a counter-trend move, and counter-trend moves often end where the larger move resumes.
So professionals check that the bigger picture backs a trend before they lean on it. When it does, the trend has support behind it. When it points the other way, the honest read is mixed: no trend worth leaning on, whatever the last few candles did.
Our guide on lining up three timeframes before a swing entry shows that check as a routine.
What is the tape, and why does it set your risk?
The tape is how unusually much the market is moving. Traders call the size of the moves volatility, and the tape comes in three moods: calm, normal and uncertain. The tape says how big the moves are, not whether the trend will last. It answers a different question: how hard should you press?
The doctrine is plain. During times of uncertainty, be defensive: smaller size, wider stops, and suspicion of every signal. When uncertainty falls back to lower levels, you can play aggressive again. A calm tape inside a backed trend is where a trader can press hardest, and an uncertain tape asks for patience whatever the trend says.
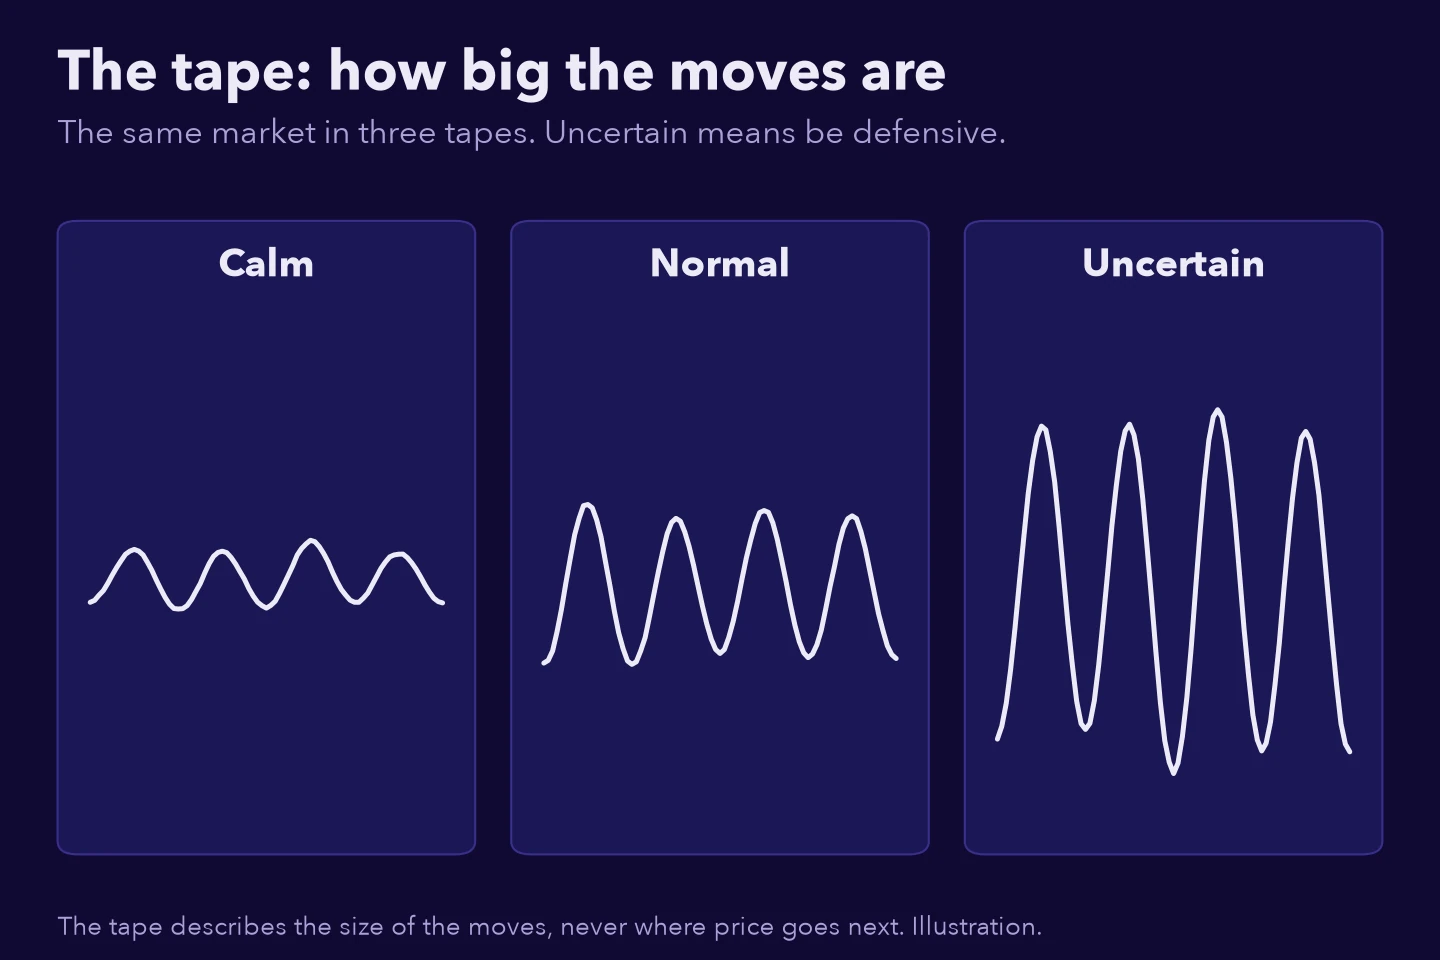
Size is where this matters most. Our piece on position sizing under volatility shows the arithmetic of a smaller position when the moves get bigger.
Which tactics fit which regime?
Match the tactic family to the regime before you look for an entry. A backed trend favours trend tactics. A mixed market favours range tactics, or no trade at all. The tape then sets how aggressive the plan may be. Four combinations cover most of what a market does.
- Backed uptrend: buy pullbacks, let winners run, and leave shorting strength to others.
- Backed downtrend: sell rallies, and treat every bounce as suspect until the trend ends.
- Mixed: trade the edges of the range with tight plans, or stand aside.
- Uncertain tape: cut the size and widen the stops, whichever regime you are in.
The no-trade day belongs on that list too. In a mixed market with an uncertain tape, waiting is a position.
What should you do when a trend fades?
Stop adding to it. A fading trend is still a trend, but leaning on it now asks more of your plan than it did at the start. Keep the position you already planned, protect it with the stop you already wrote, and let your levels decide the rest.
Fading is not a reason to bet on a reversal either. A trade against the trend is a new trade, so it needs its own setup, its own level and its own stop.
What do probability points mean?
Probability points are a 0 to 5 grade for how strong an indicator’s reading is. For a regime read, they describe how firmly a read like the one on screen has persisted in the past, never where price goes. More points mean a firmer read, and an unlit meter means no edge to lean on.
MCP uses the same 0 to 5 scale on every tool in AI Indicators by MCP. MCP Regime Ribbon grades each regime read with a machine-learning model inside, on the charts where the research confirmed it. A grade is a reason to weigh a read, never a reason to skip your plan.
What probability points are not
- Not a forecast of direction, a price target or a timing call.
- Not a promise about the next candle.
- Not an entry or an exit on their own.
How do you read a market regime, step by step?
Read the regime as a short routine, in a fixed order, before every trade. The order matters because each step narrows the next one. The regime picks the tactic family, the tape picks the size, and only then does a setup earn your attention. Five steps keep it honest.
- Name the regime: a backed uptrend, a backed downtrend, or mixed.
- Check that the bigger picture agrees before you call it a trend.
- Read the tape: calm, normal or uncertain.
- Pick the tactic family that fits, or decide to wait.
- Size for the tape, and write your invalidation before you enter.
Common market regime mistakes
- Fading a strong trend because it looks stretched.
- Buying breakouts from the centre of a range.
- Treating a short-term swing that fights the bigger picture as a new trend.
- Keeping full size when the tape turns uncertain.
- Reading a moving-average cross as a change of regime.
Practice this
Open a chart you already follow and scroll back a few months. Mark each stretch as trend or range, then check what a slower chart was doing at the time. Note where the moves turned unusually large. Then ask which tactic family suited each stretch, and how big the size should have been.
Where does MCP Regime Ribbon fit?
MCP Regime Ribbon is the ParadiseTeam’s TradingView indicator for the regime question. It names the regime in plain words, grades each read with probability points and keeps the tape as a separate read. It is the first layer under every other tool, and it is included with PRO Paradiser.
Next step
See it on a chart: how to use MCP Regime Ribbon
FAQs
What is a market regime in trading?
A market regime is the state a market is in for a stretch of time. It is trending up, trending down or mixed, and its moves are calm, normal or uncertain. A regime does not forecast price. It tells you which kind of tactic fits, and how much risk the conditions can carry.
How do you know if a market is trending or ranging?
Read the swings, then the bigger picture. A trend keeps setting new highs or new lows, and pullbacks stall before they undo the last swing. A range keeps returning to its middle. If a slower chart points the other way, treat the move as mixed, not as a trend.
What is a ranging market?
A ranging market moves sideways between support and resistance instead of trending. Swings overlap, price keeps returning to the middle, and breaks of either edge often snap back inside. Range tactics fit it: trading the edges with tight plans, or standing aside until a backed trend appears.
Should you trade when volatility is high?
You can, but be defensive. When the moves turn unusually large, use smaller size, wider stops and more suspicion of every signal. High volatility says how big the moves are, not which way price goes. When the market calms down again, a more aggressive plan becomes reasonable.
Can a market trend on one chart and range on another?
Yes, and it happens all the time. A short-term chart can trend up while a slower chart sits in a downtrend. That short-term trend is a counter-trend move until the bigger picture agrees. Name the regime on the chart you trade, then check the slower charts before you lean on it.
Risk disclaimer: Crypto trading involves substantial risk of loss. This class is education only, not financial advice. Never trade with money you cannot afford to lose. Past results do not guarantee future results.










Join the discussion
No comments yet. Members, share how you are reading this.