


Hidden Divergence Explained
In short
Hidden divergence is a momentum signal indicating trend continuation. Hidden bullish divergence occurs in an uptrend when price forms a higher low and an oscillator forms a lower low. Conversely, hidden bearish divergence appears in a downtrend when price forms a lower high and an oscillator forms a higher high.
Crypto trading is a tough nut to crack because it requires absolute devotion, a strategic approach, and discipline from traders. Some of the most successful traders will tell you that spotting hidden divergences is one of the most powerful skills you can master.
In this article, we’ll walk you through a straightforward method to identify hidden bullish & bearish divergence setups. By the end, you’ll be equipped with the knowledge to uncover these hidden signals and make more informed trading decisions.
Let’s dive into the world of hidden divergences and unlock the potential for smarter trades:
Introducing Divergence:
Divergence simply means a deviation from the norm, providing clues about potential shifts in market trends. In crypto trading, divergences occur when the price of an asset moves differently from an indicator, often an oscillator like the Relative Strength Index (RSI) or the Moving Average Convergence Divergence (MACD). These tools are favored for their ability to signal future price movements before they become evident on the charts.
Oscillators are leading indicators, meaning they can predict potential market moves ahead of time. This makes them ideal for spotting divergences, as opposed to trend indicators that lag behind the market. By identifying when the price action diverges from the oscillator’s movement, traders can anticipate trend reversals or continuations.
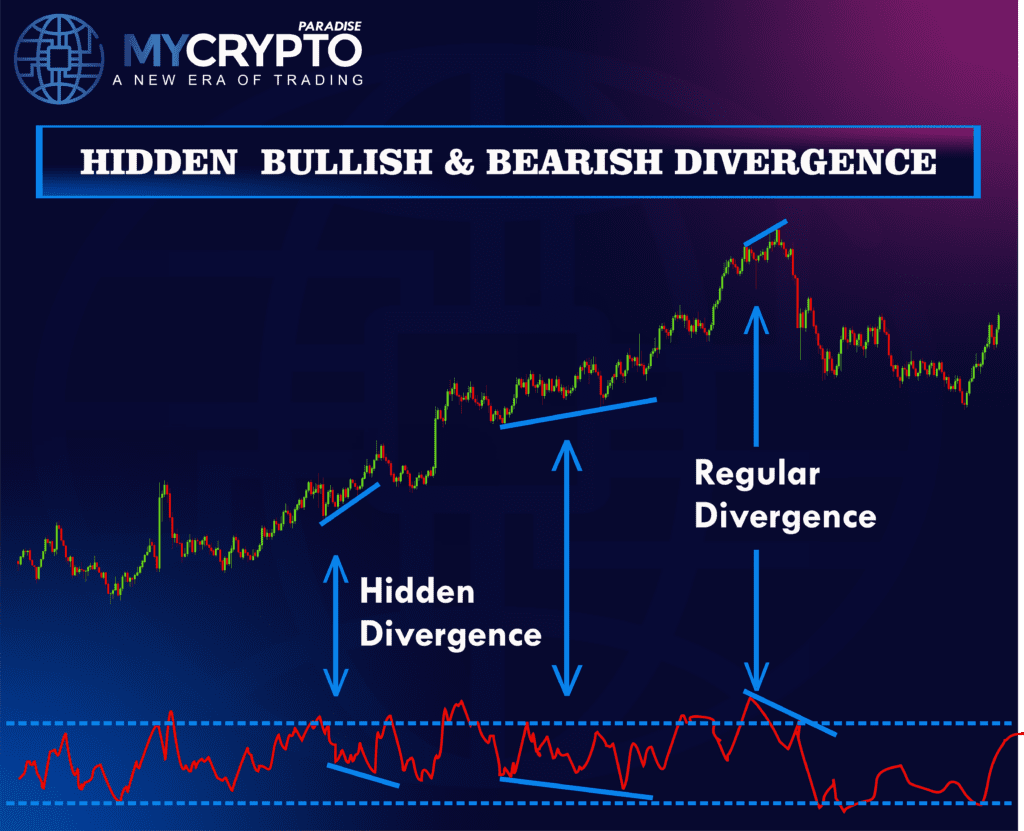
A divergence setup is identified when the peaks and troughs of the price chart move in the opposite direction from the peaks and troughs of the oscillator’s signal line. This can be either bullish or bearish. Bullish divergences suggest that a downtrend may reverse into an uptrend, while bearish divergences indicate that an uptrend might reverse into a downtrend.
In our previous blogs, we have covered Bullish Divergence & Bearish Divergence. In the upcoming sections, we will explore how to spot hidden bullish & bearish divergence setups on your charts. This will enhance your ability to make informed trading decisions. Let’s understand the hidden divergence first:
What is Hidden Divergence?
Hidden divergence is a subtle yet powerful signal that suggests the continuation of the current trend. Unlike regular divergence, which hints at a potential reversal, hidden divergence indicates that the prevailing trend is likely to persist. This type of divergence occurs when the price makes a higher low in an uptrend or a lower high in a downtrend, while the oscillator forms a lower low or a higher high, respectively.
Hidden divergence can be a valuable tool for traders looking to ride the trend longer and maximize their gains. By spotting these hidden signals, you can confidently stay in your trades, knowing that the market is likely to move further in your favor. In the following sections, we’ll show you how to identify hidden bullish and bearish divergences on your charts, providing you with a strategic edge in your trading journey.
How to Spot Hidden Bullish & Bearish Divergence?
Spotting hidden bullish & bearish divergence is a crucial skill for traders looking to confirm the continuation of trends. These subtle signals can help you stay in trades longer and avoid premature exits. Here’s an in-depth guide to identifying these powerful indicators on your charts.
Hidden Bullish Divergence
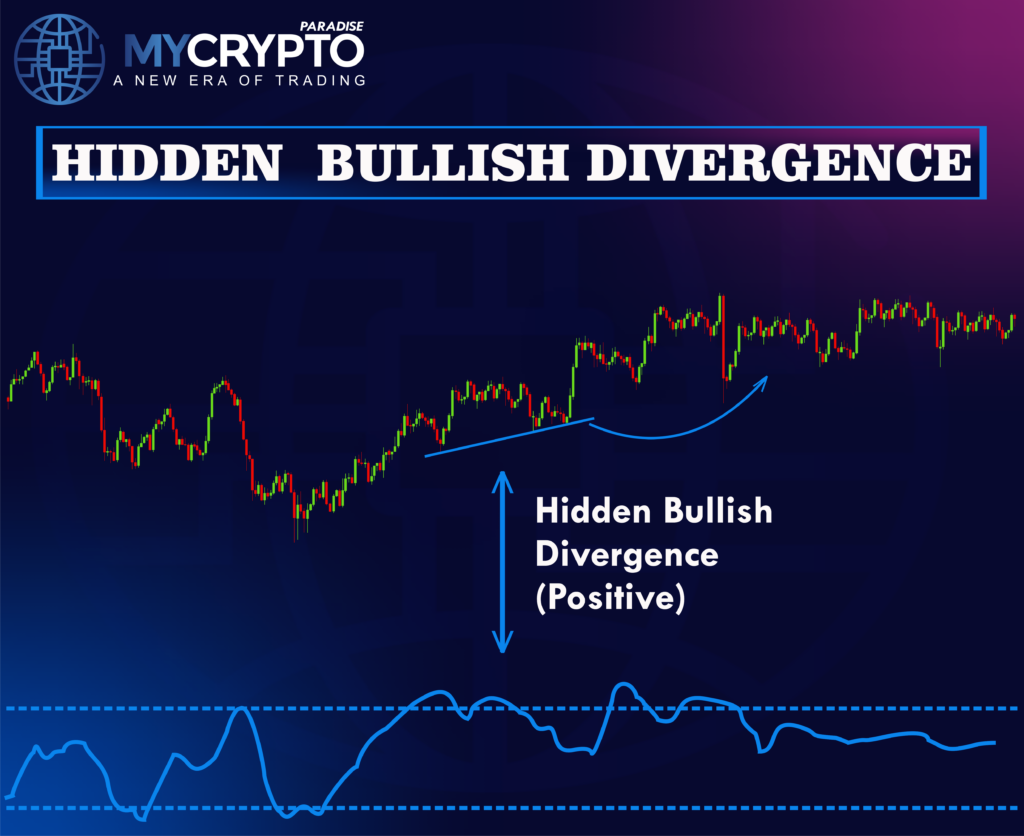
A hidden bullish divergence occurs in an uptrend when the price forms a higher low, but the oscillator (like RSI, MACD, or Stochastic) forms a lower low. This discrepancy suggests that, despite what appears to be weakening momentum, the upward trend is likely to continue.
Steps to Spot Hidden Bullish Divergence:
- Identify the Uptrend: You need to ensure the market is in an uptrend by observing higher highs and higher lows on the price chart.
- Higher Low in Price: After the uptrend confirmation, you need to look for the price to pull back and form a higher low, indicating a temporary retracement.
- Lower Low in Oscillator: At the same time, check if the oscillator forms a lower low. This indicates that the pullback has more perceived weakness in the momentum indicator than in the price itself.
- Confirm the Signal: Once these conditions are met, you have identified hidden bullish divergence. This signal suggests the uptrend will likely continue and provide a buying opportunity or a chance to add to your existing long positions.
Hidden Bearish Divergence
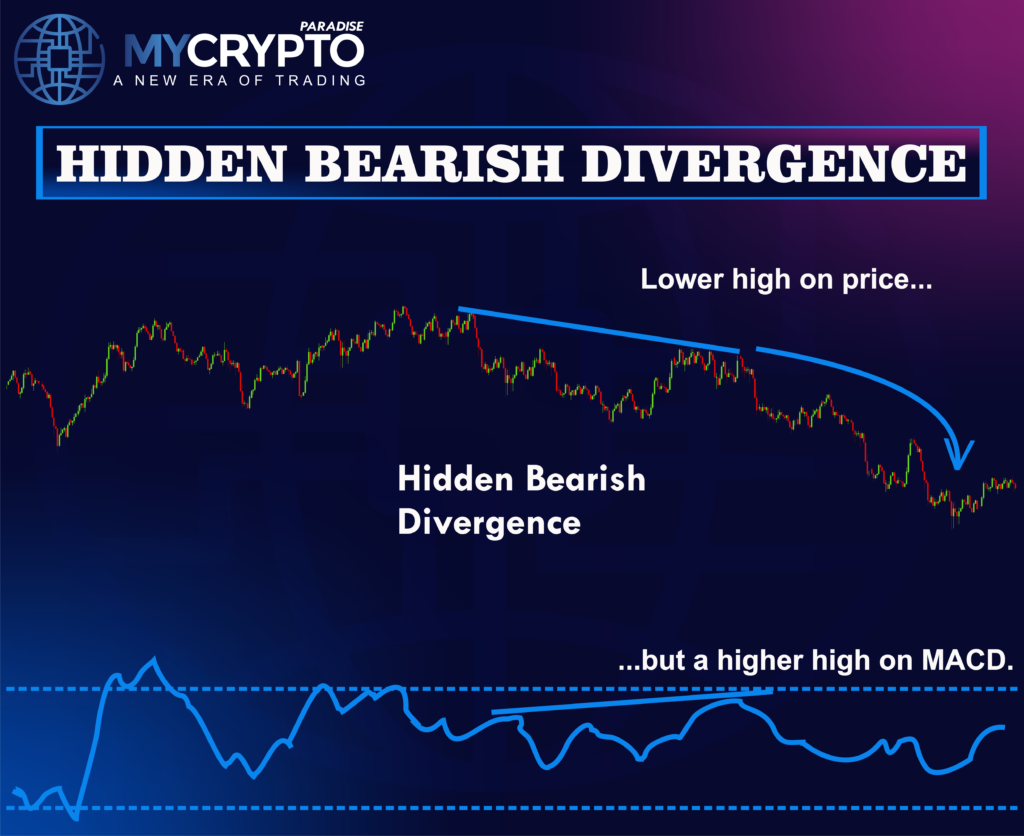
A hidden bearish divergence occurs in a downtrend when the price forms a lower high, but the oscillator forms a higher high. This indicates that despite the oscillator showing potential strength, the downward trend is expected to persist.
Steps to Spot Hidden Bearish Divergence:
- Identify the Downtrend: First of all, you need to confirm the market is in a downtrend by observing lower highs and lower lows on the price chart.
- Lower High in Price: Once the downtrend is confirmed, you need to look for the price to retrace and form a lower high which suggests a temporary upward correction.
- Higher High in Oscillator: Simultaneously, check if the oscillator forms a higher high. This indicates that the retracement has more perceived strength in the momentum indicator than in the price itself.
- Confirm the Signal: Once these conditions are met, you’ve identified hidden bearish divergence. This signal suggests the downtrend will likely continue and provide a selling opportunity or a chance to add to your existing short positions.
Expert Tips to Increase Visibility of Hidden Divergences:
Following are some of the extra steps that you can take to increase the visibility of your hidden bullish & bearish divergence:
- Use Multiple Time Frames: Analyzing multiple time frames can help confirm hidden divergences. For instance, a hidden divergence on a higher time frame can provide stronger signals than on a lower time frame.
- Combine with Other Indicators: Strengthen your analysis by combining hidden divergence with other technical indicators, such as moving averages or trend lines.
- Practice Patience: Hidden divergences can be subtle and take time to develop. Patience is key to accurately identifying and acting on these signals.
- Consult With Experts: If you’re new to all this, you can consult with the Professional Traders of ParadiseTeam.
How to Trade Hidden Bullish & Bearish Divergence with MACD?
The Moving Average Convergence Divergence (MACD) indicator is a popular tool for identifying hidden divergences and confirming trend continuations. Here’s a detailed guide on how to trade hidden bullish and bearish divergences using the MACD.
Trading Hidden Bullish Divergence with MACD
A hidden bullish divergence occurs when the price forms a higher low while the MACD forms a lower low, indicating that the uptrend is likely to continue.
Steps to Trade Hidden Bullish Divergence with MACD:
- Identify the Uptrend: Confirm that the market is in an uptrend by observing higher highs and higher lows on the price chart.
- Spot the Divergence: Look for the price forming a higher low while the MACD histogram or MACD line forms a lower low.
- Entry Point: Enter the trade when the MACD histogram starts to rise or the MACD line crosses above the signal line, indicating renewed bullish momentum.
- Place Stop-Loss Orders: Place a stop-loss order below the recent swing low to protect against potential downside risk.
- Set Profit Targets: Set profit targets based on previous resistance levels or use a trailing stop to capture more gains as the uptrend continues.
You can join us at ParadiseFamilyVIP 🎖️ for consistent profits and professional crypto trading insights. Join now!!
Trading Hidden Bearish Divergence with MACD
A hidden bearish divergence occurs when the price forms a lower high while the MACD forms a higher high, suggesting that the downtrend is likely to continue.
Steps to Trade Hidden Bearish Divergence with MACD:
- Identify the Downtrend: Confirm that the market is in a downtrend by observing lower highs and lower lows on the price chart.
- Spot the Divergence: Look for the price forming a lower high while the MACD histogram or MACD line forms a higher high.
- Entry Point: Enter the trade when the MACD histogram starts to fall or the MACD line crosses below the signal line, indicating renewed bearish momentum.
- Place Stop-Loss Orders: Place a stop-loss order above the recent swing high to limit potential losses.
- Set Profit Targets: Set profit targets based on previous support levels or use a trailing stop to protect profits as the downtrend continues.
Conclusion:
You have now learned how you can spot hidden bullish & bearish divergence and use this powerful strategy to improve your trading skills. By incorporating indicators like MACD, even beginners can recognize these subtle signals and leverage them for better market entries and exits. So, better do it now.
The knowledge you’ve gained from this article is an excellent starting point, but it won’t be enough to secure long-term profitability as a trader. While it can provide an edge, transforming this into consistent success over the next 3+ years requires integrating proper trading strategies and tactics.
At ParadiseFamilyVIP 🎖️, we combine technical analysis, on-chain insights, sentiment monitoring, and an understanding of whale psychology with effective trading methods to deliver reliable crypto signals and portfolio management.
👉To check availability in ParadiseFamilyVIP 🎖️ (Click it)
Our service is premium and tailored for traders with adequate capital. For beginners, we recommend starting with our FREE Telegram channels to build your skills and foundation.
Hidden Divergence FAQ
What is hidden divergence?
Hidden divergence is a signal that the current trend is likely to continue rather than reverse. It occurs when price and an oscillator such as RSI or MACD move in opposite directions during a pullback within the prevailing trend.
How does hidden divergence differ from regular divergence?
Regular divergence hints at a possible trend reversal, while hidden divergence suggests the existing trend will persist. Hidden divergence forms on retracements, helping traders stay in trades longer rather than exit early.
How do you spot hidden bullish divergence?
Confirm an uptrend with higher highs and higher lows, then watch for price to form a higher low while the oscillator forms a lower low. That mismatch suggests momentum weakness is temporary and the uptrend should continue.
Can you trade hidden divergence with MACD?
Yes. For a hidden bullish setup, enter when the MACD line crosses above its signal line or the histogram turns up after price makes a higher low. Place a stop below the recent swing low and set targets at prior resistance.
Crypto trading involves substantial risk of loss. This article is educational and is not financial advice. Past performance does not guarantee future results. Always do your own research.
What is different here
Most guides stop at the theory. The MyCryptoParadise team shares the live trades, and the reasoning behind each one, inside ParadiseFamilyVIP. Everything here is education, not financial advice.
Crypto trading involves substantial risk and is not suitable for everyone. Nothing here is financial advice; it is education only. Never risk more than you can afford to lose.


Join the discussion
No comments yet. Pro Paradiser members, share how you are reading this.