



In short
MCP Precision Fibonacci is a Fibonacci indicator for TradingView from AI Indicators by MCP. It draws the map of the latest impulse leg: four levels with their prices. They are the golden zone’s edges at 0.618 and 0.786, and the extensions at 1.272 and 1.618. When price runs on, the map follows the move in progress and says so. It speaks at the golden-zone test, when a pullback into the zone holds on the close. MCP Precision Fibonacci grades each golden-zone test with a machine-learning model inside, on the charts where the research confirmed it. Use it as a location read for the plan you already trade, never as an entry on its own.
What is MCP Precision Fibonacci?
MCP Precision Fibonacci is an indicator in AI Indicators by MCP, built by the ParadiseTeam and included with PRO Paradiser. It answers the location question: where is price on the market’s map? It works on any chart, and its one setting only moves the level names.
Versus a simple Fibonacci retracement
A Fibonacci retracement drawing shows where the levels are. You pick the move, it draws the lines, and you redraw it when the market moves on.
MCP Precision Fibonacci keeps the map of the latest impulse leg up to date for you, and follows a move still in progress. It speaks when a pullback tests the golden zone, and it grades that test from 0 to 5.
In one line: the drawing shows the levels. The indicator shows the levels, the test and how firmly a test like this one has held.
New to the idea itself? The free class on the Fibonacci golden zone explains the zone, the stop and the targets without any tool.

How do you add MCP Precision Fibonacci to your chart?
MCP Precision Fibonacci is an invite-only script on TradingView, included with PRO Paradiser. A free TradingView account is enough. Once the ParadiseTeam has added the script to your account, it appears under invite-only scripts in the Indicators menu, ready for any chart.
It also unlocks with MCP Tokens, which a MyCryptoParadise account earns by playing on the website. How MCP Tokens work.
- Join PRO Paradiser, the membership that includes the indicator.
- Leave your TradingView username on your members’ page.
- The ParadiseTeam adds the script, usually within a day.
- On TradingView, open Indicators, then Invite-only scripts.
- Add MCP Precision Fibonacci to any chart. Its legend on the chart reads MCP Fib.
Every member sees the same map on the same chart. The one setting, Label distance (candles), only moves the level names further from the newest candle. Keep the timeframe you already trade; where a chart carries no grade, the panel says so.
When the indicator is updated, a chart keeps the version it was added with. Refresh the page and click the round update mark beside the indicator’s name to move to the latest version. Removing the indicator and adding it again does the same.
What does it draw on the chart?
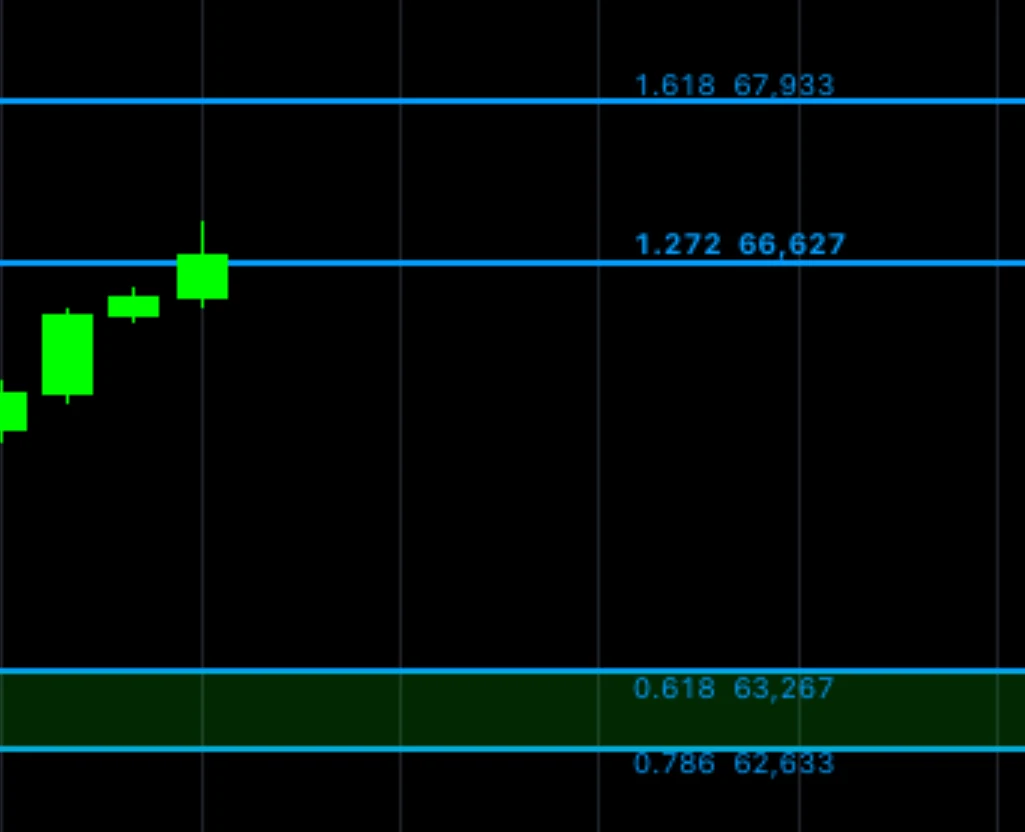
It draws one impulse leg as a map with four blue level lines. The 0.618 and 0.786 lines are the edges of the golden zone, and the 1.272 and 1.618 lines are the extensions. Each line carries its name and price near the right edge, and a dotted line joins the leg’s start to its end.
The panel’s hover names those two ends in the tool’s own words: level 1, where the leg starts, and level 0, where it ends. Neither has a line of its own. A name sits just above its line when the level is above price, and just below it when the level is below price.
What does the colour of the golden zone say?
The golden zone’s colour shows the side of price. It is red when the zone sits above the last closed candle, where the panel lists it as resistance. It is green when the zone sits below that candle, as support. With the last close inside the zone, the band keeps the leg’s own colour.
Inside the zone, green means an up-leg and red a down-leg. When a leg is over, its band stays as faint history in its own colour. It leaves the chart once a candle closes through it. On a confirmed leg, a target that price has already reached turns thin and dim.
What does the R in a target’s hover mean?
Hover the 1.272 or 1.618 name to see an R beside its price. It is that target’s reward-to-risk from the last closed candle, with level 1 as the stop reference. It changes with price, and shows only while the last close sits between level 1 and that target. It is planning geometry, not a call.
Treat it as the map’s own reference. Your real reward-to-risk comes from your actual entry and stop. Our explainer on the risk/reward ratio shows the arithmetic.
How does the map follow a move in progress?
The chart shows a confirmed leg, with two exceptions. In those two cases it follows the move in progress instead. One is after a leg’s 1.618 was reached while no read is open. The other is when a leg’s start is lost and the chart draws the new move. Such a leg is not confirmed yet.
Row two of the panel then reads Up-leg running or Down-leg running. A leg that is not confirmed yet follows price on closed candles, and its four levels move with it. It leaves the chart once a candle closes beyond its start. If a candle closes through its golden zone, row two reads Golden zone lost instead.

What does a leg that is not confirmed yet mean for you?
It means the map is still being drawn by the move. The four levels can shift on each close while price runs on, so a level you noted earlier may have moved. Read them as the shape of the move on screen, and check them again on each close before you plan around them.
Why can all four lines sit on one side of price?
Because a pullback inside a standing leg is not followed: the leg stays until its start is lost. A pullback can take price beyond the golden zone while the start still holds, and all four lines then sit on one side of price. The panel still names the other side: the leg’s own start or end.
How do you read the panel?
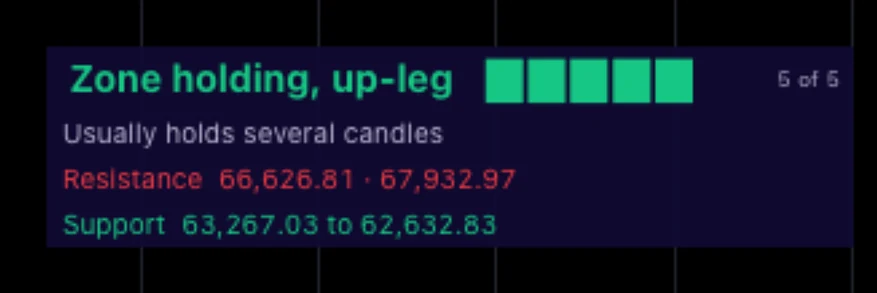
The panel sits at the bottom right and reads the last closed candle. It has four rows. Line one names the read, with five probability points and a small count beside it. Row two says what to expect, or where price sits on the leg. Rows three and four list the levels as Resistance and Support.
Line one: the read
Line one reads Zone holding, up-leg in bold green while a golden-zone test on an up-leg is carried. On a down-leg it reads Zone holding, down-leg in bold red. With no read it says No zone test, and Collecting history while the chart’s first impulse leg is not in place yet.
Two more kinds of line one appear in white, not bold. Zone lost, up-leg or down-leg, means a candle closed through the test’s zone while the read is still open.
Earlier zone, up-leg or down-leg, means the tested leg is no longer the leg on the chart. Row two tells whether that zone still holds. It reads Golden zone lost once the zone has given way.
The probability points and the count
Five small blocks sit beside line one. They light green on an up-leg and red on a down-leg, up to the grade. A small count beside them reads from 0 of 5 to 5 of 5.
Where a chart carries no grade, the blocks stay unlit and the count stays blank. After Zone lost, the meter is unlit too, and the points stay in the data window.
Row two while a read is carried
A test with points reads Usually holds several candles in row two. Zone in play means the test has no points. Either it was graded at zero, or the chart carries no grade and the test is described, not graded. Once a candle closes through the test’s zone, row two reads Golden zone lost.
Row two with no read: where price sits
With no read carried, row two says where the last closed candle sits on the map. These words describe the map, and your plan decides what they mean for a trade.
- Up-leg running or Down-leg running: the leg on the chart is not confirmed yet.
- Above the golden zone (up-leg) or Below the golden zone (down-leg): price is past the zone, on the side of the leg’s end.
- Approaching the zone or Inside the golden zone: price is nearing the band, or the last close sits in it.
- Golden zone lost: the last close went through the zone, toward level 1.
- 1.272 reached or 1.618 reached: price has reached that extension of the leg.
- Waiting for the next swing: there is no leg to map right now.
Just after an event, row two turns gold for a moment and names it: Golden zone tested, or Level 1 lost. Then it returns to the read.
Rows three and four: Resistance and Support
Resistance, in red, lists the nearest levels of the leg on the chart above the last closed candle, the nearest first. Support, in green, lists those below it. When both edges of the golden zone sit on one side, the row shows the zone as a range.
Each row shows at most the nearest two entries on its side, and the golden zone’s range counts as one. The levels beyond them stay on the chart as lines and labels.
Where a side has none of the four levels, the row names the leg’s own start or end on that side instead. Where neither lies there, the row gives the furthest price the move has reached on that side. With no leg on the chart, both rows stay empty.
The hover
Hover the panel for the full reading. It names the read, what would end it, and how firmly a test like this one has held. It lists the map of the leg on the chart with every price, level 1 and level 0 included. It also says when the leg is not confirmed yet.
Every hover ends on the same reminder. The read describes where price sits on the leg’s map, never where it goes next, and it is not an entry or exit call.
What happens at a golden-zone test?
A test happens when price pulls back into the golden zone and the candle closes on the zone’s side. A tiny triangle marks the candle: green below it on an up-leg, red above it on a down-leg. A Golden zone held label names the test, at most once per leg; later drawn tests show the triangle only.
The label turns to a grey Golden zone lost when a candle closes through its zone soon after the test. After that it stays as it is. The label is the record of the test; the panel is the current read. So a label that still says Golden zone held never proves the zone holds now.

A test with points is drawn, and so is a test where a chart carries no grade. A test graded at zero stays off the chart: the panel names it with Zone in play, an unlit meter and 0 of 5.
While a drawn read is carried, a dotted line marks level 1, where the leg starts, as it stood at the test. That is the line to watch.
What do the probability points mean, and what do they not mean?
The points answer one question: how firmly has a golden-zone test like this one held in the past? More points mean a firmer history. MCP Precision Fibonacci grades each golden-zone test with a machine-learning model inside, on the charts where the research confirmed it.
Zero points is a complete answer: golden-zone tests like this one have held less often than a typical one. The grade describes the test, and price is still the chart above it. As the hover puts it: past behaviour, not a promise.
Three things the points are not. They are not a forecast of direction or a price target. They are not a promise about the next candle. And they are not an entry or an exit on their own: they grade the test, and your plan does the rest.
What ends a read?
A read ends when a candle closes beyond level 1 as it stood at the test, or when it fades after a while. If a candle closes beyond level 1 while a drawn read is carried, row two names it in gold: Level 1 lost. The matching alert fires too.
A read can lose its zone first. When a candle closes through the test’s zone, line one turns to Zone lost and the meter goes unlit. The read stays open until level 1 is lost or the read fades. A read graded at zero ends quietly, with no gold line and no alert.
The hover names the end in advance, so you know that price before you plan. A lost level 1 is as much information as the test was.
Which alerts can you set?
Six alerts are built in. Set them to Once per bar close in the TradingView alert dialog, then open the chart when one fires and read the panel. The two test alerts fire only for drawn tests, never for a test graded at zero.
- Golden zone tested, up-leg and Golden zone tested, down-leg: a drawn test on the close.
- Origin lost after the golden zone test: a candle closed beyond level 1, the start of the leg whose zone had held. That read is over.
- 1.272 extension reached and 1.618 extension reached: once per confirmed leg, on the first reach. A leg that is not confirmed yet sends none.
- Any Fibonacci event: the drawn tests and their ends in one alert.
An alert created before the update of November 2026 keeps the earlier behaviour until it is created again. To get the extension alerts as described here, create them again in place of the old ones. Every alert message ends the same way: education, not financial advice.
How do you use it in a trade?
Treat it as the location layer of a plan you already have. It shows where price sits on the leg, when a test happened and how firmly a test like this one has held. Your levels and your plan pick the entry, and the map shows the stop reference and the targets.
- Read the map: the leg, the golden zone, the extensions, and Resistance and Support.
- Check row two: a running leg’s levels still move on each close.
- Wait for the test: line one turns to Zone holding, with its points.
- Open the hover: what would end the read, and every price of the map.
- Time your entry with your own method, such as MCP RSI Intelligence for momentum.
- Write the stop beyond level 1, and size the position from that distance.
Let the points set your attention, never your size. Your drawdown budget still decides how much you risk on any one idea.
To practise the routine, PRO Paradisers have MCP Precision Fibonacci MasterClass Level 1. It holds twelve drills on real past charts, with a tutor that helps in three steps.
What can it not do?
MCP Precision Fibonacci maps the latest impulse leg, follows a move in progress and reads the golden-zone test, and that is its whole job. It reads what price has done at the zone; what price does next is yours to judge. Entries, exits, stops and forecasts stay with you and your plan.
- A fresh chart shows Collecting history until its first impulse leg is in place.
- A pullback inside a standing leg is not followed, so all four lines can sit on one side of price.
- Up-leg running or Down-leg running can still show for a while after the move has stopped.
- On a coin that has fallen very far, a level at or under zero has no price and is not drawn.
- Long quiet stretches are normal: the panel speaks at the test and describes price in between.
AI Indicators by MCP
MCP Precision Fibonacci is live for PRO Paradisers.
Frequently asked questions
Does MCP Precision Fibonacci repaint?
Its reads and triangles never repaint: they settle on closed candles. Two things are meant to move. A leg that is not confirmed yet follows price on closed candles, and its levels move with it. And a Golden zone held label can turn to Golden zone lost soon after its test.
What does Up-leg running mean?
It means the leg on the chart is not confirmed yet. It shows after a leg’s 1.618 was reached with no read open, or after a leg’s start was lost. Its levels move with price on closed candles, and it leaves the chart once a candle closes beyond its start.
Why is nothing drawn when the panel names a read?
Because a test graded at zero points stays off the chart. The panel names it with Zone in play, an unlit meter and 0 of 5, and the chart stays free of marks. Zero points is still an answer: golden-zone tests like this one have held less often than a typical one.
What does the R in a target’s hover mean?
Hover the 1.272 or the 1.618 name to see it. It is that target’s reward-to-risk from the last closed candle, with level 1 as the stop reference. It shows only while the last close sits between level 1 and that target. It is planning geometry, not a call.
Which charts does MCP Precision Fibonacci work on?
Any chart, spot and perpetual charts alike. Keep the timeframe you already trade; where a chart carries no grade, the panel says so. A fresh chart shows Collecting history until its first impulse leg is in place, and then the panel starts reading. The one setting only moves the level names.
Crypto trading involves substantial risk and is not suitable for everyone. Nothing here is financial advice; it is education only. Never risk more than you can afford to lose.











Join the discussion 10
so the price tags and their R are the bit I keep rereading, since I price everything in sats anyway. Does the panel let you show those R values in sats, or only in fiat?
honestly the bit that got me was the leg, i kept drawing it from the wick instead of the close and couldnt work out why my levels kept drifting
Drawing from the wick is the same mistake as pricing a motorcycle in last month's pesos. Anchor to the close and the drift usually stops... or at least it stopped for me.
Ah, same thing happened to me with the wick, Anna.... I only caught it when I went back through my journal and saw the levels moving every time a candle spiked. Worth checking whether the drift shows up on the close-to-close leg too, or only on the wick version....
been watching lines like these since 2012 and the clean ones always pull people in fastest.... how many alerts does the panel throw before you start ignoring them?
I keep mixing up the golden zone with the 0.618 line when I first set it up.... so the part about the price tags and their R helped me see what the numbers actually mean. Would you mind if I asked how you usually check the leg before trusting it?
Honestly my grandmother would have liked the price tags idea... she kept her sovereigns in a sock, so I get the instinct to check the last swing before trusting anything. Still want to see how the R numbers hold up on a choppy night session....
samuel the golden zone vs 0.618 mixup is so relatable, i did the exact same thing in my notes for weeks. honestly teaching this part feels like paying back the teacher who bought my train ticket
Mostly agree, though my own habit was redrawing the leg every morning until the alerts forced me to commit to one set of points. Stopping that mattered more to me than any zone on the chart.
Reminds me of my grandmother pricing weddings in gold bracelets, always checking the last swing before she trusted a number..? Samuel, that golden zone and 0.618 mix-up is common, it took me a while too.