



In short: Absorption is heavy buying or selling that fails to move price through a level. Selling absorbed at support is how accumulation shows on a chart; buying distributed at resistance is how distribution shows. Neither is a signal on its own. What matters is whether the level holds, or gives way, on the candles that follow.
Most traders read heavy selling as weakness and heavy buying as strength. Yet some of the most useful moments on a chart are the opposite: heavy pressure that goes nowhere. When a push fails at a level, that failure is information.
MyCryptoParadise is a professional crypto signals and trading education service operating since 2016. This MCP University FREE class reads absorption the way the ParadiseTeam does. The level first, then the pressure, then price’s answer, and only then a plan.
What is absorption in trading?
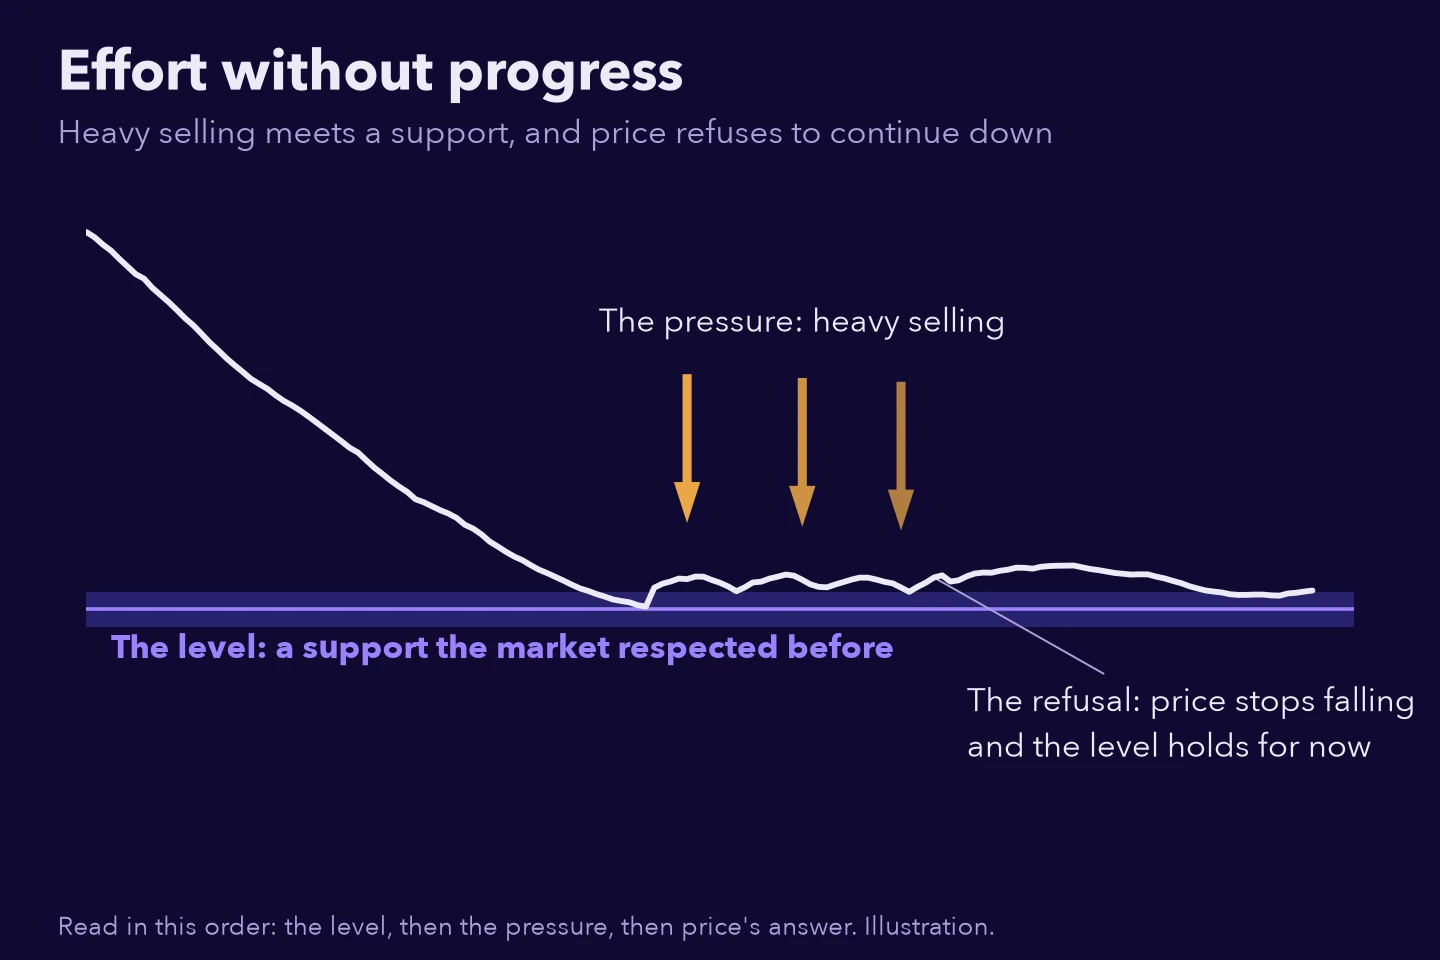
Absorption in trading is heavy one-sided pressure that meets a level and fails to move price through it. Sellers press into a support, yet price refuses to continue down and the level holds. The selling did not vanish. It was met, and the move stalled there.
A useful shorthand is effort without progress. Heavy pressure is the effort, and price movement is the progress. When a lot of effort produces very little progress at a level, the pressure is being absorbed. The idea is about a century old, and ChartSchool’s Wyckoff method tutorial covers Richard Wyckoff’s original version of it.
Where does absorption show on a chart?
At a level the market has respected before: a support below price or a resistance above it. Heavy pressure arrives, and price refuses to continue in its direction. That is the whole idea. Away from a level, heavy pressure is just a busy market, not absorption.
- The level: a support or a resistance the market has respected before.
- The pressure: heavy one-sided selling or buying pressing into that level.
- The refusal: price refuses to continue in the direction of the pressure.
What is the difference between accumulation and distribution?
Accumulation is selling being absorbed near the lows: heavy selling meets a support and price stops falling. Distribution is buying being absorbed near the highs: heavy buying meets a resistance and price stops rising. On a chart they are mirror images of the same event, so you read them the same way.
- Selling absorbed at support: the accumulation read. Heavy selling pressed into a support, and price refused to continue down.
- Buying distributed at resistance: the distribution read. Heavy buying pressed into a resistance, and price refused to continue up.
- Neither: the pressure broke the level, or it never reached one. That is a move, not absorption.
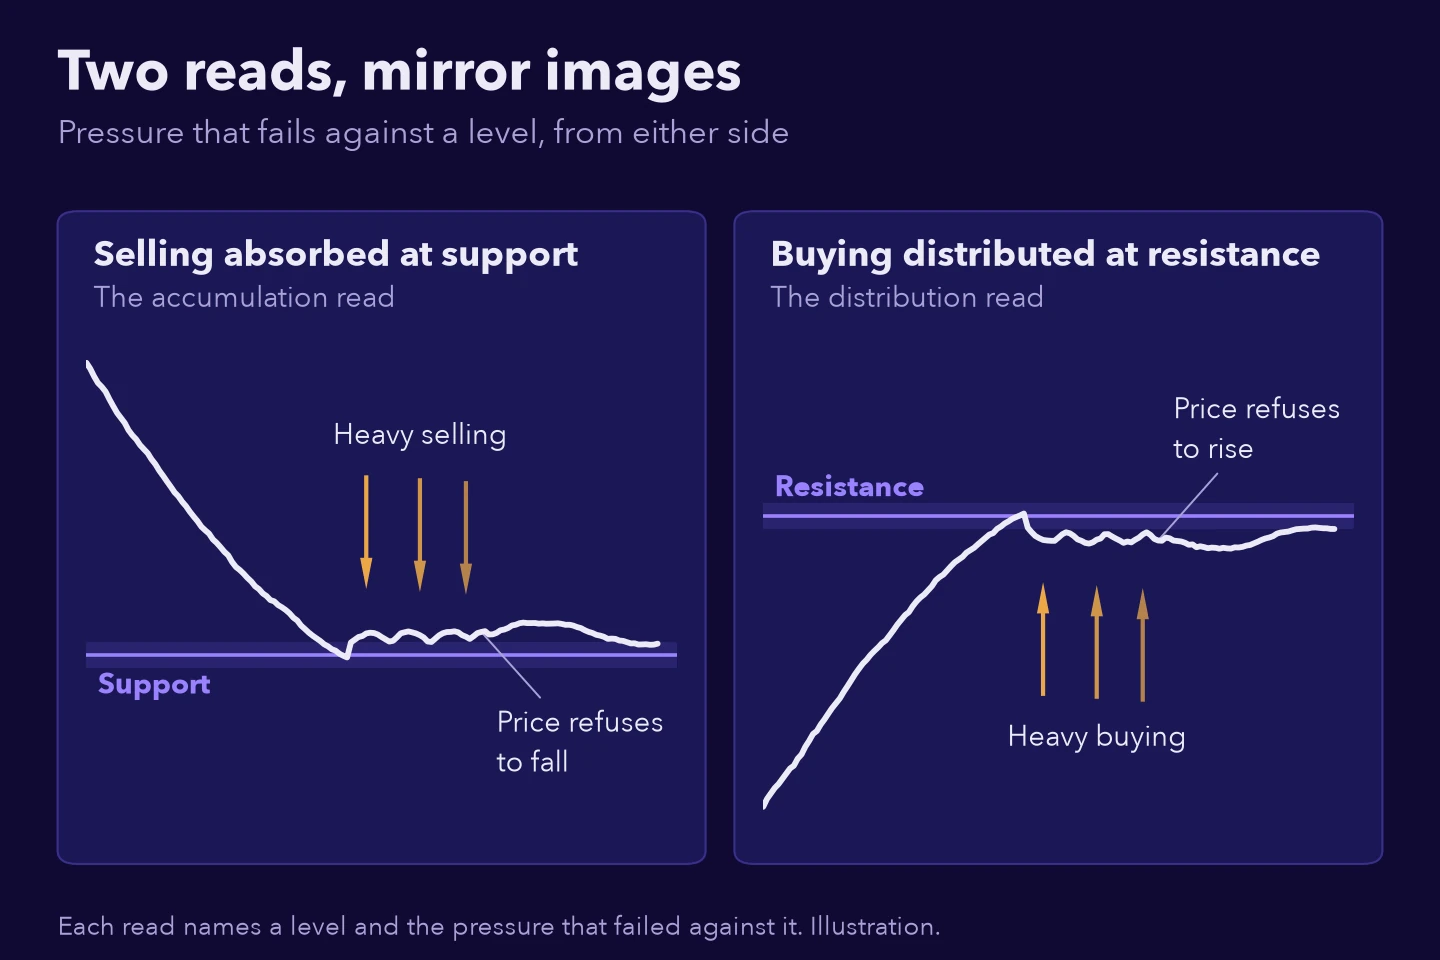
These two reads are the close-up version of a much bigger picture. Wyckoff described whole market phases built on them, and our classes on Wyckoff accumulation and how a Wyckoff distribution top forms walk through those phases. This class stays with one moment at one level.
What is an accumulation zone?
An accumulation zone is a price area where heavy selling keeps getting absorbed, so price stops falling there. It usually forms around a support the chart has respected before. It shows where supply was met, not when price turns, and a zone can still give way.
Is absorption bullish or bearish for price?
Not on its own. An absorbed support is not a buy signal, and a distributed resistance is not a sell signal. Absorption says the pressure failed at that level on that candle. It says nothing about where price goes next, and levels that absorbed heavy selling still break.
What matters is what price does next. After selling is absorbed at a support, watch whether price is accepted above the level on the following candles. After buying is distributed at a resistance, watch the mirror.
A level that gives way right after a bounce is a classic trap. Our guide on spotting a fakeout before a breakout shows how to read it early.
When does an absorption read end?
A read ends when a candle closes beyond the level’s zone on the far side. For an absorbed support, that is a close below it: support lost. For a distributed resistance, it is a close above it: resistance reclaimed. Without a close like that, a read also fades with time, because old pressure tells you less.
A lost level is as much information as the absorption was. The pressure that failed once came back and won. Many traders hold on to an old read long after the chart has moved on. Let the close decide, not the memory of the last bounce.
What do probability points mean?
Probability points are a grade from 0 to 5 that some indicators put on their own reading. For absorption, the grade answers one question: how firmly has a level like this one held in the past? More points mean a firmer history. The grade describes the read, never where price goes next.
Two absorbed supports can look the same to the eye. A graded read puts a measured strength next to the words, so you can see which deserves more attention. MCP uses one 0 to 5 scale across AI Indicators by MCP, so a strong grade looks the same on every tool.
Why is zero points a useful answer?
Zero points does not mean nothing happened. It means a level like this one has held about as often as a typical one, so the read is described, not graded. Knowing which levels are ordinary saves you from trading every bounce. As our piece on the no-trade day puts it, waiting is a position too.
What probability points are not
- Not a forecast that your trade will win.
- Not a price target or a call on direction.
- Not an instruction to enter or exit on their own.
How do you read absorption, step by step?
Read absorption as a short routine, never as a single candle. Start from the levels that matter, wait for heavy pressure to meet one of them, and see whether price refuses to continue. Then watch what price does next, and decide what would prove you wrong before you risk anything. Five steps keep the order honest.
- Mark the supports and resistances the market has respected before.
- Wait for heavy pressure into one of them, not a quiet drift.
- See whether price refuses to continue at the level.
- Watch the following candles: is price accepted beyond the level, or does it give way?
- Write your invalidation and position size before any entry.
The order matters. Levels come first, because heavy pressure far from any level is just heavy pressure. Price’s answer comes second. The plan comes last, and always before the entry, never after it. Our class on support and resistance levels covers how to mark the levels themselves.
Common mistakes
- Calling every busy candle at a level absorption, before price has refused.
- Treating an absorbed support as an entry on its own.
- Reading a grade as a price target or a promise.
- Ignoring a lost level because the last bounce felt convincing.
- Stacking reads from several charts into one conviction.
Practice this
Open a chart you already follow and mark five levels it has respected. Scroll back and find moments where heavy selling or buying pressed into one of them. For each, ask three questions. Did price refuse to continue? Did the following candles accept price beyond the level? And when did the level finally give way?
Write the answers down before you scroll on. Over a few weeks, you start to see which absorbed levels deserved attention and which were ordinary. A graded read shortens that work. It never replaces it.
Where does MCP Absorption Detector V2 fit?
The ParadiseTeam built this idea into MCP Absorption Detector V2, a TradingView indicator in AI Indicators by MCP, included with PRO Paradiser. It marks both reads on closed candles. MCP Absorption Detector V2 grades each absorbed or distributed level with a machine-learning model inside, on the charts where the research confirmed it.
A read with zero points stays off the chart, so the chart carries only what earned attention, while the panel still names it. The next step shows how to read every mark on a live chart.
Next step
See it on a chart: how to use MCP Absorption Detector V2
FAQs
Does absorption at support mean price will go up?
No. It means heavy selling met a support and failed to push price through it on that candle. Price can still fall later, and absorbed supports do break. Treat it as a reason to watch whether price is accepted above the level on the following candles, then let your plan decide.
What is the difference between absorption and a breakout?
A breakout is pressure that wins: price closes through the level and keeps going. Absorption is pressure that loses: heavy pressure hits the level, and price refuses to continue. The same level can see both, so what price does at the level decides which one you are looking at.
What does buying distributed at resistance mean?
It is the mirror of absorbed selling. Heavy buying presses into a resistance the market has respected, and price refuses to continue up. The buyers were met and sold to. It is the distribution read, and like its mirror, it is not a signal on its own.
Is heavy selling at support bearish?
Not by itself. Heavy selling at support only shows that pressure arrived there. If price refuses to continue down and the level holds, the selling was absorbed. If price breaks through, the selling won. Read what price does at the level before you read anything into the pressure.
Why does absorption matter more at a level?
Because a level gives the pressure something to fail against. Heavy selling inside a range, away from any level, can simply be a busy market. Heavy selling into a support the market has respected, with price refusing to continue, shows the level was defended. That is the moment worth your attention.
Risk disclaimer: Crypto trading involves substantial risk of loss. This class is education only, not financial advice. Never trade with money you cannot afford to lose. Past results do not guarantee future results.











Join the discussion
No comments yet. Members, share how you are reading this.