



In short: Wyckoff Accumulation is a trading range where selling pressure weakens and demand slowly absorbs supply. Read its five phases, A through E, rather than one Spring. Wait for confirmation before assuming smart money is buying.
Wyckoff Accumulation is a trading range where selling pressure fades and demand slowly absorbs supply. Read the whole structure, not one signal. The five phases, A through E, show how a bottom can form and when smart money buying may be taking control.
MyCryptoParadise is a professional crypto signals and trading-education service, operating since 2016. In our MCP Free University lessons, we teach the phases so you judge structure over hype. This lesson favours confirmation, not prediction.
The framework comes from Richard Wyckoff, an early-1900s market analyst. You can read a neutral overview of the Wyckoff method before applying it to crypto. Below, we adapt it honestly, with clear risk.
What Wyckoff Accumulation actually means
Accumulation is a range that can develop after a significant decline, when selling weakens and demand absorbs available supply. The market stops making steady downside progress. Buyers and sellers compete for control.
The process takes time. Strong buyers rarely enter with one obvious transaction that lifts price instantly. Instead, demand can appear repeatedly as price nears important support.
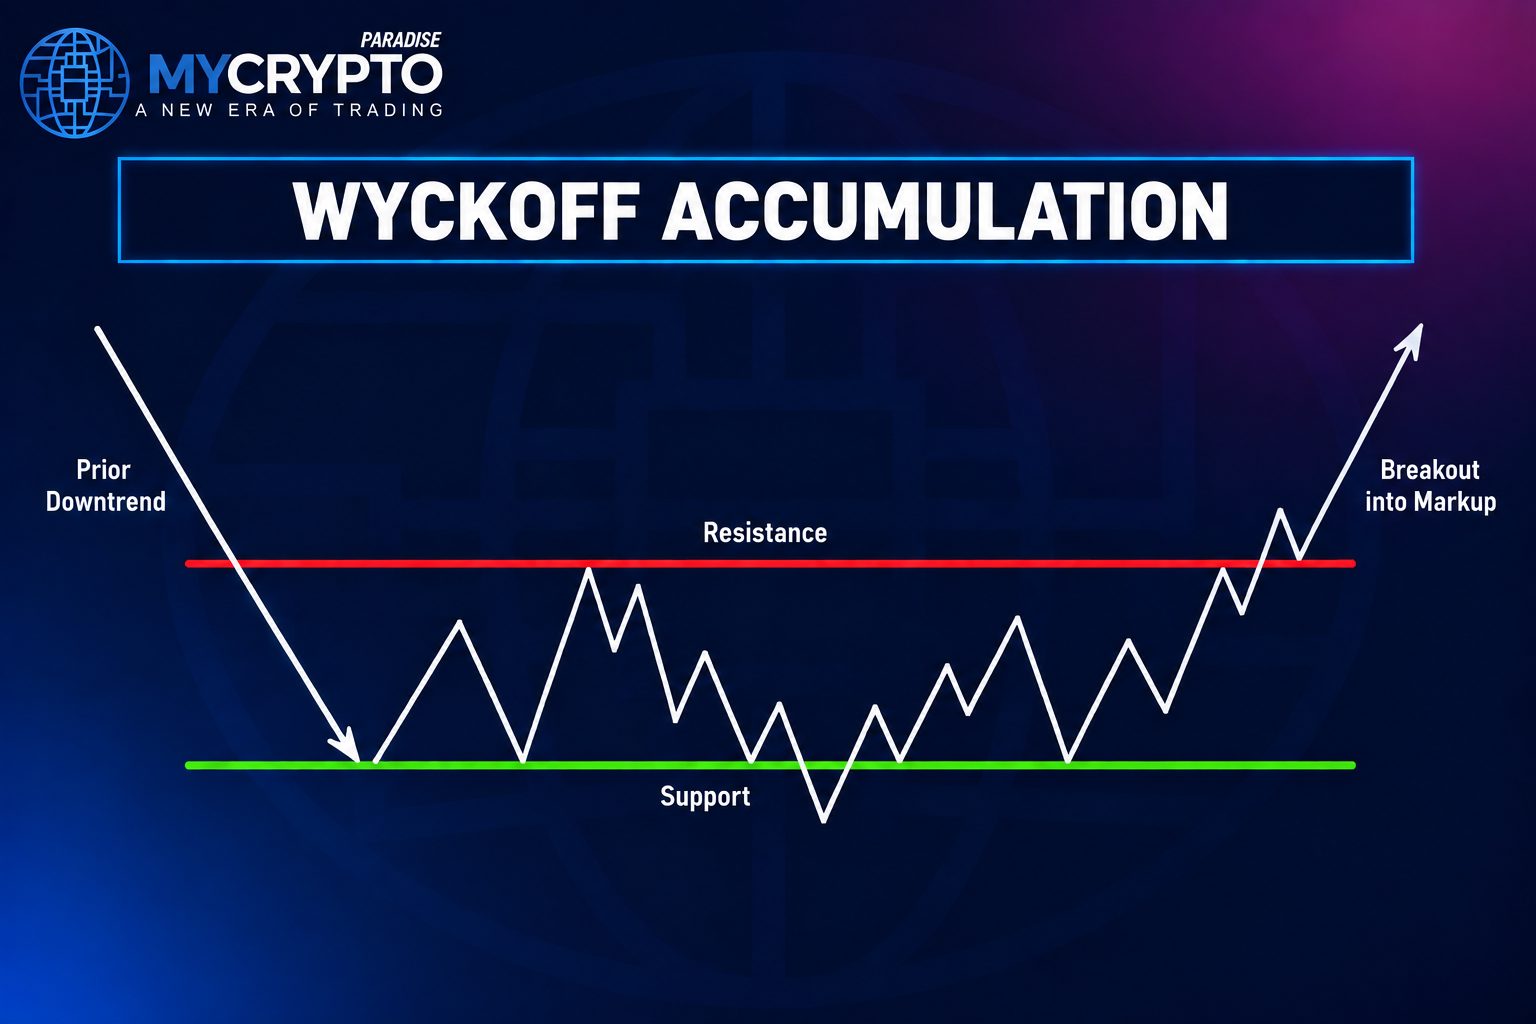
One useful clue is effort versus result. If heavy selling produces little extra downside, supply may be losing effectiveness. If buying sparks stronger rallies, demand may be gaining influence.
A sideways market is not automatically Accumulation. Broader context, such as the crypto fear and greed backdrop, and later price behaviour still matter.
The five phases, A through E
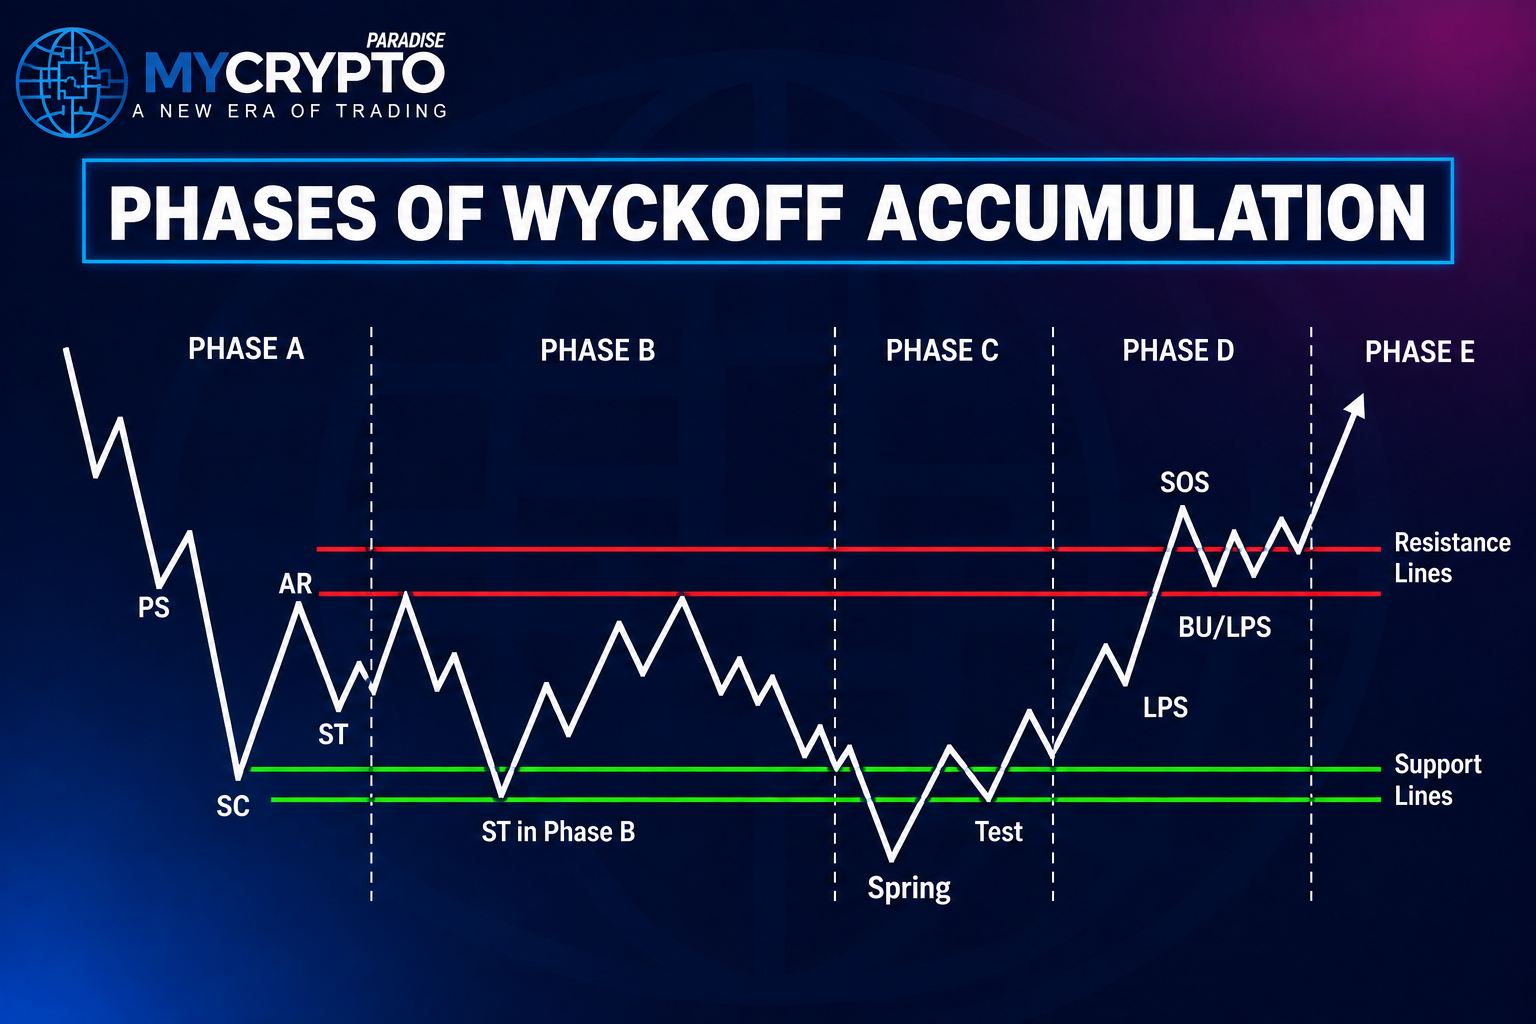
The phases show how supply and demand can shift inside a range. They are a progression, not a rigid template. Real charts show overlaps, variations, and quieter versions of each phase.
Phase A: stopping the downtrend
Phase A stops the existing decline. Sellers start losing control after an extended move down. Watch four events:
- Preliminary Support (PS): early buying begins absorbing supply.
- Selling Climax (SC): aggressive selling peaks, yet demand slows the fall.
- Automatic Rally (AR): selling eases and price rebounds, setting the range top.
- Secondary Test (ST): price revisits the lows to test remaining supply.
Phase A does not confirm Accumulation. It sets conditions for a range and shows the downtrend may be losing momentum.
Phase B: building the cause
Phase B is usually the longest stage. Price swings inside the range while the market tests the balance between supply and demand. Stronger buyers may quietly absorb supply.
Watch for repeated support tests that fail to make new lows. Downside moves become less effective for the effort spent. Reactions off support improve, hinting demand is building.
This phase matters because traders mistake any range for finished Accumulation. The market may still test supply again before it can move higher.
Phase C: testing remaining supply
Phase C tests whether real supply remains. It can hold the most recognisable event: the Spring. A Spring breaks support briefly, then recovers into the range.
The break itself is not confirmation. Judge how fast price reclaims the range, how much selling follows, and how the following Test behaves.
A constructive Test shows reduced selling and limited downside. Reversal candles like a bullish engulfing pattern or a piercing line pattern can add evidence. Not every structure needs a textbook Spring.
Phase D: demand shows control
Phase D gives stronger evidence that demand leads. Price makes stronger upward moves and can break resistance inside the range.
A Sign of Strength (SOS) is meaningful upside progress, often through resistance, with supportive volume. A Last Point of Support (LPS) forms when former resistance holds as support on a pullback.
An LPS can confirm improving structure better than guessing the exact bottom. Several SOS and LPS events may appear. Quality of the reactions beats counting labels.
Phase E: leaving the range
Phase E begins when price leaves the range and starts a sustained advance toward Markup. Demand overcomes overhead supply.
Pullbacks still happen, so keep checking breakouts for confirmation. A brief move above resistance can fail back inside the range.
How smart money buying appears
Three shifts tend to show up together. First, selling becomes less effective: each push lower produces weaker follow-through. Second, support holds better and recoveries strengthen.
Third, volume starts backing the price action. Heavy volume with little downside can signal absorption. Later, strong upside on real demand suggests control is changing hands.
Volume alone is not the point. Ask what price achieved with that volume. Derivatives context, such as crypto funding rates and a liquidation heatmap, can round out the picture.
Accumulation versus ordinary consolidation
Not every range after a decline is Accumulation. A market can drift sideways simply because neither side has enough strength to set direction.
In genuine Accumulation, look for weakening supply, failed breakdowns, absorbed selling, and strengthening upside reactions. Without that evidence, labelling every range Accumulation invites premature bullish bets.
Accumulation or Reaccumulation?
A similar structure can appear inside an existing uptrend. That is Reaccumulation: a pause in a bullish trend rather than a base after a large decline.
Wyckoff treated the range as a cause that can produce a later effect. A longer, well-built range can create a larger cause. Range size alone never tells you how far a later move travels.
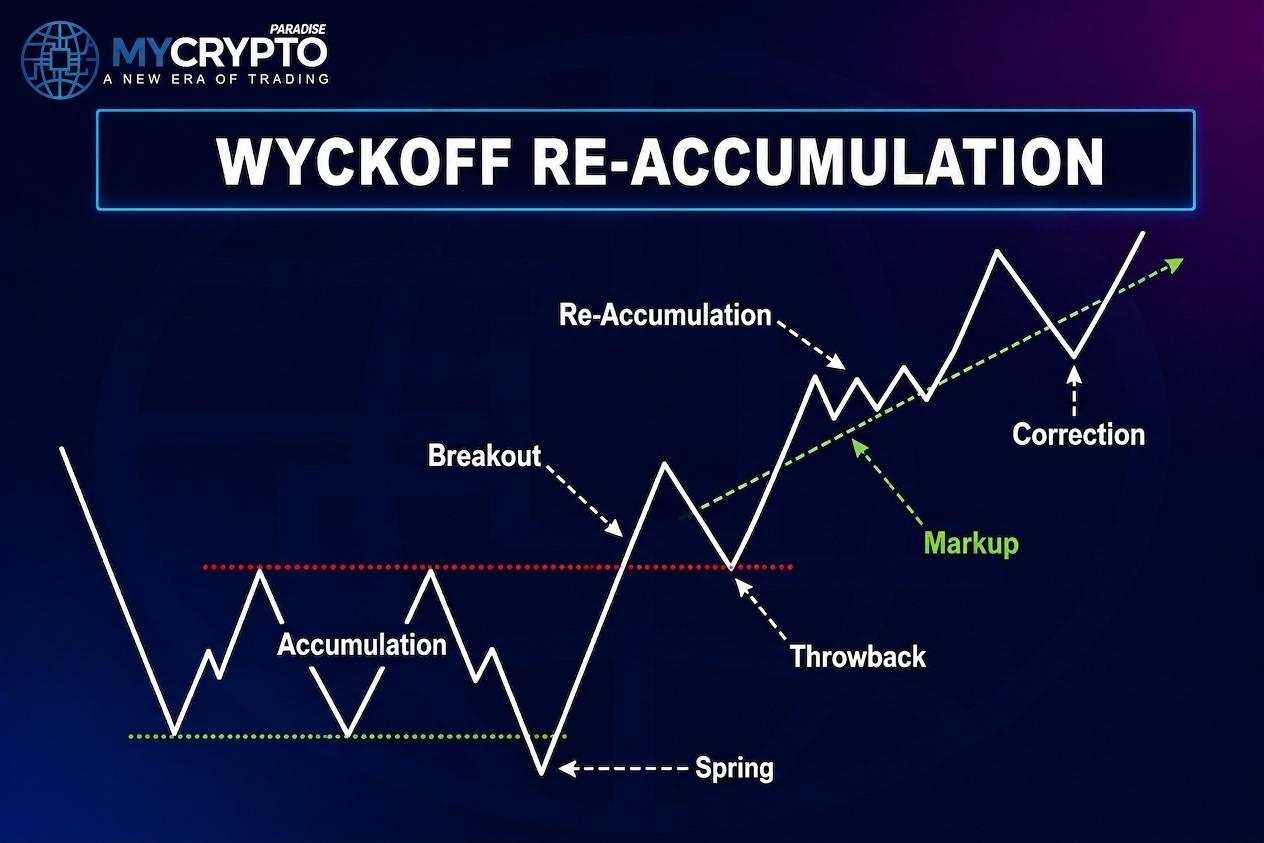
Checking the broader trend prevents big interpretation errors. Frameworks like Elliott Wave theory can add another lens on trend context.
Common mistakes
- Calling every bottom Accumulation: a decline plus sideways action is not proof of buying.
- Buying every Spring: check the Test, volume, and structure first.
- Ignoring phase context: a strong candle means little in isolation.
- Ignoring volume: price shows what happened; volume shows the effort behind it.
- Predicting the breakout too early: a range can stay unresolved for a long time.
- Forcing a perfect schematic: read behaviour, not a textbook shape.
Practice this
- Confirm the range followed a meaningful decline, not random chop.
- Map Phase A: look for PS, SC, AR, and ST behaviour.
- Study Phase B: do downside reactions weaken while demand improves?
- Watch Phase C: a Spring or other test, then a calmer Test.
- Confirm Phase D: SOS through resistance, then a controlled LPS.
- Check Phase E: price holds higher, not failing back inside.
- Manage risk: define invalidation, size to risk, accept that Springs and breakouts can fail.
The goal is not to call the exact bottom. Read how price reacts to selling, whether breakdowns fail, how volume relates to progress, and whether demand finally produces stronger moves. Confirmation beats prediction.
FAQs
What is Wyckoff Accumulation?
It is a trading range that can form after a large decline, as selling weakens and buyers slowly absorb supply. It is a process, not a single signal, and it needs confirmation.
What happens in Phase A?
Phase A works to stop the prior downtrend. Events like Preliminary Support, a Selling Climax, an Automatic Rally, and a Secondary Test help mark out the early trading range.
Is a Wyckoff Spring a buy signal?
Not on its own. Weigh the recovery speed, the following Test, volume, and the wider market structure before treating a Spring as evidence that demand is taking control.
How are Phase D and Phase E different?
Phase D shows demand gaining control through Signs of Strength and Last Points of Support. Phase E is when price leaves the range and starts a more sustained advance toward Markup.
Can Wyckoff Accumulation be used for crypto?
Yes, on liquid coins. Study price, volume, supply, demand, and structure. Wait for confirmation instead of assuming every crypto range is Accumulation. Always define risk before entering.
Risk disclaimer: Crypto trading involves substantial risk of loss. This class is education only, not financial advice. Never trade with money you cannot afford to lose. Past results do not guarantee future results.











Join the discussion 2
Understanding the phases is key, but I always run my own backtests on historical data to confirm the patterns before trusting a setup. So many tempting signals can just be noise.
Ah, the old wyckoff! 😅 I'm all about spotting those Springs and SOS, but honestly, patience is teh real killer for me during phase A. 😩 gotta keep those hands off! 🤲