



In short: Wyckoff Distribution is a process where supply slowly overpowers weakening demand after a strong advance. You read it across five phases, from stopped uptrend to Markdown. No single event proves a top, so wait for combined price, volume and structure evidence.
Wyckoff Distribution is how a market quietly hands control from buyers to sellers after a strong rally. Price can still sit near its highs while demand weakens and supply builds underneath.
This class shows how to read that shift across five phases, using price, volume and structure. MyCryptoParadise is a professional crypto signals and trading-education service, operating since 2016, and this lesson is part of our free education.
What Wyckoff Distribution actually means
Distribution is a market condition where the balance between supply and demand starts shifting after a large advance. Buyers stay active, but their power to push higher fades as selling absorbs their bids.
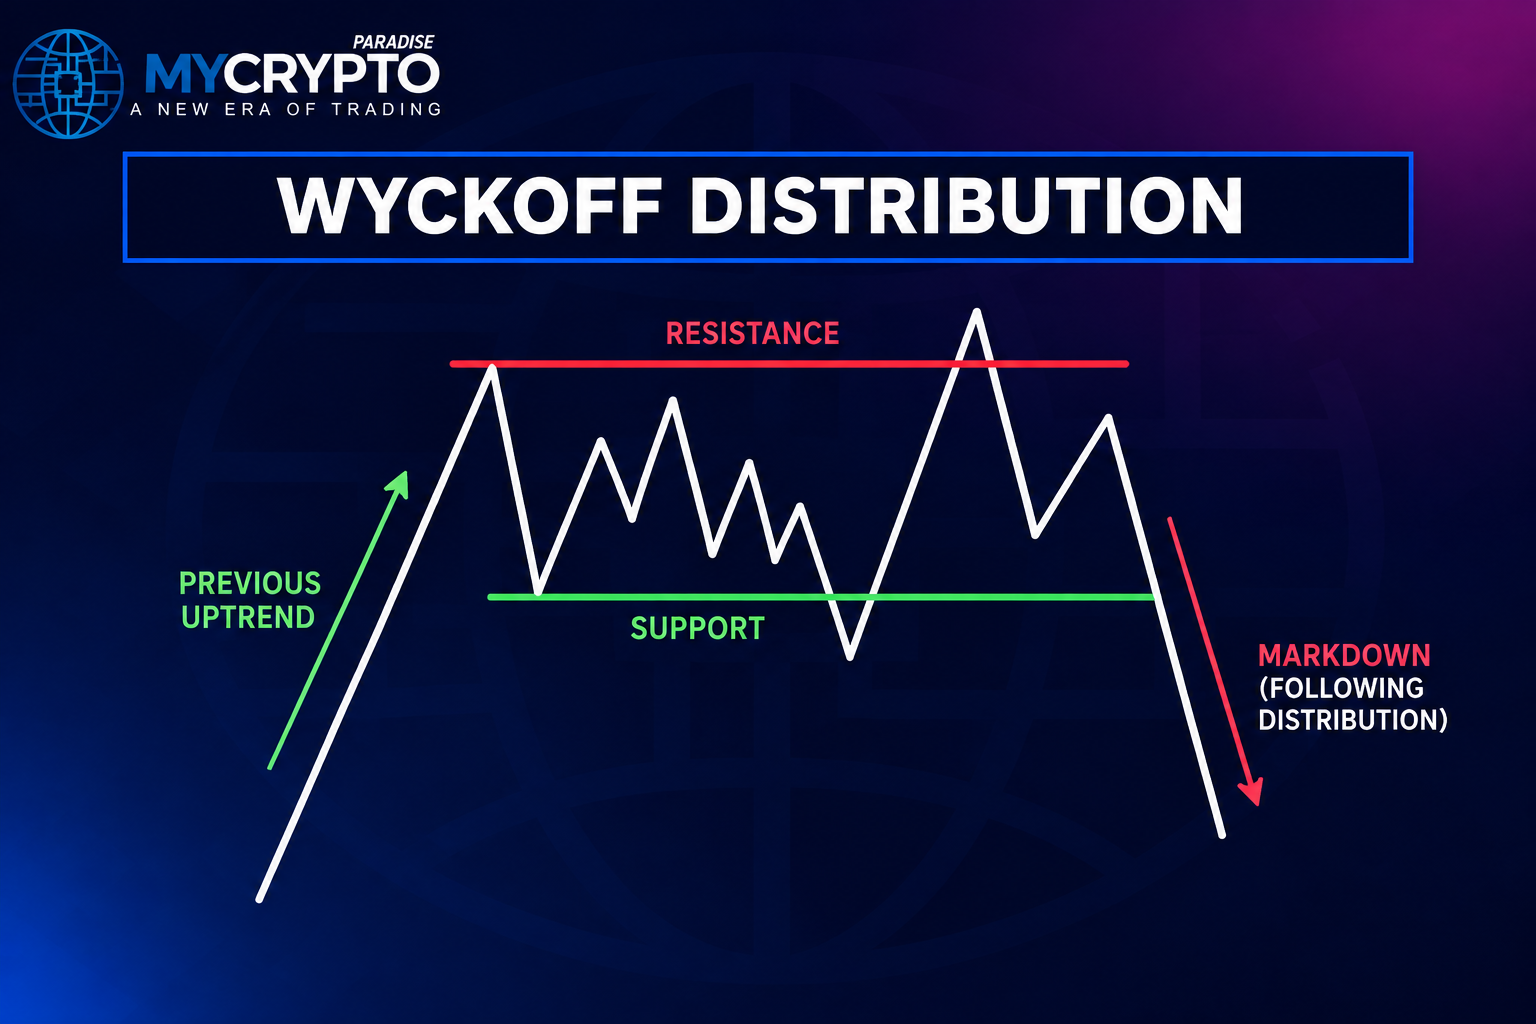
The market can still trade near its highs, or print brief new highs, which makes the weakness hard to see early. When repeated buying produces little upside while reactions grow sharper, supply is likely gaining control.
So treat Distribution as a process, not a signal. According to Investopedia, a market top forms when demand can no longer absorb available supply, which is exactly what these phases try to reveal.
How to read the five phases
The five phases show how supply gradually takes over. Reading them in sequence helps you recognise the move from a trading range toward potential Markdown.
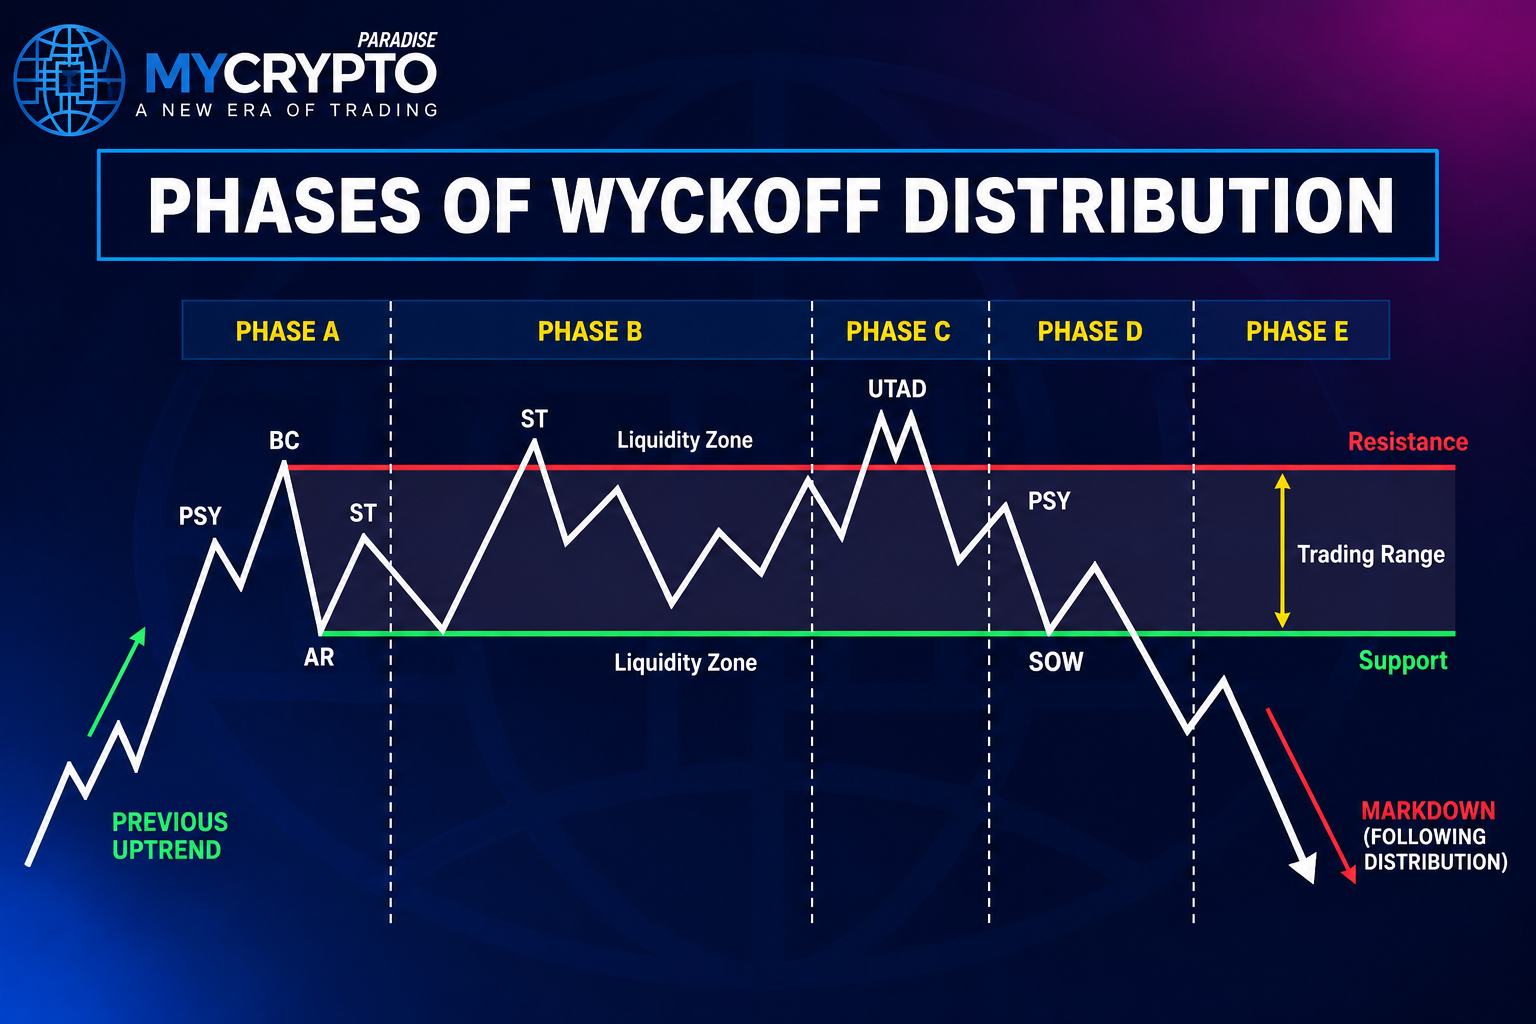
Phase A: stopping the uptrend
Ask whether the prior bull trend is losing its ability to advance. Look for Preliminary Supply (PSY), then a Buying Climax (BC), an Automatic Reaction (AR), and a Secondary Test (ST) that checks buying strength.
Phase A firms up when new highs stop coming and the Secondary Test cannot match the Buying Climax. This marks a stopping process, not a guaranteed reversal.
Phase B: building the cause
Study whether rallies toward resistance become less effective while reactions deepen. Heavy buying with limited upside can signal absorption by stronger sellers.
Confirm Phase B through repeated behaviour, not one candle. A range is not proof of a top, and its duration matters less than the quality of supply and demand inside it.
Phase C: testing remaining demand
Phase C tests whether real demand is left. The classic event is an Upthrust, or an Upthrust After Distribution (UTAD), though a textbook UTAD is not required.
In an Upthrust, price breaks above the range then falls back inside. The key question is whether buyers could hold above resistance after attracting fresh participation.
An Upthrust becomes stronger when price quickly returns below resistance and the following Test shows weaker buying. A breakout alone should never be labelled an Upthrust.
Phase D: supply takes control
Here the evidence should turn bearish. Watch for Signs of Weakness (SOW), broken support, and weaker rallies that fail beneath old resistance.
A Sign of Weakness matters more when it drives clear downside progress, not a brief dip. Then watch for a Last Point of Supply (LPSY): a weak rally that cannot reclaim the range.
Phase E: entering Markdown
Phase E confirms when price stays below the range, sets lower resistance, and keeps making downside progress. A brief breakdown that instantly recovers is not enough.
Selling rarely moves in a straight line, so expect countertrend rallies. Tools like a liquidation heatmap and crypto funding rates add context to the move.
Reading price and volume together
A chart cannot name who is selling, so smart-money selling is only inferred from behaviour. The signal strengthens when several observations agree.
Compare effort with result. Heavy buying with little upside suggests absorption; later, strong selling with large downside shows supply is now effective. High volume only matters against the price it produces.
Broader sentiment helps too. A crowded fear and greed reading near the highs can coincide with the exhaustion Distribution describes.
Distribution vs Redistribution
Distribution usually forms after a mature uptrend and points toward Markdown. Redistribution happens inside an existing downtrend and can precede another leg down.
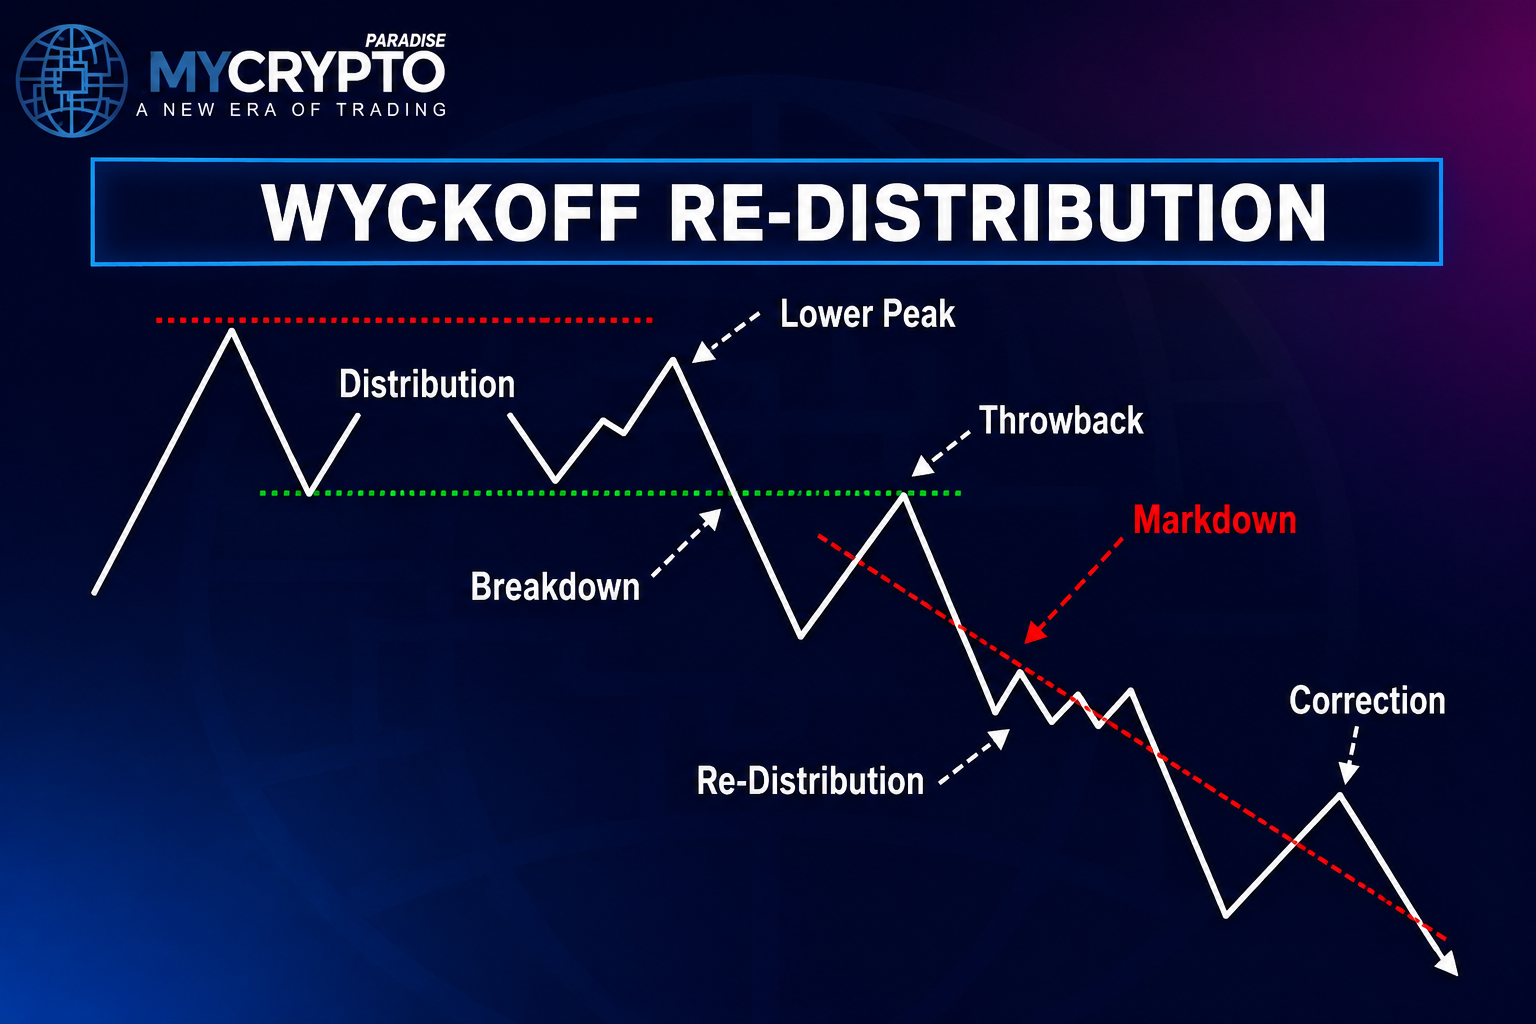
Judge the broader trend, the price-volume behaviour, and the eventual breakout direction before you label either one. The same range can mean opposite things in different trends.
Common mistakes
Calling every top Distribution. A market near an all-time high is not automatically distributing. It may be Reaccumulation or ordinary consolidation.
Trading every Upthrust as a short. Some breakouts fail briefly then resume higher. The reaction, the Test and later weakness decide if it matters.
Reading volume without context. Volume only shows participation, not the result. Weigh effort against the price response every time.
Ignoring the higher timeframe. A range inside a strong uptrend can be Reaccumulation, so respect the trend, much as you would with Elliott Wave structure.
Expecting a perfect schematic. Phases overlap, tests repeat, and an Upthrust may be absent. The framework explains supply and demand, not a tidy picture.
Practice this
Pick a chart that recently topped and label it phase by phase. Start with Phase A: has the advance genuinely stalled, or is it just pausing?
Move to Phase B and mark where rallies fail. Then find any Phase C Upthrust or UTAD, and check whether the Test came back weaker.
Confirm Phase D with a Sign of Weakness and a Last Point of Supply, then Phase E once price holds below the range. Define your invalidation first, the same discipline you would use reading a bullish engulfing pattern.
The goal is not to predict the exact crash. It is to recognise when buyers keep losing effectiveness and sellers gain the power to push price lower.
FAQs
What is Wyckoff Distribution?
It is a trading range that can form after an advance as demand weakens and supply grows more effective. The structure can lead into Markdown, but the range alone does not guarantee a decline.
Is an Upthrust required for Distribution?
No. An Upthrust or UTAD is a classic Phase C event, but Distribution can develop without one. Evidence of weakening demand, failed upside and stronger supply matters more than completing every schematic step.
How do I confirm Phase D?
Look for downside through support and a Sign of Weakness. Then watch for a weak rally, or Last Point of Supply, that fails to reclaim the range. Continued lower highs strengthen the case.
How do I know Distribution reached Phase E?
Look for sustained movement below the range, lower highs, lower lows, and failed rallies. A brief breakdown that quickly recovers into the range is not sufficient confirmation.
Can Wyckoff Distribution fail?
Yes. It can fail if demand regains control, resistance is reclaimed and held, or supposed weakness gives way to sustained upside. Reconsider the analysis whenever price invalidates the bearish structure.
Risk disclaimer: Crypto trading involves substantial risk of loss. This class is education only, not financial advice. Never trade with money you cannot afford to lose. Past results do not guarantee future results.











Join the discussion 7
Yes! This happens to me a lot when I FOMO into rallies 🚀. Hard to know if it's new buyers or just a false signal sometimes! 😩📉
Oh, Wyckoff distribution! I remember getting caught in a few of those Upthrusts thinking it was just a dip to buy. 😅 Always a good reminder to respect the charts.
i often wait for the session open after an Upthrust to confirm the buying exhaustion. Volume can be misleading before then.
yeah, and i also check the daily range after an upthrust... narrower range on increasing volume often confirms the exhaustion too.
whats the best way to confirm the phase B upthrusts are really tests and not just strength from new buyers
tommy, this is the real question 🤔 especially for us looking for quick flips 📈 I always check volume on those upthrusts too, helps a little to see if its real strength or just a liquidity grab.
Exactly Tommy, it's those volume surges 📈 after an upthrust that always get me 👀. Trying to spot if it's real strength or just a last gasp 💨.