


Technical Analysis Basics
In short
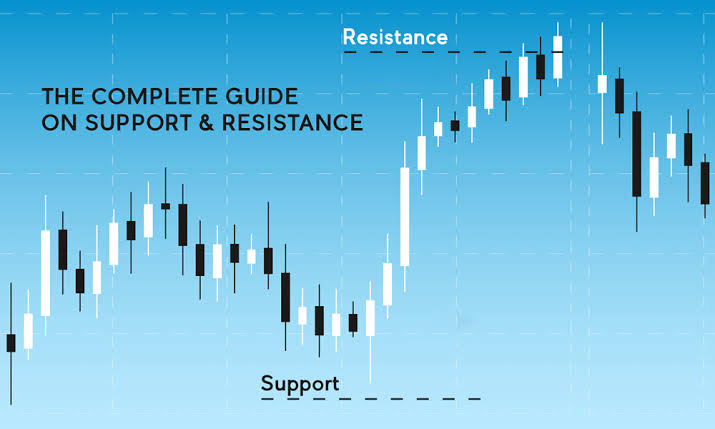
Support and resistance levels are specific price points for a crypto asset that indicate potential reversals in price movement. A support level is a price floor where buying interest historically prevents further price drops, while a resistance level is a price ceiling where selling pressure typically prevents further price increases.
Cryptocurrency trading has become an increasingly famous way to invest and trade in recent years. While there are many mechanisms and techniques used in cryptocurrency trading, understanding support and resistance levels is one of the most important ones. This article will delve into what support and resistance levels are, how to identify them, and how to use them in crypto trading..
What are support and resistance levels?
Support and resistance levels are important price levels that can indicate the strength or weakness of a particular asset. They are levels at which traders and investors are likely to buy or sell an asset, causing the price to either bounce back up (in the case of support) or fall back down (in the case of resistance).
Support levels are areas where the price of an asset has historically had difficulty breaking below. This could be due to an influx of buyers entering the market and buying up the asset, creating a price floor. When the price reaches this support level, traders and investors are likely to buy in, increasing demand for the asset and causing the price to bounce back up.
Resistance levels, on the other hand, are areas where the price of an asset has historically struggled to break above. This could be due to an influx of sellers entering the market and selling off the asset, creating a price ceiling. When the price reaches this resistance level, traders and investors are likely to sell off their holdings, increasing supply for the asset and causing the price to fall back down.
Identifying support and resistance levels
Identifying support and resistance levels can be done in a number of ways, but one of the most common is through the use of technical analysis. Technical analysis involves studying price charts and using various indicators and tools to identify trends and trading patterns.
One popular tool for identifying support and resistance levels is the horizontal line. By drawing a horizontal line at a price level where the asset has historically bounced back up from (support) or fallen back down from (resistance), traders and investors can identify potential areas of interest.
Let’s take a look at some examples of support and resistance levels in popular cryptocurrencies.
Case 1:

In the BTC/USD daily chart above, we can see that there are several key support and resistance levels. The first major support level is around the $42,000 price level where the price bounced back up in late January and early February 2021. This level was tested again on the 9th of February, and the price once again bounced back up..
The next major support level lies below the $42,000 mark where the price of BTC bounced back up in early 2021. This level has not been tested since then, but it is still a key level to watch for potential support in the future.
The resistance shows several key levels to watch as well. The first major resistance level is around the $43,000 price level, where the price struggled to break above on Feb 9, 2021. the price breaking above this level, introduced a bullish momentum for Bitcoin.
The immediate key resistance level is around the $46,000 price mark. The price struggled to break above this between Feb 9 and Frb 10, 2021. The price tested this level several times again, but it is still a key level to watch for potential resistance in the future.
Case 2:
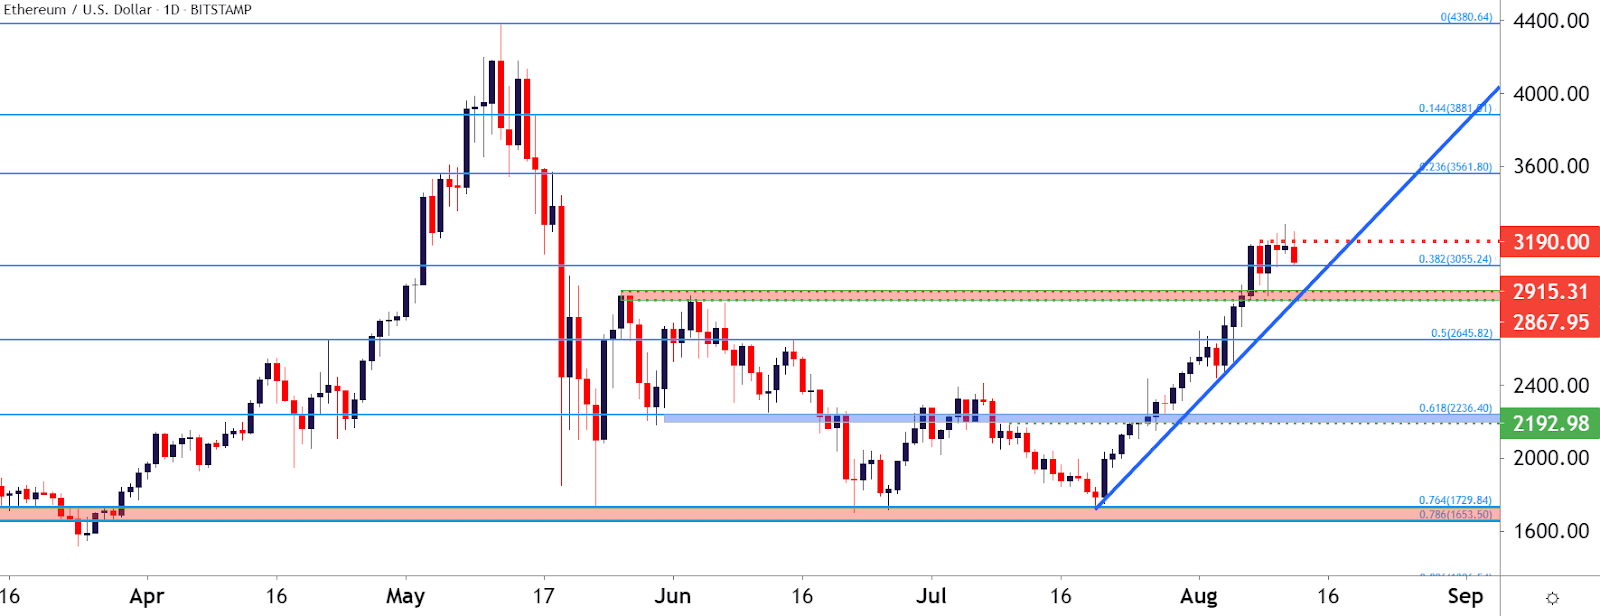
In the ETH/USD daily chart above, we can see that there are key support and resistance levels. The key support area lies around the $1,700 price mark, where the price bounced back up a couple of times between May and July. This level was tested again on July 16, and the price once again bounced back up.
Another major support level is around the $2,100 price level, where the price bounced back up a lot in June. This level was tested again around July, but it is still a key level to watch for potential support in the future.
On the resistance side, there is one key level to watch as well. The major resistance level is around the $2,900 price level, where the price struggled to break above in mid August. If the price is able to break above this level, it could be a bullish signal for Ethereum.
Case 3:

In the EOS/USD chart above, we can see that there are key support and resistance levels. The major support level is around the $2.3 price level, where the price bounced back up throughout 2020 and early 2021. The price tested this level again in February 2021, and the price once again bounced back up.
On the resistance side, the key level to watch is the $3.95 area. The price struggled to break above in mid March and mid August 2020. If the price is able to break above this level, it could be a bullish signal for Litecoin.
Using support and resistance levels in cryptocurrency trading
Now that we’ve identified some key support and resistance levels in popular cryptocurrencies like BTC, ETH, and LTC, how can we use this information in our cryptocurrency trading strategies?
One way to use support and resistance levels is to set buy and sell orders at these levels. For example, if the price of Bitcoin is approaching a key support level, you could set a buy order at that level in case the price bounces back up. Similarly, if the price of Ethereum is approaching a key resistance level, you could set a sell order at that level in case the price falls back down.
Another way to use support and resistance levels is to look for potential breakouts. If the price of an asset is consistently testing a resistance level and is unable to break above it, but suddenly breaks through that level with a large volume spike, that could immediately usher in a big uptrend. The resistance in question may subsequently refuse a price fall below it, essentially becoming a support itself. The same thing is true for a support level that turns a resistance level in the same manner.
What is different here
Most guides stop at the theory. The MyCryptoParadise team shares the live trades, and the reasoning behind each one, inside ParadiseFamilyVIP. Everything here is education, not financial advice.
Crypto trading involves substantial risk and is not suitable for everyone. Nothing here is financial advice; it is education only. Never risk more than you can afford to lose.


Join the discussion
No comments yet. Pro Paradiser members, share how you are reading this.