

In short
XRP technical analysis means reading the chart to judge probability, not to predict a price. You study volume, momentum indicators like RSI and MACD, and the support and resistance levels where past buyers and sellers acted. Good analysis weighs both the bullish and bearish case, then lands on a probability, never a certainty. It always starts with risk: how much you lose if the read is wrong. The strongest approach combines these signals with the wider market context, positioning, and Bitcoin’s trend. Treat every indicator as evidence, not a promise. That discipline separates a durable trader from a hopeful one.
Understanding XRP technical analysis
XRP draws some of the busiest crowds in crypto, which makes its chart noisy and emotional. Technical analysis is how you cut through that noise. It is the study of price, volume, and momentum to judge where XRP is likely to go, and where your idea is wrong.
This guide is a checklist, not a crystal ball. We rank the criteria of a trustworthy read, compare the main approaches, and flag the warning signs of weak analysis.
What is different here
The ParadiseTeam reads XRP positioning across all major exchanges before we trust a single line on the chart. The chart tells you what happened. Positioning hints at what the crowd is set up to feel next.
What makes a technical read on XRP trustworthy?
A trustworthy read defines its risk before its target, confirms a signal across more than one tool, and respects volume as the real story. It weighs the bull and bear case honestly, sets XRP against Bitcoin, and ends in a probability. Certainty is the tell of a weak analyst.
Use this six point checklist to judge any XRP read, including your own:
- It defines the invalidation level before the target.
- It confirms a signal across more than one tool.
- It weighs the bullish and bearish case honestly.
- It treats volume as the truth behind the move.
- It reads XRP against Bitcoin and the wider market.
- It lands on a probability, never a promise.
Different traders read XRP in different ways. Here is how the main approaches compare, so you can see what each one sees and misses.
| Approach | What it reads | Transparency | Typical risk |
|---|---|---|---|
| Indicators only | Momentum and trend math, like RSI and MACD | High, the rules are public | Lagging signals and false crosses |
| Price action | Support, resistance, and patterns | High, visible on any chart | Levels are drawn subjectively |
| Positioning | Live leverage and funding across exchanges | Medium, needs data access | Crowded trades unwind fast |
| Hype following | Social buzz and anonymous calls | Low, no method is shown | Highest, you become exit liquidity |
Which indicators matter most for XRP?
Three indicators do most of the work: volume, the relative strength index, and MACD. Volume shows whether a move has real participation. RSI, on a 0 to 100 scale, flags when XRP is stretched too far, too fast. MACD tracks momentum shifting between buyers and sellers. Read them together, never alone.
Volume is the truth serum of any chart. A breakout on rising volume has real buyers behind it. The same breakout on thin volume is often a trap that fades within hours.
The relative strength index measures momentum on a 0 to 100 scale. Readings above 70 suggest XRP is overbought, and below 30 suggest oversold. Treat these as caution flags, not buy and sell buttons, because strong trends can stay stretched for a long time.
MACD shows momentum shifting hands between buyers and sellers. When its lines cross upward, buying pressure is building. A cross the other way warns that momentum is fading. Like RSI, it lags, so confirm it with price and volume.
How do you find support and resistance on an XRP chart?
Support and resistance are the price zones where XRP has repeatedly stopped and reversed. Support is a floor where buyers keep stepping in. Resistance is a ceiling where sellers keep taking profit. Mark the levels touched most often, treat them as zones, not exact lines, and watch how price behaves when it returns.
Start on the higher timeframes, the daily and weekly, where levels carry the most weight. The zones that have flipped between support and resistance several times are the ones the whole market watches. The same discipline underpins reading any crypto chart, not just XRP.
Chart patterns and what they imply for XRP
Patterns are shorthand for crowd behavior, not magic shapes. The ones worth trusting on XRP are simple and confirmed by volume. Most failed trades start with acting on a pattern before the breakout proves itself.
- Ranges: XRP chops sideways between clear support and resistance.
- Triangles: price coils tighter until it breaks one way.
- Breakouts: a decisive move beyond a level, confirmed by volume.
None of these promise anything. A triangle can break either way, and a breakout can fail and reverse. That is why the invalidation level matters more than the pattern itself.
How should risk shape every XRP trade?
Risk comes first, before any target. Decide the invalidation level where your idea is wrong, then size the position so a loss there is survivable. Most traders risk a small fixed share of the account per trade. The goal is to stay in the game long enough for good reads to compound.
The math is simple and unglamorous. If you risk a small fixed share per trade, a string of losses cannot end your account. That single habit outlasts every clever indicator. We cover the common risk mistakes that drain active traders, and the disciplined risk strategies behind every signal we share.
Red flags of a weak XRP analysis
- A price target with no invalidation level.
- Promises of certain profit or zero downside.
- One indicator cited as proof on its own.
- Analysis that ignores Bitcoin and the wider market.
- An anonymous caller with no track record.
Reading XRP against the broader market
XRP rarely moves alone. When Bitcoin trends hard, most alts follow, so a bullish XRP chart can fail in a falling market. Context also includes leverage and funding, which reveal how crowded a trade has become. A clean chart in a fragile market is still a fragile trade.
XRP also carries a regulatory history most coins do not. The years long regulator’s action against Ripple moved the price on headlines, not charts. That is a reminder that news can override any technical read in minutes.
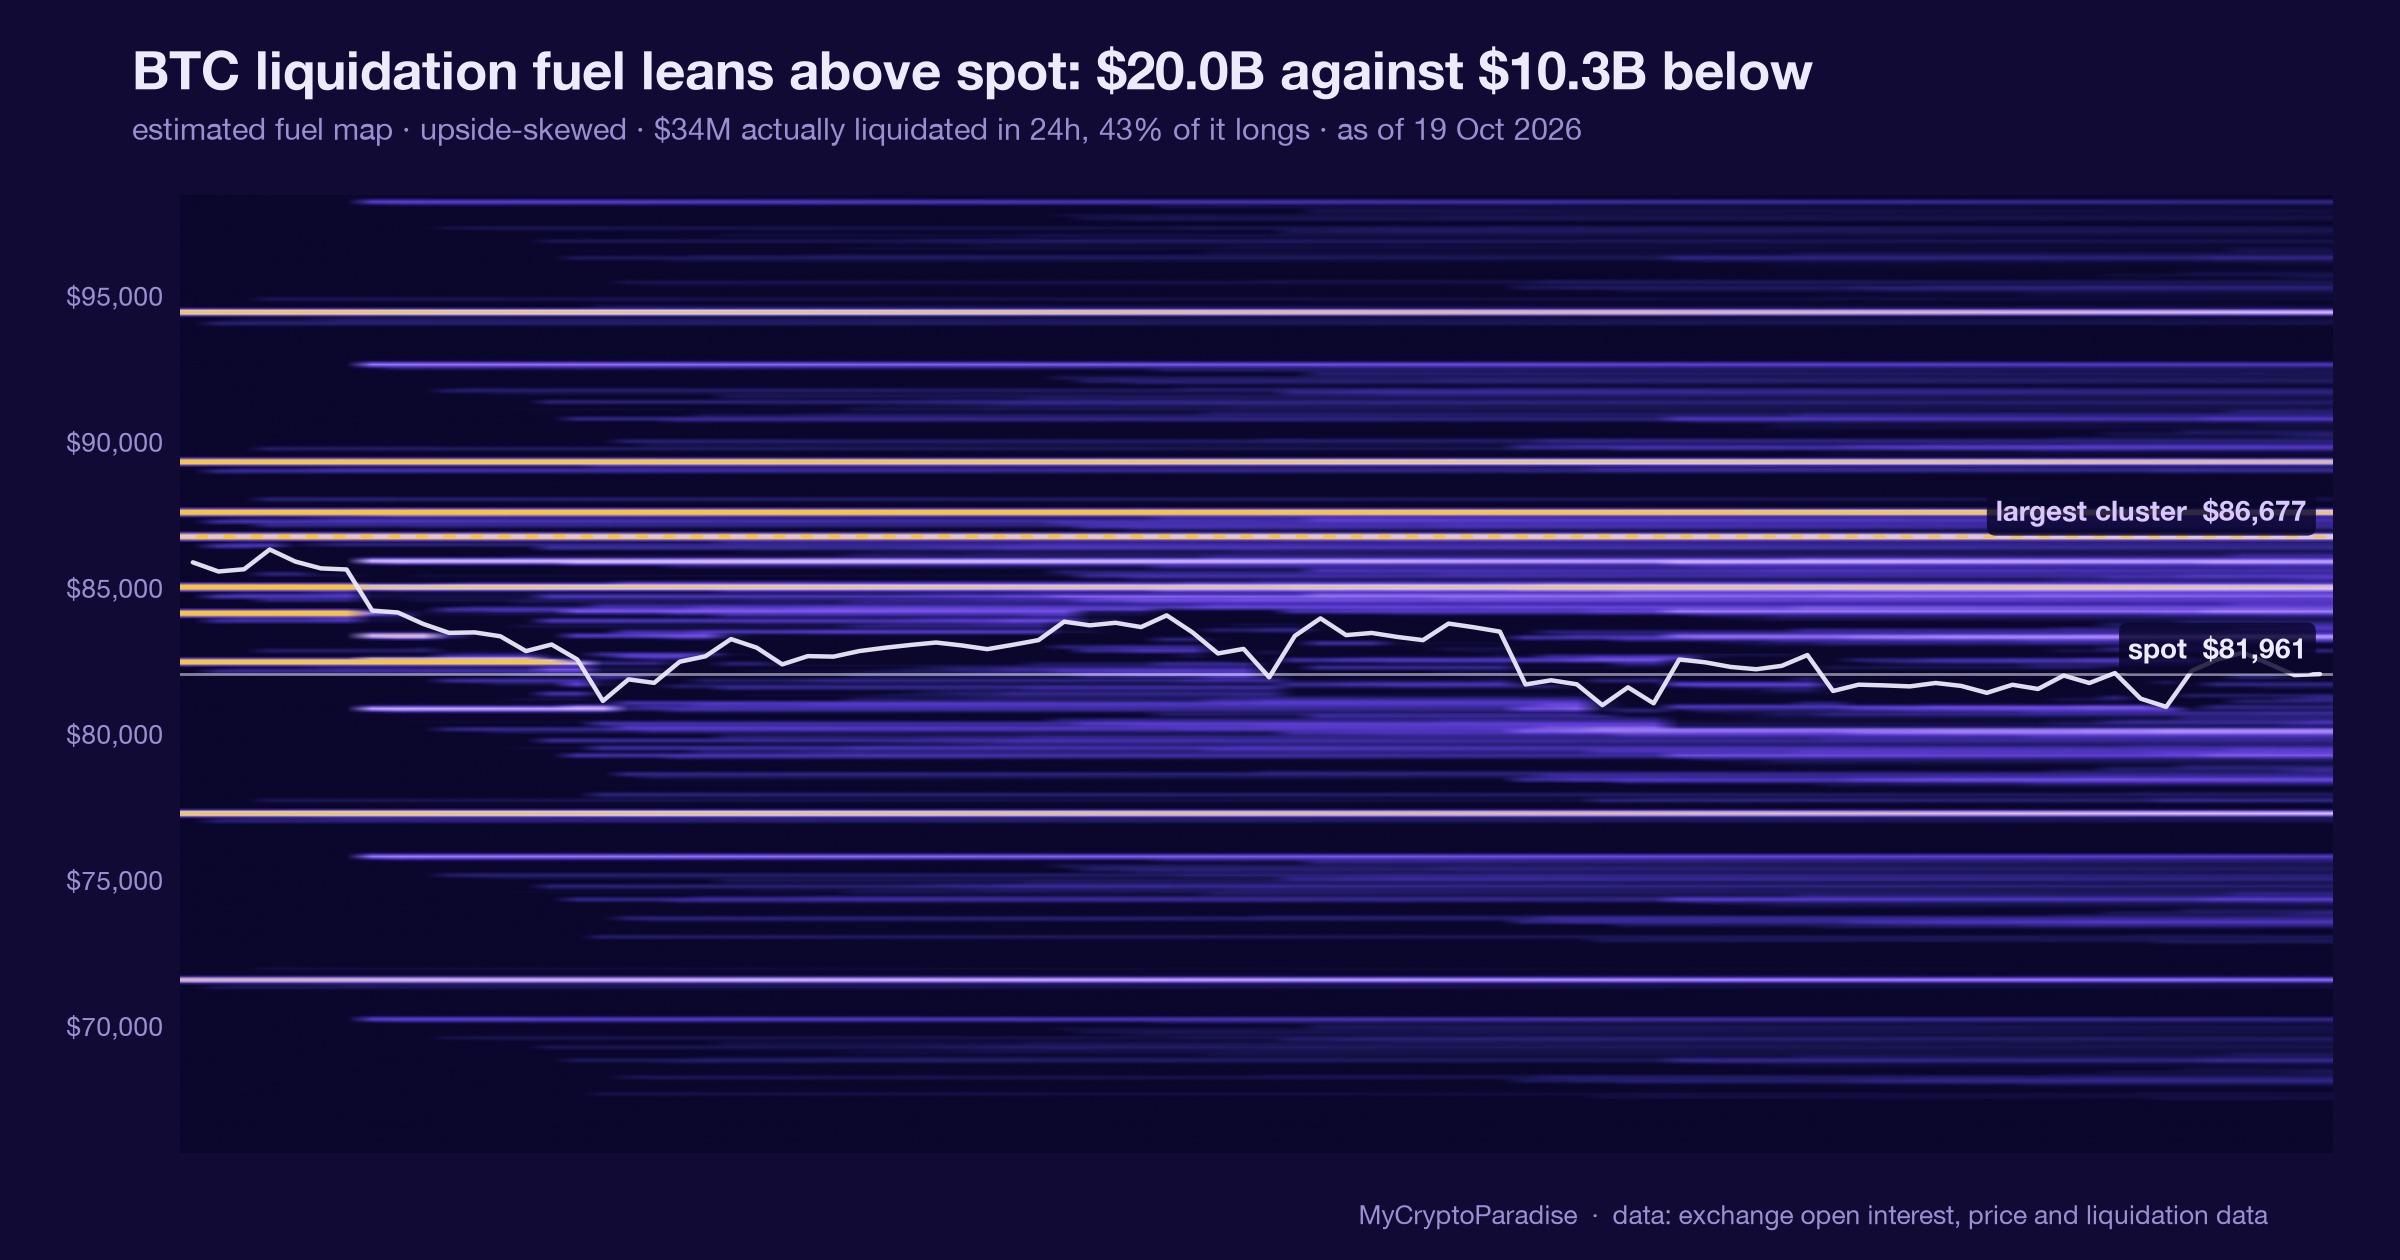
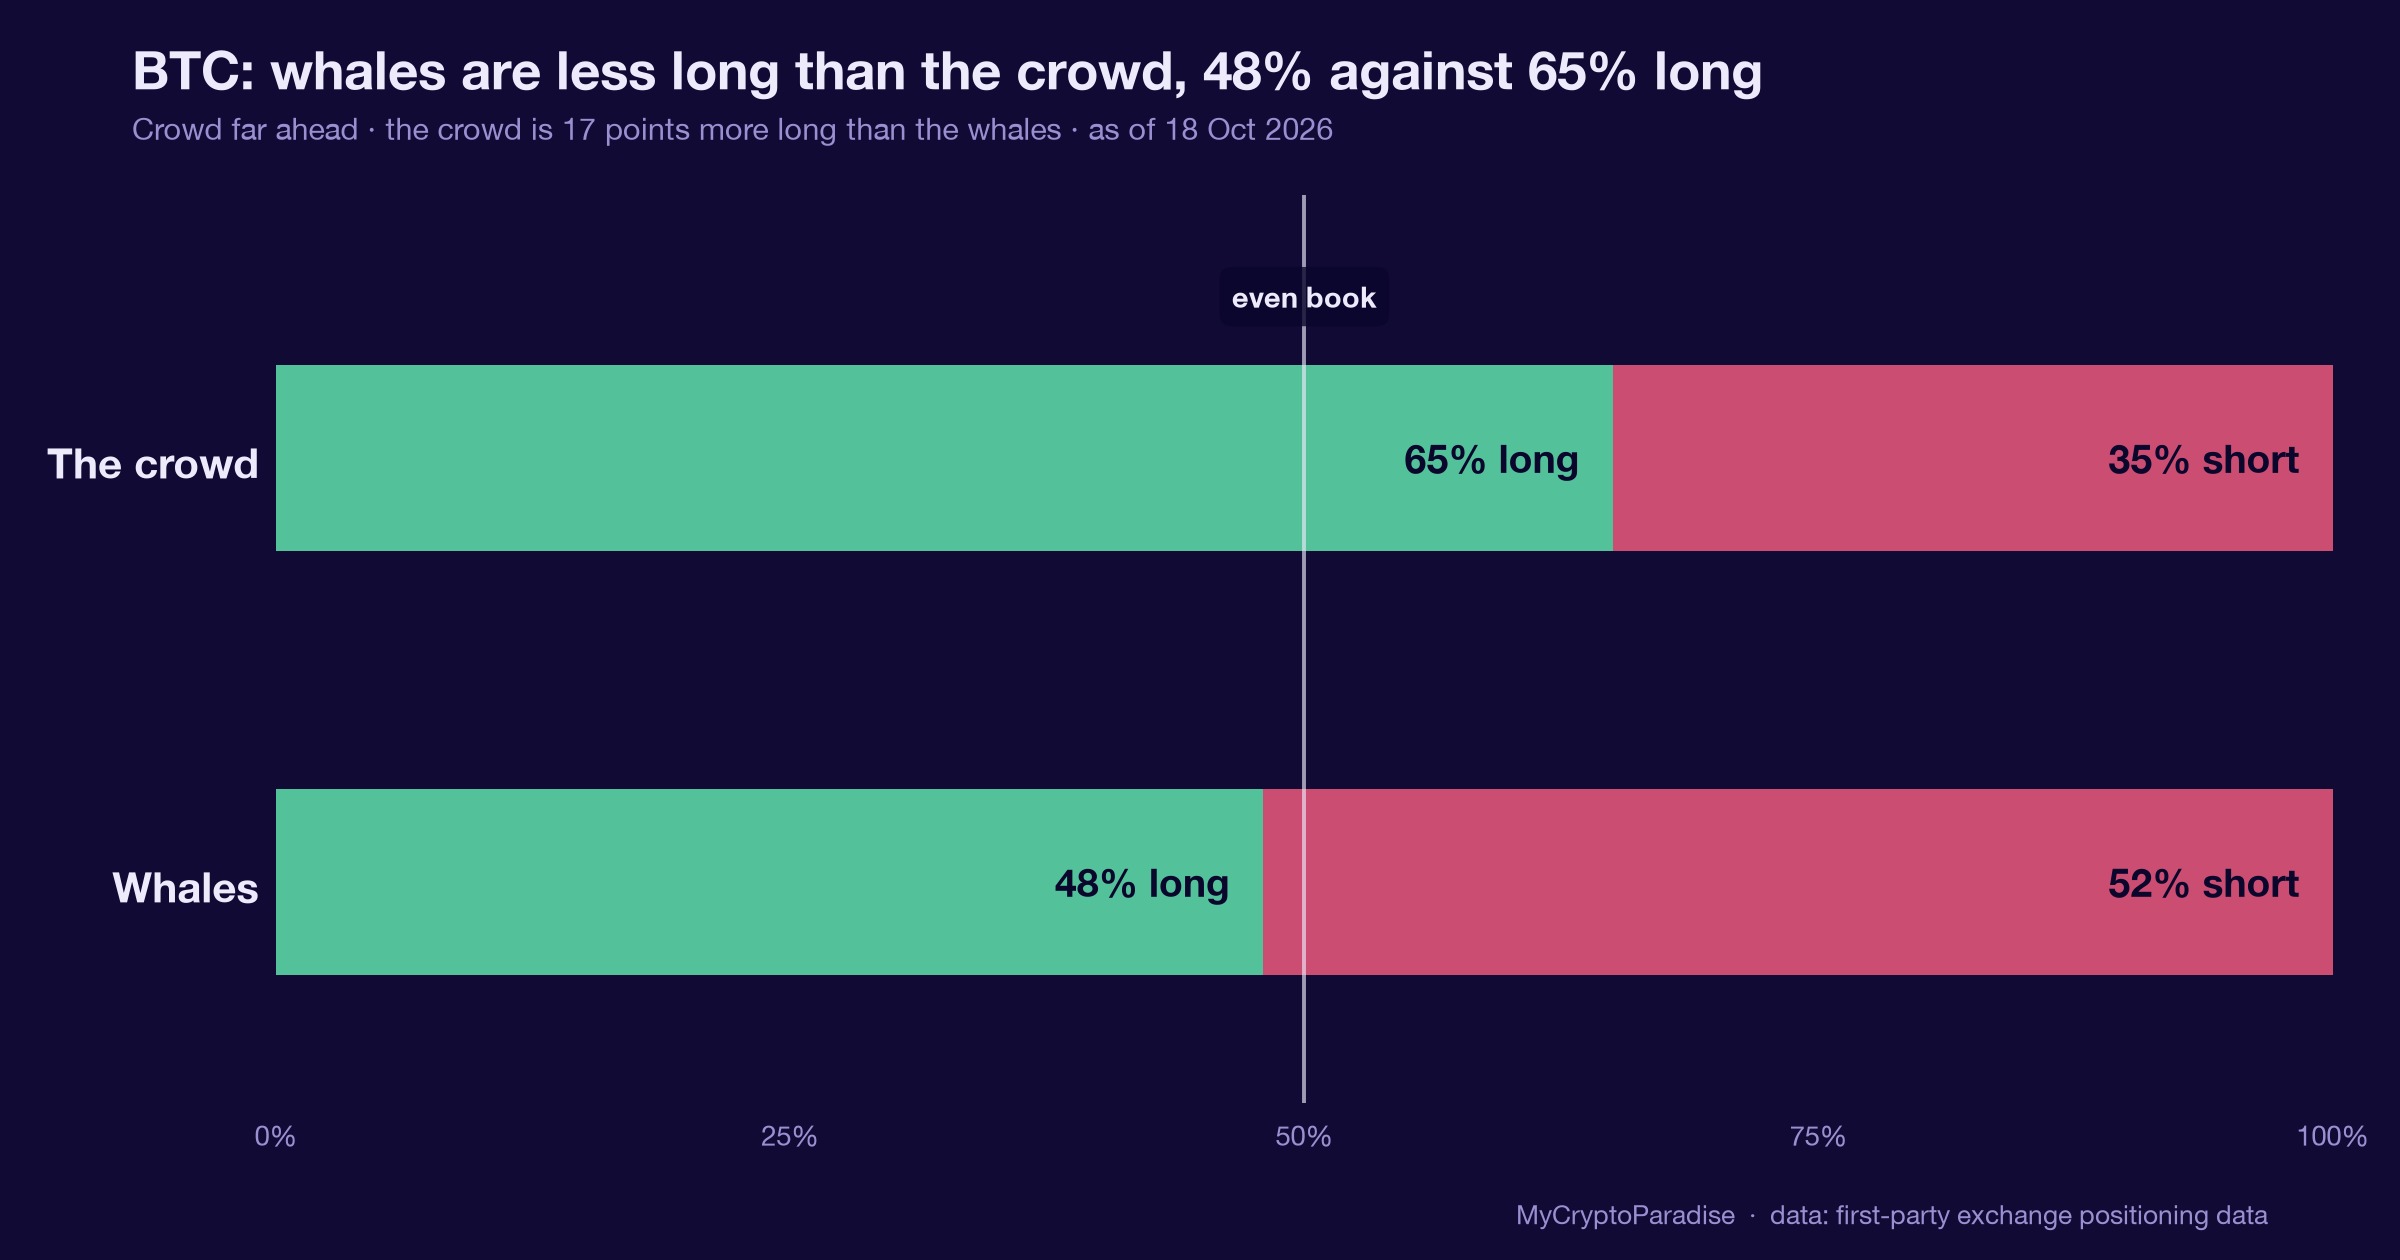
Positioning is the other half of context. When leverage piles onto one side, the crowd becomes fuel for a violent reversal. This is the mechanic behind funding rates and squeezes, and why we once tracked a crowded whale short in real time.
How the ParadiseTeam measures up
We hold our own work to the same checklist. We have traded through several cycles since 2016. We define risk before any target, and we read XRP positioning across all major exchanges before building a view.
Our reads land as a probability, not a forecast, and we say so plainly. That is the standard, not a sales pitch.
Frequently asked questions
What is the best indicator for XRP technical analysis?
No single indicator wins, and any that promises certainty is a warning sign. Volume, RSI, and MACD work best together, each confirming the others. Volume shows conviction, RSI flags stretched moves, and MACD tracks momentum. The strongest reads combine all three with support and resistance levels.
Can technical analysis predict the XRP price?
No. Technical analysis estimates probability, not certainty, and anyone claiming a sure XRP price is misleading you. It helps you find good risk and reward setups and define where your idea is wrong. Think of it as weighing evidence, not forecasting the future. News can override any chart in minutes.
How do I set support and resistance for XRP?
Look at the higher timeframes first, the daily and weekly charts. Mark the price zones where XRP has repeatedly reversed, and treat them as areas, not exact lines. Levels touched several times matter most, because more traders watch them. Then observe how price behaves each time it returns to a zone.
Why does Bitcoin matter for an XRP trade?
XRP rarely moves alone. When Bitcoin trends strongly, most altcoins follow, so a bullish XRP setup can still fail in a falling market. Bitcoin sets the risk tone for the whole crypto market. Always check its trend and the wider positioning before you trust an XRP chart on its own.
Crypto trading involves substantial risk and is not suitable for everyone. Nothing here is financial advice; it is education only. Never risk more than you can afford to lose.








Join the discussion
No comments yet. Members, share how you are reading this.