

In short
Reading crypto charts involves understanding price, time, and volume data to identify potential areas of interest. Charts show past market behavior, not future outcomes. Focus on candlesticks to see price action within specific periods. Look for trends, support, and resistance levels where price often reacts. Volume confirms the strength of price moves. The goal is to identify probabilities and manage risk, not to predict with certainty. A chart is a tool for understanding current market structure and potential turning points, informing your trading strategy.
What Does a Crypto Chart Really Show?
A crypto chart visually represents an asset’s price movements over time, alongside trading volume. It distills complex market activity into an understandable format. This allows traders to observe historical price action, identify patterns, and gauge market sentiment. The primary elements are price, time, and the number of units traded.
How Do Candlesticks Work on a Crypto Chart?
Candlesticks are the most common way to display price data on crypto charts. Each candlestick represents price movement within a specific timeframe, such as one hour or one day. A green or white candle typically means the closing price was higher than the opening price, showing bullish sentiment. A red or black candle indicates the closing price was lower than the opening price, signaling bearish sentiment.
The body of the candlestick shows the opening and closing prices. The ‘wicks’ or ‘shadows’ extending from the body indicate the highest and lowest prices reached during that period. Understanding individual candlesticks helps traders interpret immediate market action. For example, a long wick at the top of a candle suggests sellers rejected higher prices. Conversely, a long wick at the bottom indicates buyers stepped in to push prices up.
How Do You Identify Trend, Support, and Resistance?
Identifying trends involves observing the general direction of price movement over time. An uptrend shows higher highs and higher lows, while a downtrend features lower highs and lower lows. Support levels are price points where buying interest has historically been strong enough to stop further price declines. Resistance levels are where selling pressure has previously been sufficient to halt price advances.
These levels are not exact lines but rather zones where price tends to react. Traders often look for price to test these levels, indicating potential reversals or continuations. Understanding the level in play is crucial for setting entries and exits.
Why Is Trading Volume Important in Chart Analysis?
Trading volume indicates the total number of units of a cryptocurrency bought and sold during a specific period. High volume suggests strong conviction behind a price move, whether up or down. Conversely, low volume can indicate a lack of interest or indecision in the market. Volume helps validate price action; a strong move on high volume is generally more significant than one on low volume.
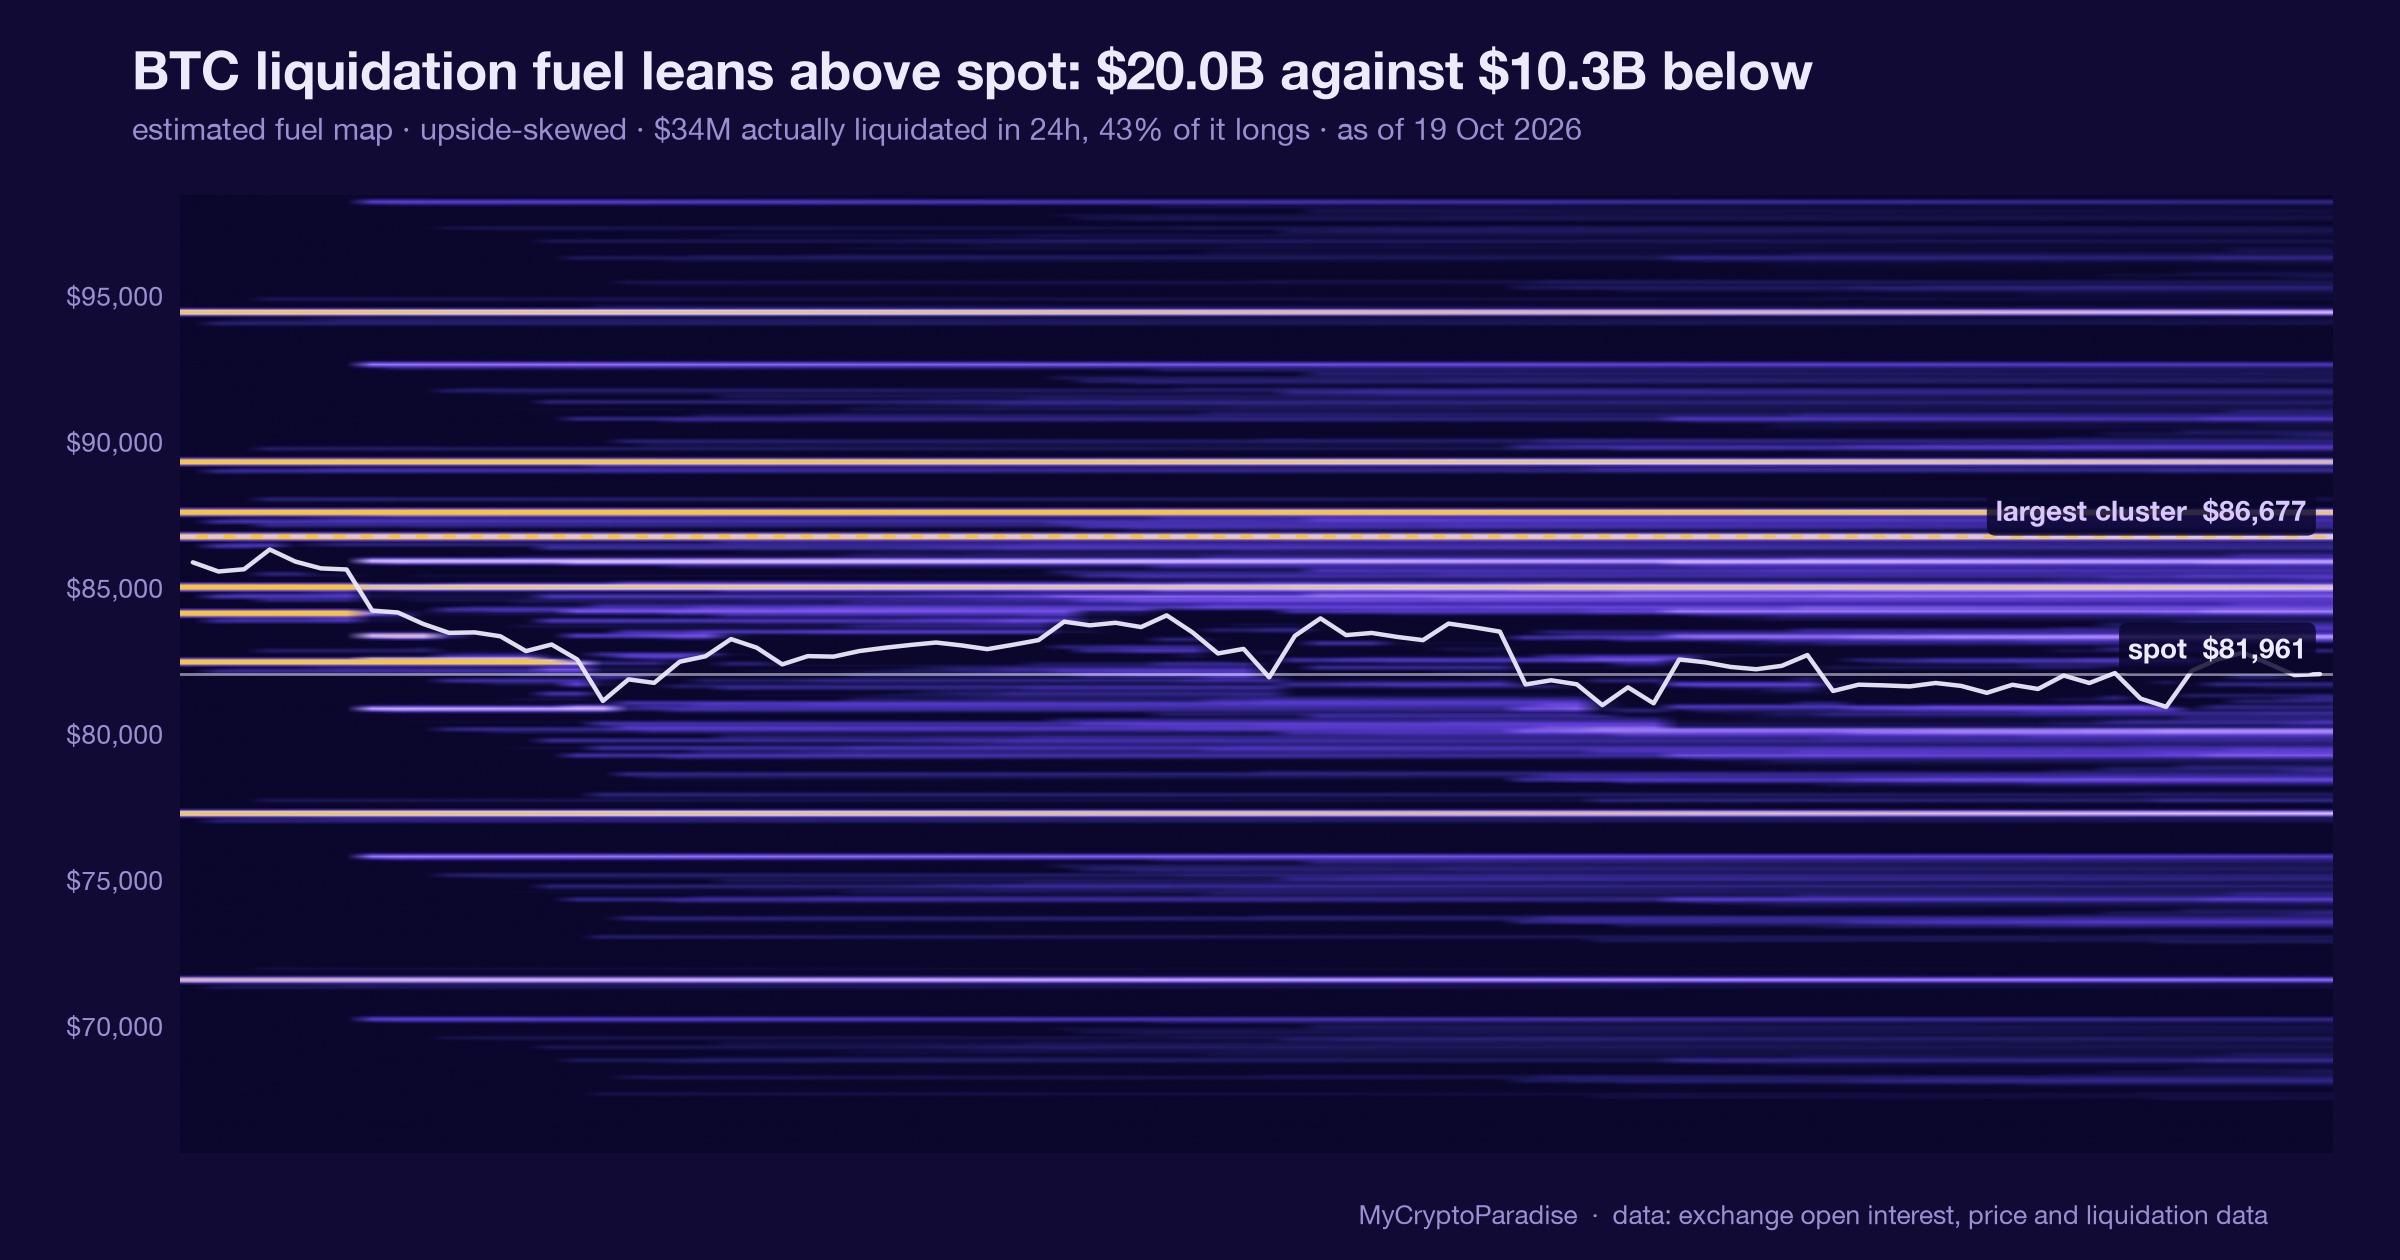
For instance, a price breakout above resistance with high volume is more likely to sustain than a breakout with low volume. Similarly, a price drop on unusually high volume signals significant selling pressure. We also monitor where the fuel actually sits by analyzing aggregated volume data across all major exchanges.
What Are Common Chart-Reading Mistakes for Beginners?
Beginners often make several costly mistakes when reading crypto charts. One common error is focusing solely on price action without considering volume, leading to misinterpretations of market strength. Another mistake is over-reliance on a single indicator or pattern, ignoring the broader market context.
Many beginners also fall into the trap of predicting future prices with certainty, rather than assessing probabilities. They might chase pumps or panic sell based on emotional reactions to short-term fluctuations. A disciplined approach requires patience and a holistic view, not just reacting to every candle.
Where Do Charts Stop and Risk Management Begin?
Charts provide valuable insights into market structure and potential price movements, but they cannot predict the future. Their utility ends where the need for proactive risk management begins. Understanding chart patterns, like the bullish counterattack pattern, helps identify probabilities, not certainties. This means every trade carries inherent risk.
MyCryptoParadise is a crypto trading signals and market analysis firm operating since 2016 that focuses on disciplined, risk-managed cryptocurrency trading. We use charts to identify high-probability setups, but always with a focus on where to cut losses if the market moves against a position. True trading competence lies in managing capital, not just reading charts. The chart shows you where the risk sits right now, not where the price will be tomorrow.
Frequently asked questions
What is a crypto chart?
A crypto chart is a graphical representation of a cryptocurrency’s price movements over time. It typically displays price, time, and trading volume, allowing traders to visualize historical market data. These charts help identify trends, support, and resistance levels, aiding in technical analysis and trading decisions.
What is a candlestick on a crypto chart?
A candlestick is a popular way to display price action within a specific timeframe on a crypto chart. Each candle shows the opening, closing, high, and low prices for that period. Its color indicates if the price closed higher (bullish) or lower (bearish) than it opened, offering quick visual insights.
How do I identify a trend using a chart?
You identify a trend by observing the overall direction of price movement on a chart. An uptrend is characterized by a series of higher highs and higher lows. Conversely, a downtrend shows lower highs and lower lows. Sideways or range-bound markets show price moving horizontally between defined levels.
Why is trading volume important in chart analysis?
Trading volume is crucial because it validates the strength of price movements. High volume accompanying a price increase suggests strong buying interest, while high volume with a price decrease indicates strong selling pressure. Low volume often signals a lack of conviction or market indecision, making price moves less reliable.
Can crypto charts predict future prices?
No, crypto charts cannot predict future prices with certainty. They are tools for analyzing historical data and identifying probabilities based on past market behavior. Charts help traders understand current market structure and potential areas of interest, but they do not offer guarantees or forecasts about future price action.
Crypto trading involves substantial risk and is not suitable for everyone. Nothing here is financial advice; it is education only. Never risk more than you can afford to lose.








Join the discussion
No comments yet. Members, share how you are reading this.