



In short: Wyckoff schematics map how supply and demand shift inside a trading range before a big move. Read them phase by phase, A to E, not as one signal. A Spring or Upthrust means little until the following test and price behaviour confirm it.
Wyckoff schematics show how supply and demand shift inside a trading range before a large move. Read them in sequence, Phase A through Phase E, rather than as one signal on the chart.
This lesson breaks down the actual Accumulation and Distribution schematics, phase by phase. You learn to follow the changing relationship between price, volume, supply and demand.
MyCryptoParadise is a professional crypto signals and trading-education service operating since 2016. The goal here is to teach the market structure behind these patterns, not to memorise labels.
What are Wyckoff schematics?
Wyckoff schematics are simplified visual maps of how a trading range develops before a significant directional move. They come from the Wyckoff method, a century-old approach to reading supply and demand.
There are two core forms, plus a common variation:
- Accumulation: a possible transition from Markdown into a new uptrend.
- Distribution: a possible transition from an uptrend into Markdown.
- Redistribution: a range inside an existing downtrend before another decline.
The schematic is not a prediction by itself. It is a framework for reading the sequence of events inside the range.
Wyckoff Accumulation schematic
The Accumulation schematic shows selling pressure fading while demand absorbs supply. It usually runs from a downtrend through PS, SC, AR and ST, then a trading range. A possible Spring follows, and finally SOS and LPS before Markup.
Phase A: stopping the downtrend
Phase A is where the earlier bearish trend shows its first evidence that downward progress is being interrupted.
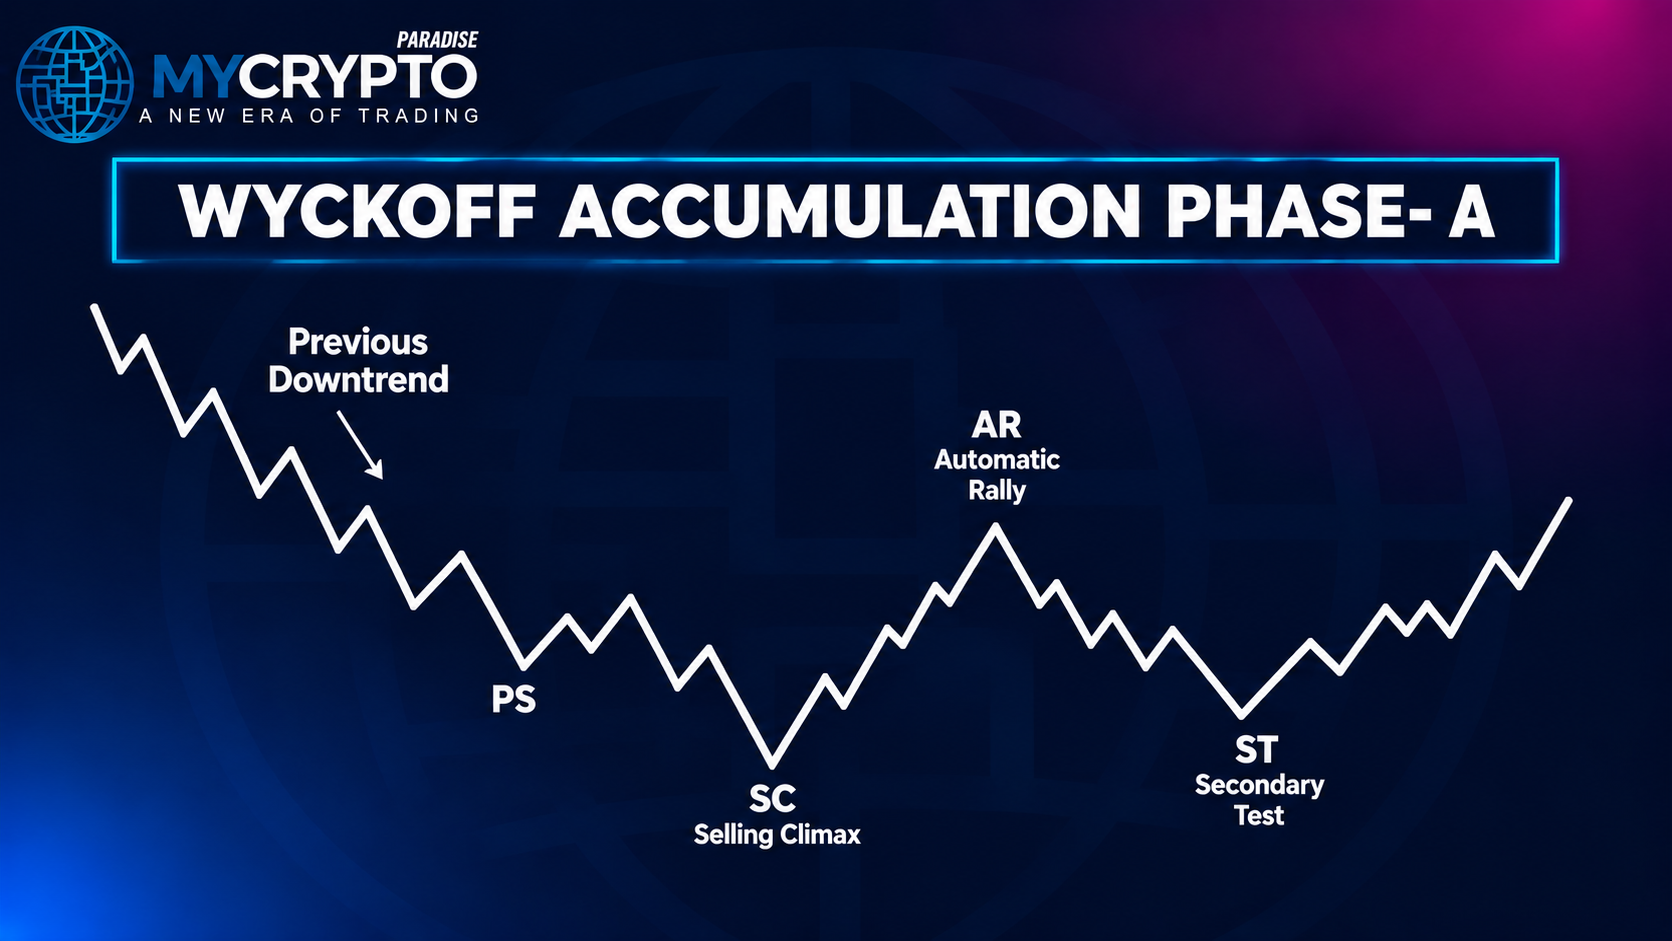
Preliminary Support (PS) appears when meaningful buying starts to absorb selling. The Selling Climax (SC) is where selling becomes intense and price reacts sharply.
After the SC, an Automatic Rally (AR) can occur as selling eases and buyers lift price. A Secondary Test (ST) then revisits the area around the SC.
Phase A becomes convincing once price stops making steady downside progress and starts building a range. This does not by itself mean a new bull market has begun.
Phase B: building the cause
Phase B is usually the longest part of Accumulation. Price moves back and forth inside the range while supply and demand keep interacting.
Watch how price behaves at the range boundaries. Repeated tests of support show whether sellers can still force price lower. Rallies toward resistance show whether demand is strengthening.
Read volume with price, never alone. Heavy selling that produces smaller and smaller downside moves can signal that supply is being absorbed.
Phase C: testing supply
Phase C is where the classic Spring may appear. A Spring breaks briefly below support, then recovers back into the range.
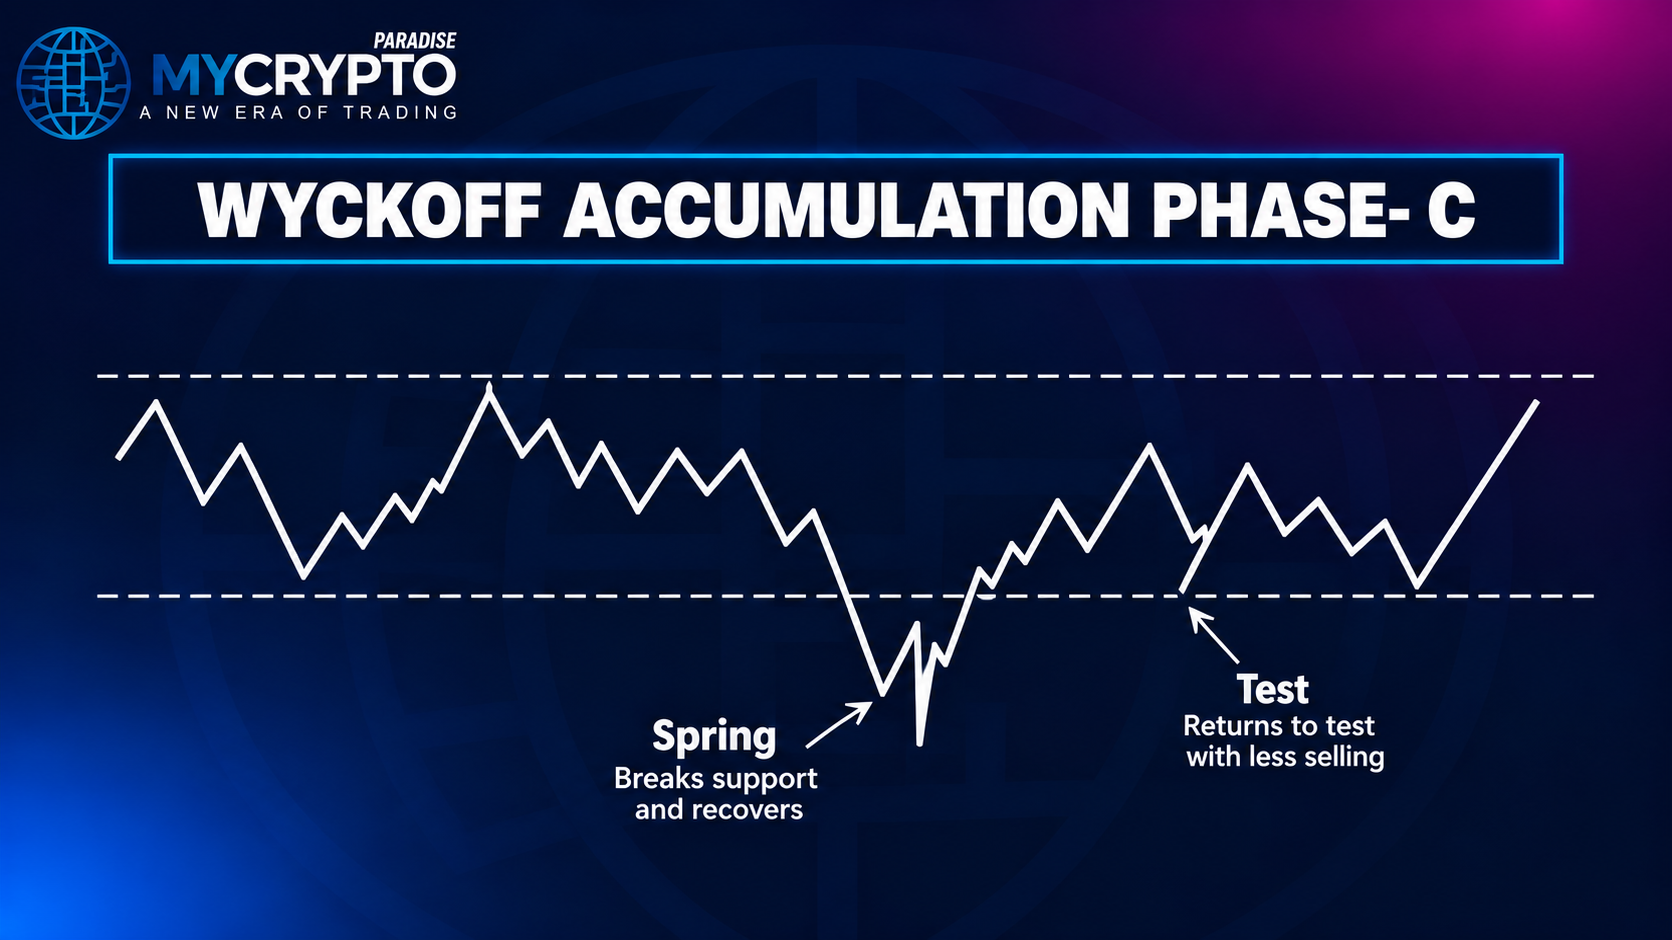
The Spring tests whether real supply remains below support. If the break attracts little selling and price quickly recovers, sellers may have lost control at lower prices.
The following Test is critical. Price may revisit the lower range with reduced selling. A Spring without a successful test is not automatic confirmation.
Wyckoff pairs well with other tools. A Spring that lines up with a bullish engulfing pattern or a piercing line pattern adds candle-level evidence to the phase read.
Phase D: demand takes control
Phase D is where rising demand becomes clearer. Price moves from the lower range toward resistance and produces a Sign of Strength (SOS).
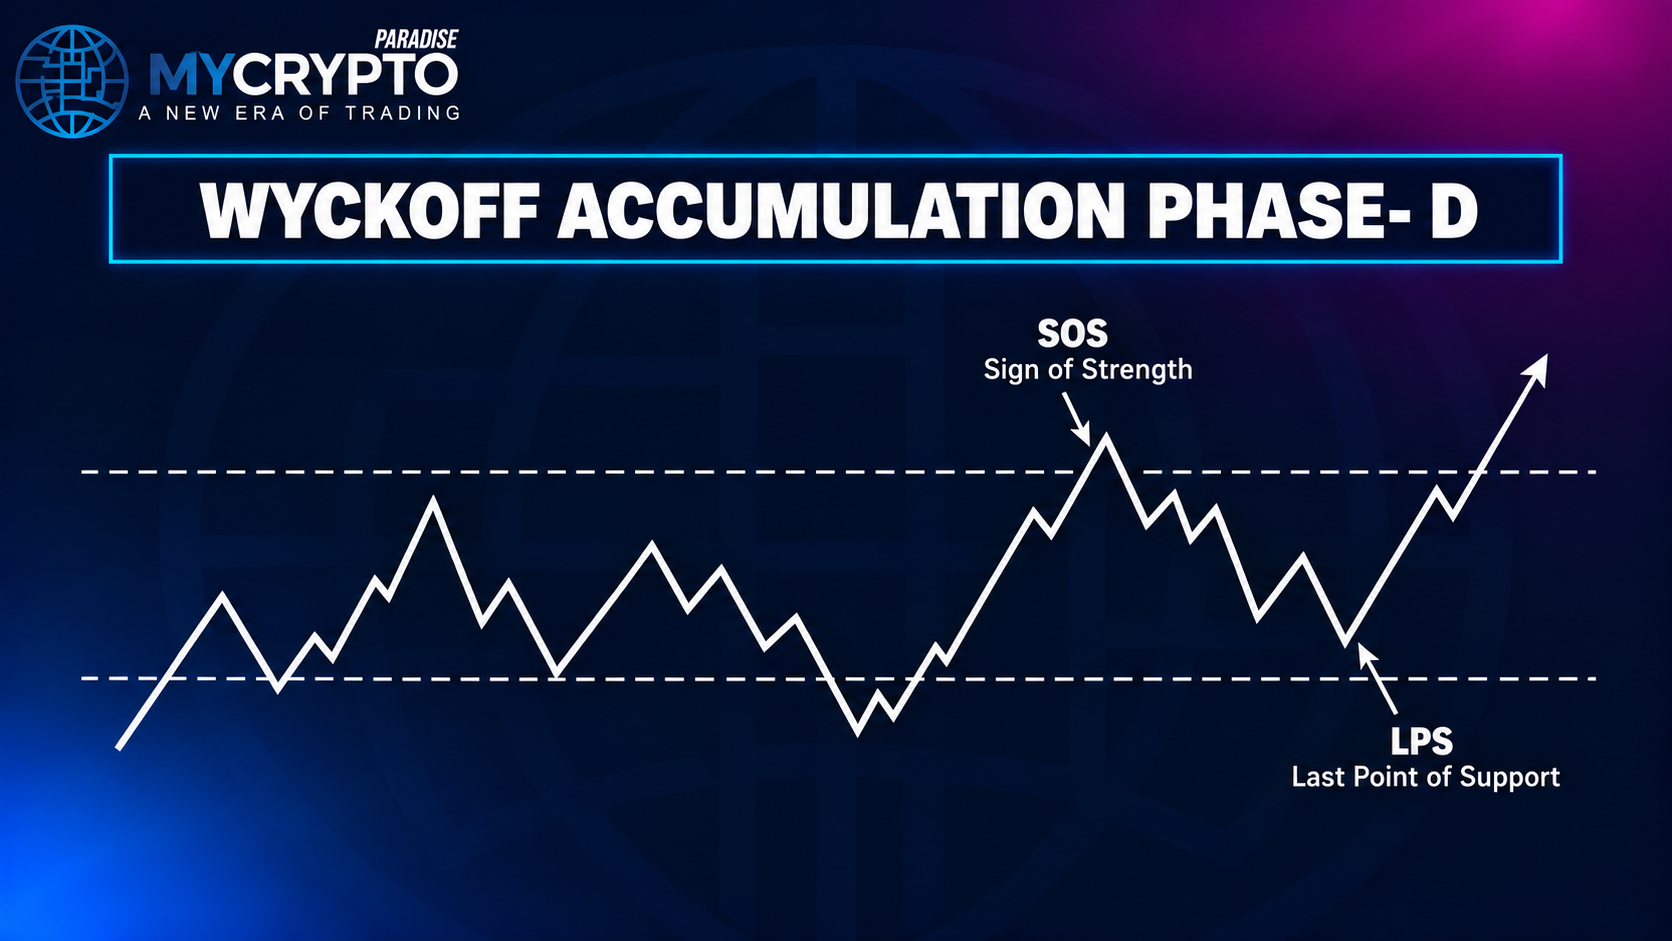
An SOS is an upward move showing demand can make real price progress. It often comes with wider spread and higher volume, though volume always needs context.
The pullback after an SOS can form a Last Point of Support (LPS). If sellers cannot push price deep back into the old range, demand is showing control.
Phase E: leaving Accumulation for Markup
Phase E begins when price decisively leaves the range and starts a sustained rise. Higher highs and higher lows confirm the move into Markup.
Phase E is stronger when price holds above resistance and the LPS holds. A brief breakout that falls straight back into the range is not enough.
Wyckoff Distribution schematic
Distribution is the mirror process. It usually forms after a strong advance, as demand weakens and supply grows. The events run through PSY, BC, AR, ST, UT or UTAD, SOW and LPSY before Markdown.
Phase A: stopping the uptrend
Phase A begins when the earlier advance shows its first evidence that upward progress is being interrupted.
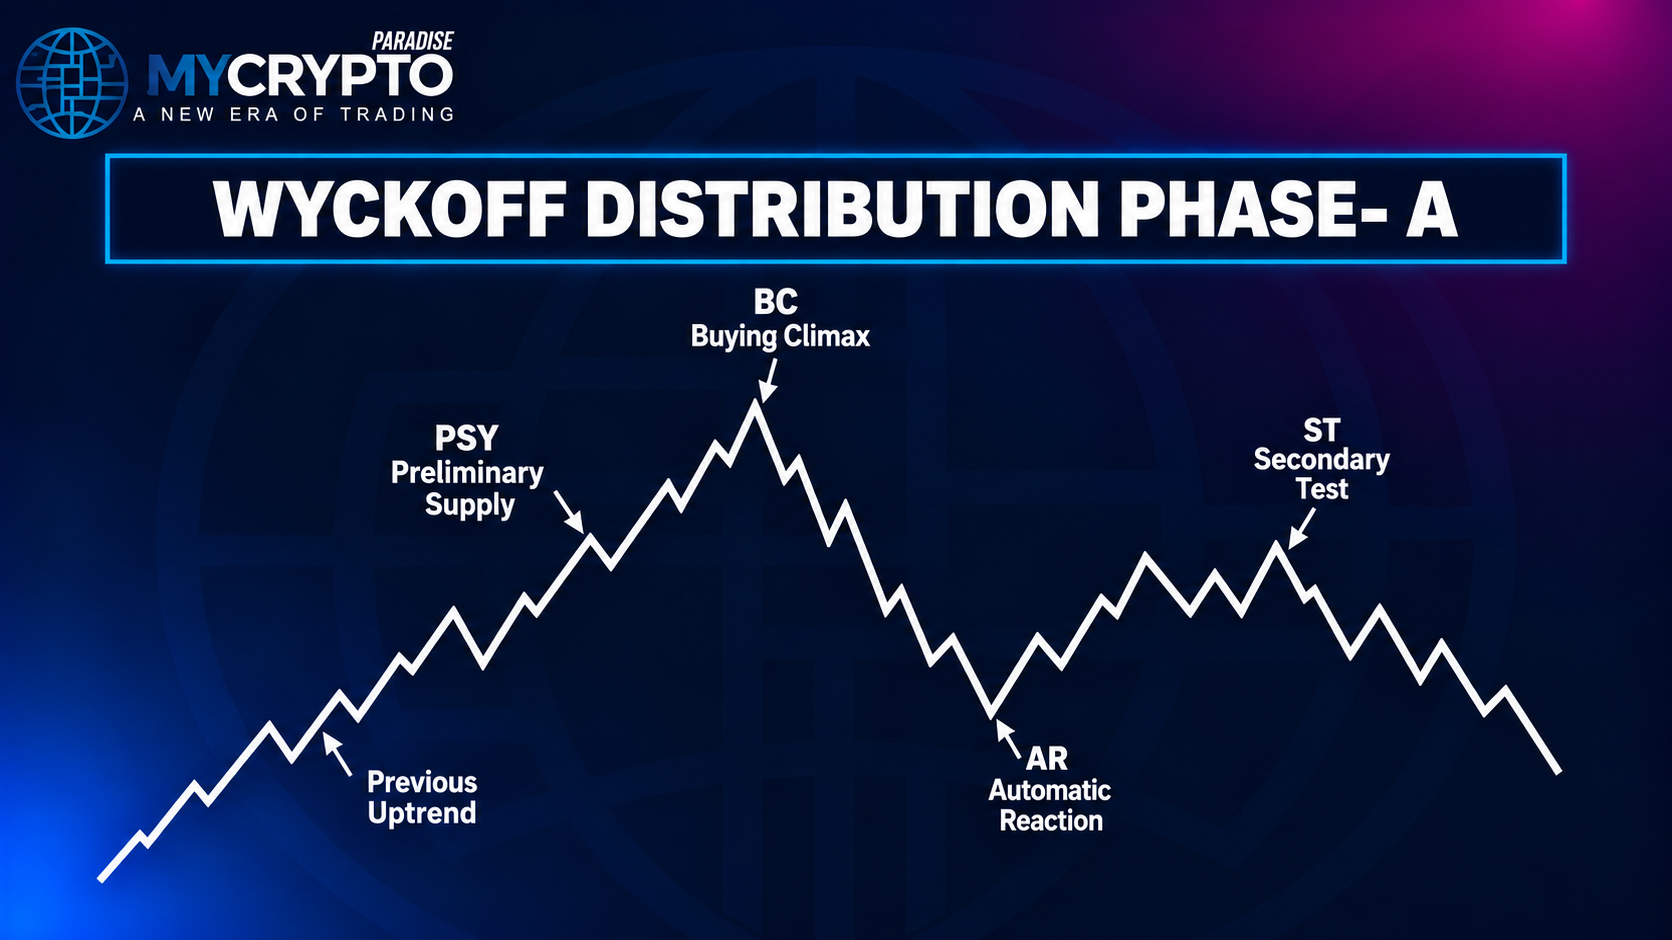
Preliminary Supply (PSY) signals that meaningful selling is starting to appear. A Buying Climax (BC) can form when aggressive demand lifts price but heavy supply enters.
An Automatic Reaction (AR) then shows price can fall hard when buying weakens. A Secondary Test (ST) revisits the highs to see if buyers can repeat their strength.
Phase B: building the distribution cause
Phase B develops the range. Price can still make apparently bullish moves, but the balance between effort and result matters more and more.
Watch rallies into resistance, failed breakouts, and the ability to hold higher prices. Heavy buying with limited upside can suggest supply is absorbing demand.
Phase C: testing demand
Phase C in Distribution is where an Upthrust (UT) or UTAD (Upthrust After Distribution) may appear. A UTAD is a false upside breakout: price pushes above resistance late in the range, fails to hold, and falls back inside.
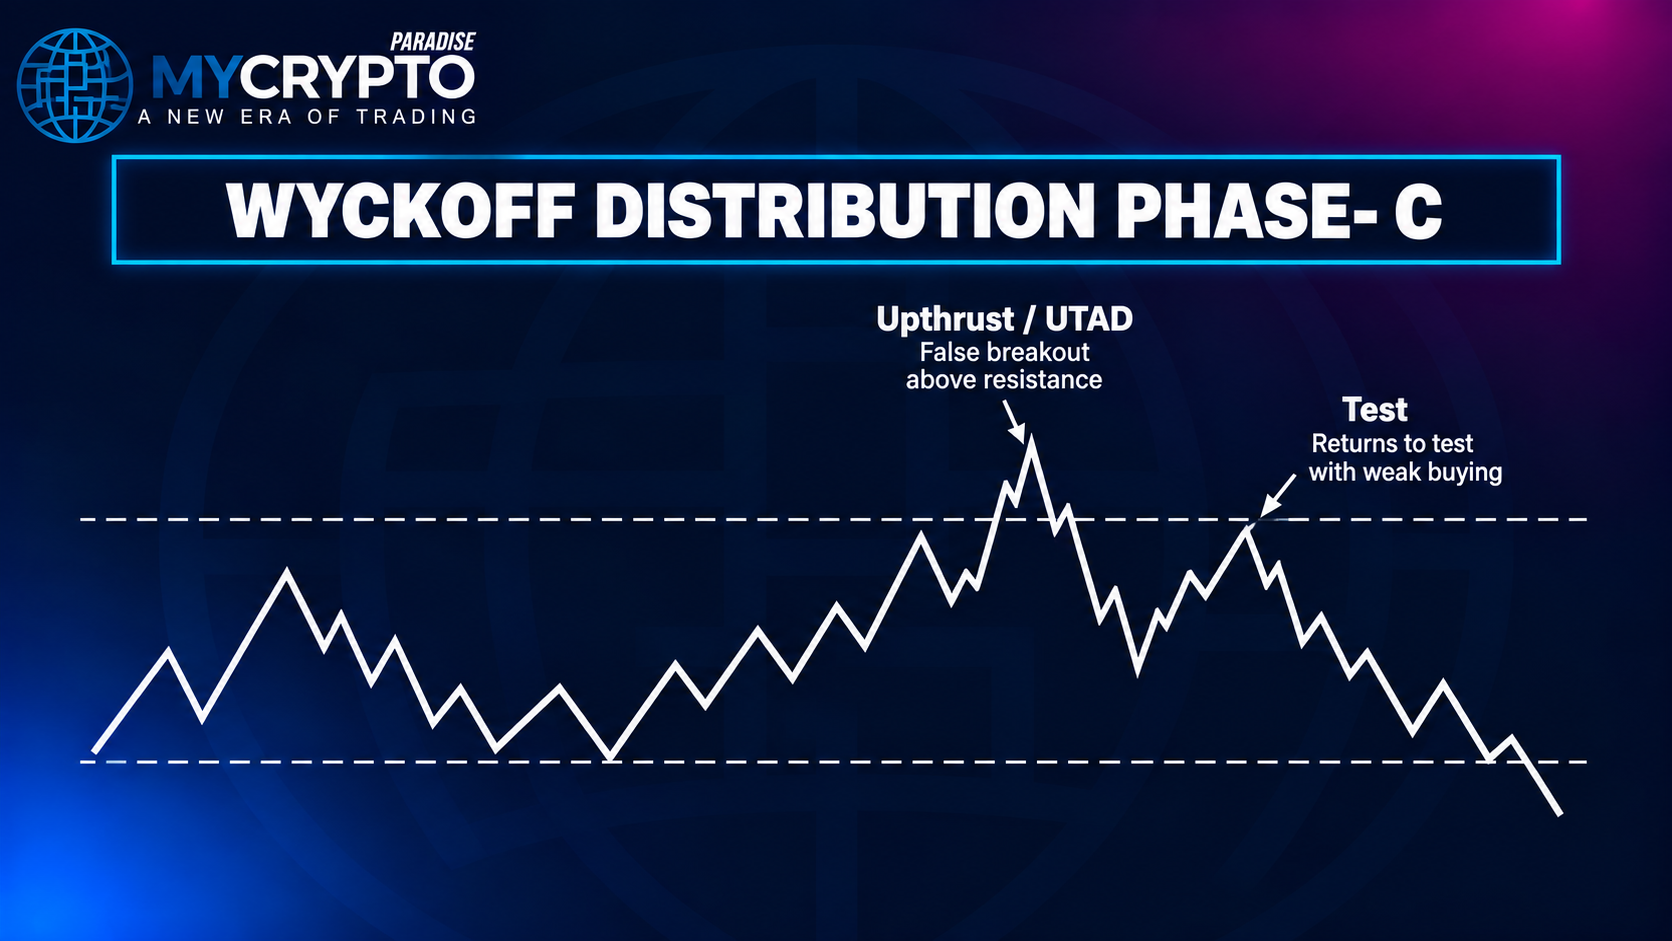
The market first looks strong by moving above resistance, then fails to hold it. The key question: can buyers reclaim and defend the breakout area?
A following Test matters. If price returns to the highs with weaker buying and less progress, the Distribution reading strengthens. An Upthrust alone is not a short signal.
Phase D: supply takes control
Phase D gives stronger evidence that the range is turning toward Markdown. The main event is the Sign of Weakness (SOW).
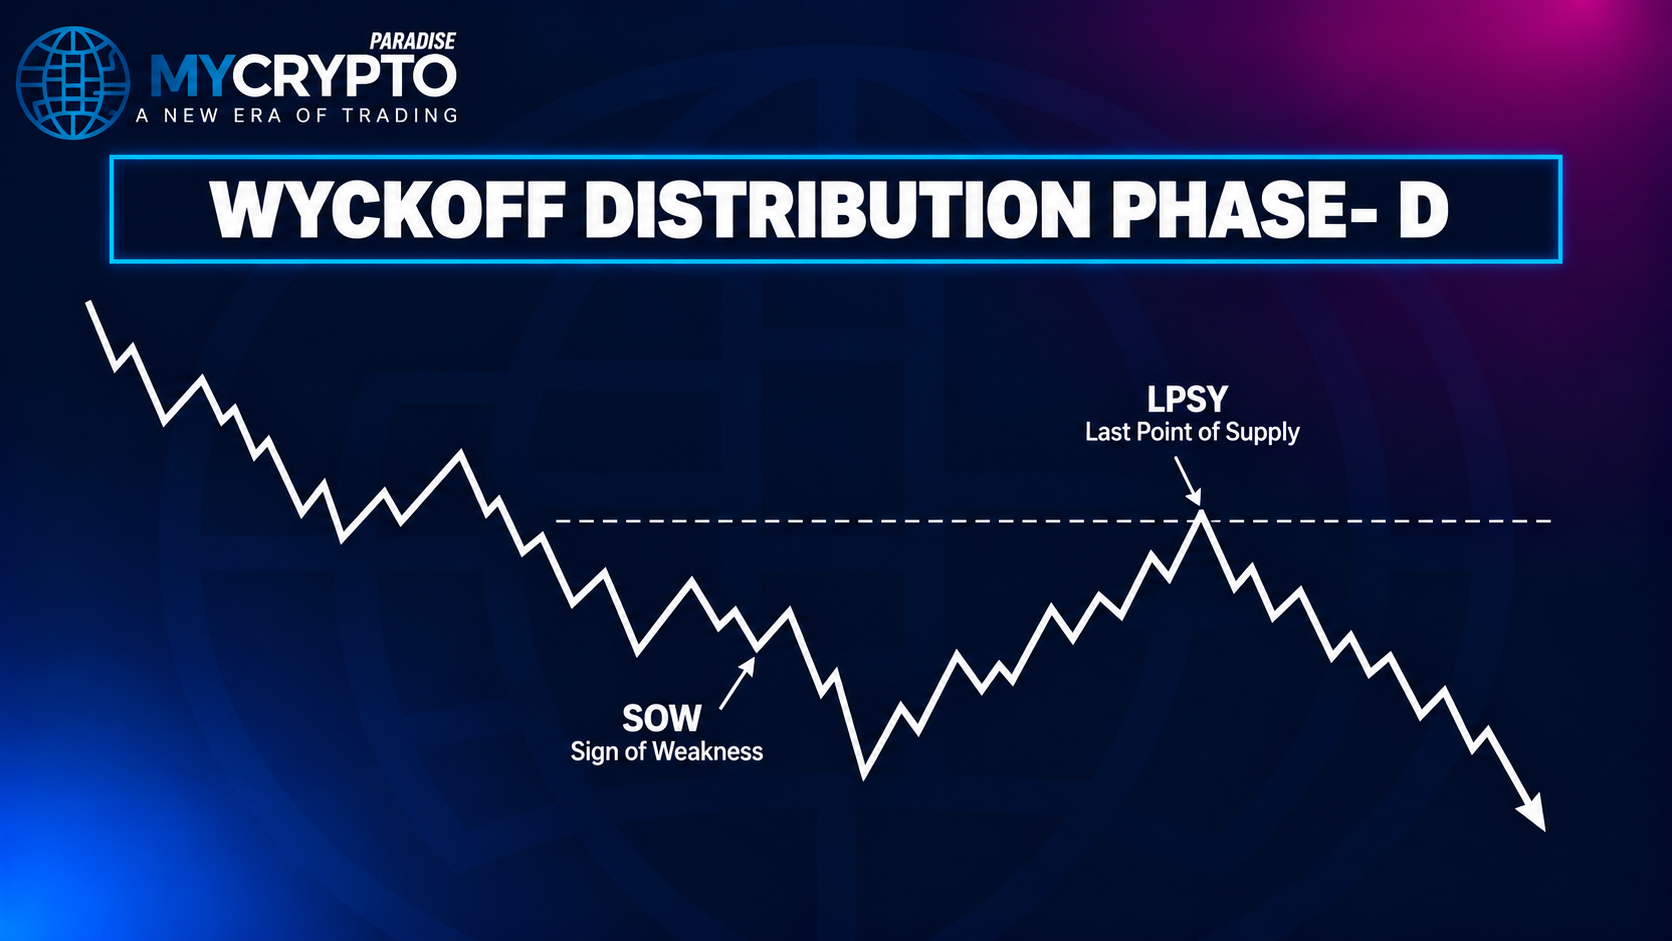
An SOW shows supply can make real downside progress. Price may break important support and move sharply lower.
A weak rally back toward former support can form a Last Point of Supply (LPSY). It is the bearish counterpart to the LPS in Accumulation.
Phase E: leaving Distribution for Markdown
Phase E begins when price decisively breaks down and sustains the move. Lower highs and lower lows confirm the transition into Markdown.
Former support that now acts as resistance is another confirming sign. A brief breakdown that recovers into the range is not enough.
Spring versus Upthrust
A Spring sits near the lower boundary of Accumulation. Price breaks below support, returns into the range, and tests whether supply remains. It can lead to SOS and LPS.
An Upthrust sits near the upper boundary of Distribution. Price breaks above resistance, returns into the range, and tests whether demand remains. It can lead to SOW and LPSY.
SOS versus SOW
A Sign of Strength shows demand can move price up with real progress. It supports the shift from Accumulation toward Markup.
A Sign of Weakness shows supply can move price down with real progress. It supports the shift from Distribution toward Markdown.
How to read the schematic on a crypto chart
Do not start by hunting for a Spring or UTAD. Start with the whole structure and work through it in order.
- Identify the previous trend. A range after a major advance differs from a range inside a long downtrend.
- Find the stopping action. Look for PS/PSY, SC/BC, AR and ST behaviour.
- Define the range. Mark support and resistance, then watch how price reacts at each side.
- Study Phase C. Look for a Spring and Test, or an Upthrust and Test. Do not force it.
- Wait for Phase D. Accumulation should show SOS then LPS; Distribution should show SOW then LPSY.
- Recognise Phase E. Confirm price has truly left the range with sustained progress.
Range boundaries also gain context from market-wide data. Check crypto funding rates, a liquidation heatmap, and the crypto fear and greed index alongside the schematic.
Some traders map these phases against Elliott Wave structure to cross-check where a trend may sit. Treat every framework as a lens, not a guarantee.
Common mistakes when reading Wyckoff schematics
Forcing every chart into the textbook pattern. Real crypto rarely matches the diagram exactly. A Spring may be absent, tests may repeat, and phases can overlap.
Calling every range Accumulation or Distribution. A sideways market can simply be consolidation. The prior trend, volume, spread and breakout direction all matter.
Treating a Spring as an automatic buy. A break and recovery is not enough. The Test and later strength provide the real evidence.
Treating an Upthrust or UTAD as an automatic short. A failed breakout matters more once later price action shows buyers cannot regain control.
Ignoring Phase D. Spring and UTAD look dramatic, but Phase D often gives the real confirmation through SOS/LPS or SOW/LPSY behaviour.
Expecting Phase E immediately. A schematic can take time to develop. Even after price leaves a range, countertrend reactions are normal.
Practice this
Open a higher-timeframe crypto chart and pick a clear past range. Label the previous trend first, then the stopping action.
Mark support and resistance, then annotate any Spring, Upthrust, SOS or SOW you can find. Ask what price and volume were actually proving at each phase.
Trading involves substantial risk, so treat schematics as a framework for reading structure, not as personalised financial advice.
FAQs
What are the five Wyckoff phases?
Phase A stops the previous trend. Phase B builds the trading range. Phase C tests supply or demand. Phase D gives directional confirmation through SOS or SOW. Phase E is the move out of the range.
What is the difference between Accumulation and Distribution?
Accumulation usually develops after a downtrend and can lead toward Markup. Distribution usually develops after an uptrend and can lead toward Markdown. Their schematic events are largely opposite in function.
Is a Spring required for Accumulation?
No. A textbook Spring is a common Phase C event, but many real ranges accumulate without one. The wider supply and demand evidence matters more than completing every schematic event.
What is a UTAD?
UTAD stands for Upthrust After Distribution. It is a false upside breakout late in the range. Price pushes above resistance, fails to hold, and drops back inside, hinting that demand is weaker than it looked.
Can Wyckoff schematics work on crypto?
Yes, because crypto markets also show shifting relationships between price, volume, supply and demand. However, crypto can be noisy and irregular. Treat textbook schematics as frameworks, not exact templates.
Risk disclaimer: Crypto trading involves substantial risk of loss. This class is education only, not financial advice. Never trade with money you cannot afford to lose. Past results do not guarantee future results.














Join the discussion 23
i always found wyckoff tricky to implement consistently, especially when i first started trying to convert it to sats. it's a useful framework though, when applied with caution.
For me, the key is what happens with demand after the Spring - if it's not real buying, you're just exit liquidity.
I'm still learning to spot these phases in real-time... sometimes it feels like looking at clouds and trying to see animals. 😅 Do others also find the "Spring" a bit tricky to confirm until it's already passed?
I really pay attention to the selling climax 📉 and second test points because they can give us a super clear picture of where things are heading 🚀. It's like the market is speaking directly to you! 👂✨
totally! i like to think of that second test as my chance to get chopped up AGAIN after the spring already took me out 🤦♂️. anyone else?
olivia, i agree those points are instructive, but i find the subsequent signs of strength and weakness often provide the more reliable confirmation.
ha, i hear ya on the clear picture 🖼️, but for me, phase A volume always sets teh tone too, proper mad sometimes 💥.
I’m sorry, I keep mixing up the Spring and the Shakeout in my head, thinking they are the same part of the Accumulation scheme. Is that bad for understanding the whole thing?!
ah yeah, its easy to mix those up marta 🤔 especially when you get a false spring that looks like a shakeout and then bounces hard! 😅📈
I gotta say, after that memecoin ride and rug pull in '21 🎢😅, I’m looking at these SOS points like I missed the boat *again*! 🤦♂️ Always learning, right? 📈
man, i always feel like i'm looking at the schematic in hindsight and going "yep, totally saw that spring!" 🫠 anyone else constantly late to the party?! 😅
Benny, I swear it’s the routine that helps me catch them, you know? ⏰🧘♀️ My London open ritual makes all the difference! ✨ You got this! 💪
Yeah, I'm finding the Wyckoff stuff fascinating, especially tracking those Springs and UTADs. I try to overlay it on multiple timeframes to get a better sense... 🤔 helps me not miss those bigger shifts.
Noah, I see your angle with the multi-timeframe overlay, but for me, a Spring or UTAD needs a clean volume profile on its original chart to pass my risk-reward audit. Otherwise, it’s just another line item that won't reconcile! 😉
Noah, I get you! 🤝 Tracking those bigger shifts is why I stick to my 15m like glue, ⏰ it makes all the diff for me everyday. 🔥
Right, the UTAD's are a head-scratcher for me 🤯 trying to see if they're real exhaustion or just a fake-out before the drop 👇. Always keep an eye on that volume, big time 📈.
The focus on these precise "Springs" for a market turning point always feels like an overreliance on technical lines, ignoring the actual liquidity that underpins any real demand. ??
Yeah, Priya, it's less about the exact point and more about seeing the whole interaction, like how a UI element reacts to input! So clean when it plays out. ✨
I've found the Wyckoff schematics quite useful for managing my entries, especially when I used to get caught chasing pumps after the Spring. 😅 It really teaches patience.
Glad to hear you're finding your feet with it, Rahul! 🫂 Small sizing around the Spring saved my bacon too, proper sound advice really. 📈 Keep at it! 🔥
i keep thinking about those phase d upthrusts after distribution and if its always organic volume or not
I find the focus on precise price levels for the Spring or UTAD points a bit challenging, as market moves often lack that exact symmetry. It seems more like a descriptive framework than a predictive tool for specific entries.
Priya the market often shows a clear reaction to those levels at least 60% of the time you need to watch for the volume to confirm it