

In short
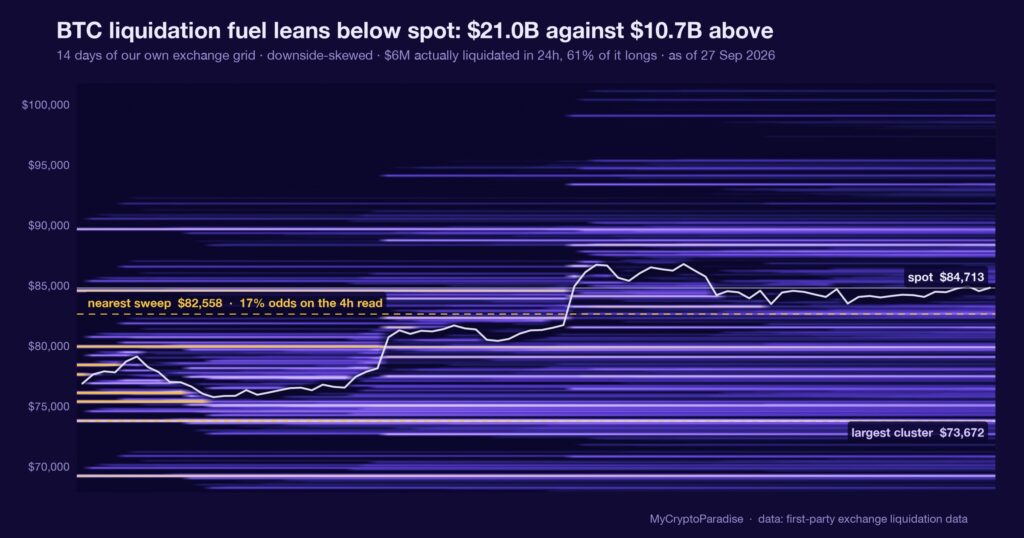
A liquidation map estimates how much leveraged position value would be force-closed at each price, so a lopsided map shows where the forced flow would be heaviest. Our MCP Insights liquidation reading on 27 September 2026 puts $21.0B of BTC fuel below spot against $10.7B above, a 2.0 to 1 skew and an imbalance score of -33. The heavier pocket still sits below, but we are calling this neutral, not a downside call. Five days earlier the same map read $26.1B below against $10.2B above, a 2.5 to 1 skew at -44: the downside pocket has drained while the upside has filled. That is the reading that changed this week, and it is why the defensive lean from 22 September no longer earns the same size. This piece shows you how to read a liquidation map yourself, and when a narrowing skew stops being a lean at all.
Key facts
- BTC spot at the reading
- $84,713
- Estimated BTC liquidation fuel above spot
- $10.65B
- Estimated BTC liquidation fuel below spot
- $20.99B
- Fuel balance
- downside-skewed, -33 points toward the heavier side
- What would prove this read wrong
- The imbalance widening back toward -44 as fresh leveraged longs stack below spot, which would rebuild the downside pocket; or the pocket above growing past the one below, which would flip the forced flow to the short side.
- Reading taken
- 27 September 2026
- Source
- Our MCP Insights tools, from first-party exchange data
A liquidation map is a fuel gauge, not a forecast
Every leveraged long has a price where its margin runs out and the exchange closes the position for it. A liquidation map estimates those points across all open positions and stacks them into pockets above and below spot.
Where a pocket is large, a move into it feeds on itself. Each forced close pushes price further, which trips the next cluster of stops, which forces the next close.
So a lopsided map is a statement about fuel, not about direction: it says which way a move would travel further once it starts, not whether it starts at all. A gauge that shows where the tinder sits is not the same as a match.
The pocket below is bigger, and it is shrinking
Our MCP Insights liquidation reading for 27 September 2026 puts $21.0B of BTC fuel below spot against $10.7B above. That is a 2.0 to 1 skew toward the downside, with an imbalance score of -33 on a scale where zero is balanced.
Five days earlier, on 22 September, the same map read $26.1B below against $10.2B above: a 2.5 to 1 skew at -44. In five days the downside pocket has drained by $5.1B while the upside has added $0.5B.
This is a model estimate, flagged as estimated in our own feed, not a calibrated historical frequency. Base rates for liquidation-fuel regimes are not wired into our data yet, so we quote no hit rate here. The direction of travel is the reading, and it points toward balance.
What is different here
The ParadiseTeam does not read a liquidation map for a target. We read it for asymmetry and then for change: not just which pocket is bigger today, but whether it grew or drained since we last looked. A static skew is a snapshot; the direction it is moving is the reading.
A 2 to 1 skew is a lean, not a level
The obvious misreading is to treat $21.0B below as a target. It is not. It is the size of the pocket that would burn if price fell into it, and nothing on the map says price goes there.
What the number does justify is one line of risk. A pocket twice the size of its opposite is a real asymmetry: a move down would find more forced sellers than a move up would find forced buyers. That is worth respecting, and it is worth exactly one line of risk, not a position built around it.
This is one input. It sits alongside funding, open interest and the order book walls, and on its own a fuel map weights a bias rather than setting one. A read that treats a single gauge as a decision has stopped measuring and started guessing.
The defensive lean from last week is fading
On 22 September we leaned defensive on this map, at a 2.5 to 1 skew and an imbalance of -44. That lean earned its line of risk then. It earns less now.
The reason is mechanical, not a change of mind. Fuel drains two ways: positions get liquidated, or traders close them voluntarily as price stabilises. Either way the pocket that sized last week’s caution is $5.1B smaller, and the gap has closed from -44 to -33 without a violent flush to explain it.
A lean that is fading should be sized down, not defended. The honest move when your own evidence weakens is to say so, in public, before the number forces you to.
What would make either side matter again
For the downside pocket to matter again, the skew has to stop narrowing and start widening: fresh leveraged longs stacking below, pushing the imbalance back toward -44 or worse. That would rebuild the fuel this week has drained.
For the upside to take over, the map has to flip: the pocket above growing past the one below, which would put the forced flow on the short side. Right now it is $10.7B against $21.0B, so that is a long way off.
Neither has happened. The map is drifting toward balance, and a balanced map is the one state where it has nothing useful to say. A gauge honest enough to go quiet is worth more than one that always finds a signal.
Reading a liquidation map yourself, step by step
- Open the liquidation heatmap and note the total fuel sitting above spot and below it, in dollars.
- Divide the larger pocket by the smaller to get the skew ratio, and read the imbalance score for its sign.
- Compare today’s skew and imbalance to the same map a few days ago, so you see direction, not just level.
- Treat the larger pocket as where a move would travel further, never as a price target the map is calling.
- Size the read to one line of risk, and set the invalidation at the imbalance flipping toward balance or across zero.
The step people skip is the third one. A single snapshot tells you where the fuel sits; only the comparison tells you whether the setup is building or dying.
Every number above is checkable against the live data. Start with the crypto liquidation heatmap, then cross-read the MCP Insights hub and the Crypto Fear and Greed Index.
Act and invalidate
| Scenario | What confirms it | What kills it |
|---|---|---|
| Skew keeps draining toward balance | Imbalance rises above -20 | Fresh longs stack below and reload it |
| Downside pocket reloads | Imbalance falls back toward -44 | Upside fuel grows past the below pocket |
| Map goes balanced, no edge | Both pockets within a small gap | Either side pulls past 2 to 1 again |
Posture: Neutral and patient. The weight still sits below at 2 to 1, but it is draining fast enough that neither side has earned size; the honest posture is a small defensive tilt held on a short leash.
Frequently asked questions
What does a liquidation imbalance of -33 mean?
It means the estimated liquidation fuel below spot outweighs the fuel above it, on a scale where zero is balanced and negative leans downside. At -33 the below pocket is roughly twice the size of the one above, a real but moderate asymmetry.
Does more fuel below mean Bitcoin has to fall?
No. A larger pocket below shows where a move would travel further if selling starts, not that selling starts. The map sizes the consequence of a move, and says nothing about what triggers one, so it is a risk weight and not a forecast.
Why did the skew fall from 2.5 to 2.0 in five days?
The downside pocket drained by about $5.1B while the upside added roughly $0.5B, closing the imbalance from -44 to -33. Fuel drains when positions are liquidated or when traders close leveraged longs voluntarily as price steadies, and here there was no violent flush.
Is a liquidation map enough to trade on?
No, it is one input among several. It weights a bias you already hold from funding, open interest and spot flow; it does not set the bias by itself. A single gauge treated as a decision is guessing dressed up as measurement.
What would invalidate the current neutral read?
Two things, in opposite directions. The imbalance widening back toward -44 as fresh longs stack below would restore the downside lean, while the pocket above growing past the one below would flip the forced flow to the short side entirely.
Crypto trading involves substantial risk and is not suitable for everyone. Nothing here is financial advice; it is education only. Never risk more than you can afford to lose.
The private Extras feed, where the liquidation fuel map, its skew ratio and imbalance score update intraday with invalidation levels attached, is part of PRO Paradiser, the intelligence layer behind the ParadiseFamilyVIP strategies.














Join the discussion 17
Yeah, I used to ignore skew completely 🤦♂️ just chasing narratives like a crazy person 🚀. Now I look at it with open interest too, for real. 🔥
Used to track that for a buddy in '21... the skew always looks safer in hindsight. Keep an eye on it.
Hindsight's a lovely account, isn't it? 😂 I find that without stop distances logged at entry, "safer" often equals "shoulda sold.
futures narrowing still points to a focus on these short-term plays, which is what worries me. its like watching a generation get drawn to the same old schemes.
yeah I remember in 2021 when the basis was wild and this metric felt a bit less predictive somehow, probably due to the sheer size of perp open interest then. interesting to see how it’s evolving now.
Honestly, this "draining" angle feels a bit overplayed here. Four-hour noise is not a signal, people! 🙄 I'm sticking to the weekly closes.
ingrid, its the four-hour moves that drain the accounts tho, not the weekly ones
The skew narrowing is notable. I typically cross-reference this with open interest on weekly session opens.
That's interesting Kenji-san! I’ve been thinking about how this might affect the overall market sentiment too. 🤔
that makes sense Kenji, i also track funding rates for perpetuals at those session opens, it helps confirm the directional bias.
Liquidation heat maps for the order books are critical... I note the ratio of longs to shorts and compare that to funding rates. Rule #10: Follow the liquidity.
so yeh, this skew narrowing is exactly where the damage gets done 🤦♂️, all this fuel draining looks like a quiet trade until its not. aint it? 😠📉
I wonder how much of this drain is from organic volume versus concentrated whale activity. Is there data on large block trades contributing to the narrowing skew?
yes Sofia that drain is always tricky to parse, i also look at the stablecoin netflows to and from exchanges for a better sense of organic demand versus whale movement
this "fuel" is what destroys accounts, not builds them. borrowing to chase a lean, even a small one, rarely ends well. 😠
I worry about being exit liquidity in a narrowing skew... always makes me double-check my stop losses. Kenji, do you also check OI on other pairs?
remember buying into the "no more downside" talk in '21 before the real flush. this narrowing looks like a trap for anyone still long on conviction.