

In short: Fibonacci extensions project reference levels beyond a measured swing. They help you plan possible reaction areas and take-profit checkpoints, never guaranteed destinations. Always define invalidation and position size first, because price can reverse before a target or run far past it.
Fibonacci extensions project reference levels beyond a measured price swing. They help crypto traders plan possible reaction areas, not predict guaranteed destinations. Treat each level as a checkpoint, never a promise.
Crypto markets often move in impulses followed by corrections. Extensions give you a consistent way to project where a move might travel if it resumes.
This lesson sits in the advanced technical tools track at MCP University FREE. MyCryptoParadise has offered professional crypto signals and trading education since 2016, and this tool connects naturally with wave and harmonic analysis.
Retracement, extension and projection explained
A Fibonacci retracement measures how much of a prior swing price gives back during a correction. An extension projects possible levels beyond that swing.
Traders use retracements to study pullback depth. They use extensions to plan potential targets if price continues in its original direction.
The words extension and projection are sometimes used interchangeably. Here, extension means the levels plotted by a trend-based tool using three anchors.
Point A marks the impulse start. Point B marks its end. Point C marks the end of the pullback.
In an uptrend, A is usually a swing low, B a swing high, and C the correction low. In a downtrend, the roles invert.
A level does not cause price to move toward it. Price may react before it, pass through it, or reverse somewhere else entirely.
The levels: 1.0, 1.272, 1.618 and 2.618
The 1.0 level projects a move equal to the A to B impulse, measured from C. It is often called the equal-move projection and acts as an early checkpoint.
The 1.272 level projects 1.272 times the measured impulse. It serves as an intermediate planning reference when price continues beyond the equal-move target.
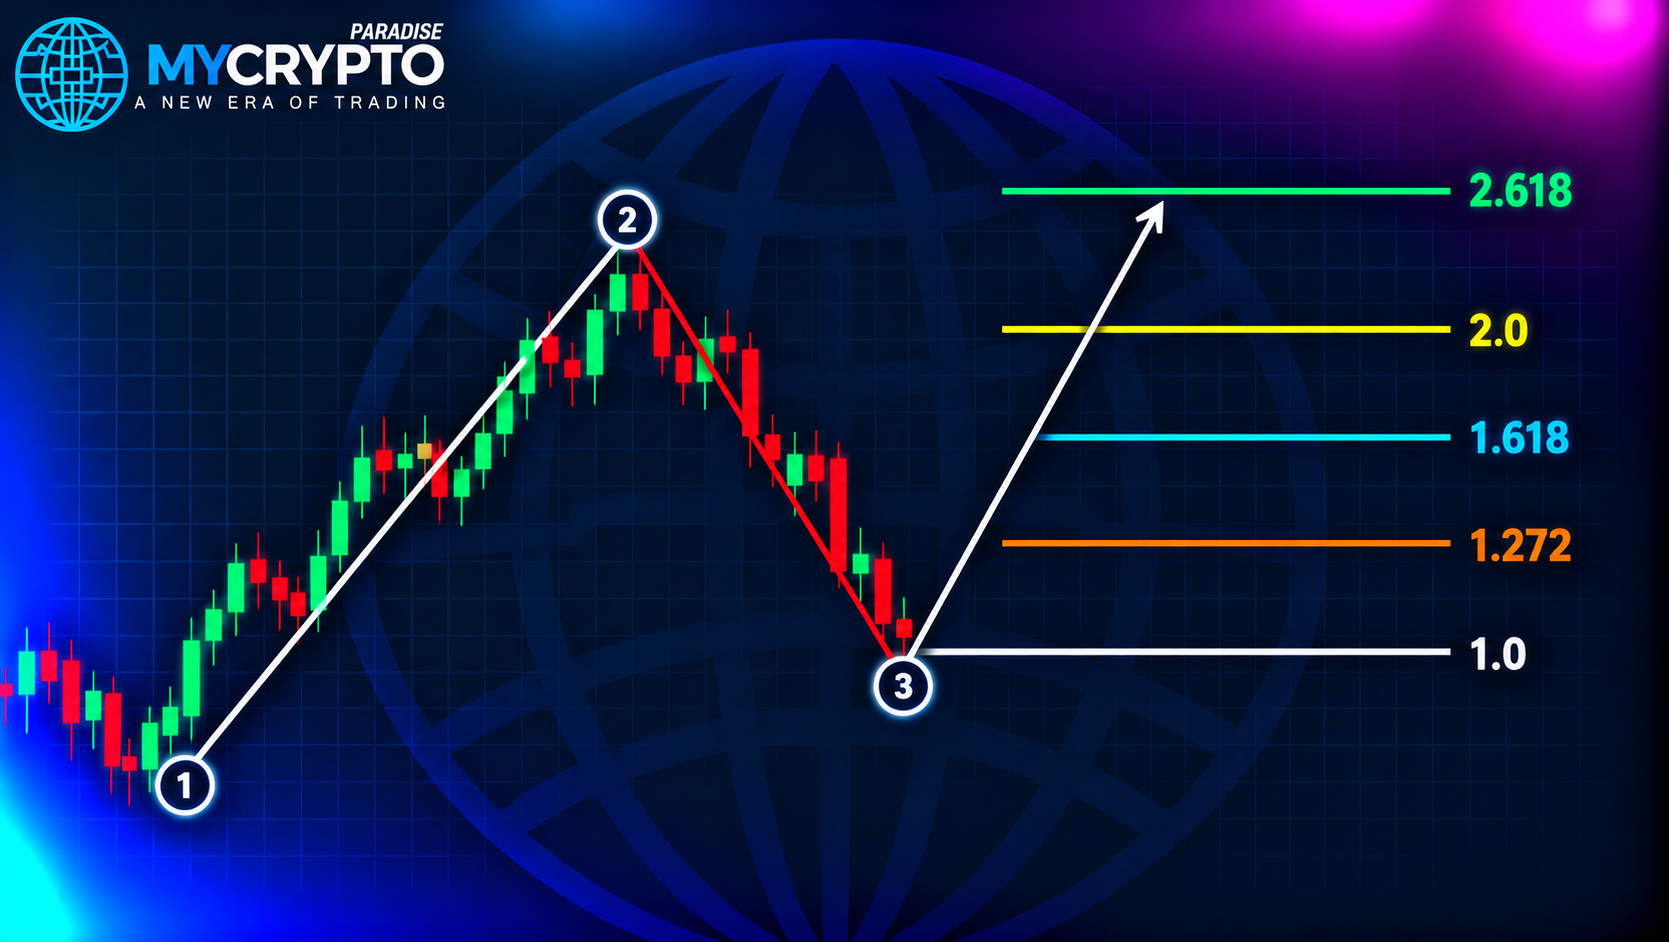
The 1.618 level is widely watched because it relates to the golden ratio. Some traders treat it as an objective for a strong continuation, but popularity does not make it a turning point.
The 2.618 level is a farther projection. It can help scenario planning during an unusually strong trend, yet distant targets need frequent reassessment.
Some tools also show a 0.618 projection, which may describe a shorter projected leg. For background on the golden ratio in markets, a crypto education academy offers introductory lessons.
Keep the chart readable. A small, consistent set of levels is easier to evaluate than a chart crowded with ratios.
How to draw a trend-based extension
Start with a clear impulse that changed market structure. Mark its beginning as A, its end as B, then identify the correction end as C.
If the pullback is still developing, wait. Do not choose a temporary point simply to generate targets.
For a bullish example, price rises from 100 to 120, then corrects to 112. The impulse measures 20 points.
The 1.0 projection is 132, the 1.272 projection is 137.44, and the 1.618 projection is 144.36. These are mathematical examples, not forecasts.
Use the timeframe that matches your question. A daily swing frames a broader target, while an intraday swing suits a shorter plan.
Avoid changing anchors after seeing the outcome. That creates hindsight bias and makes the tool look more reliable than it really was. For broader context, study Elliott Wave impulse structure.
Planning take-profit targets
Treat extension levels as trade-management checkpoints, not automatic exit commands. Set the plan before the trade develops.
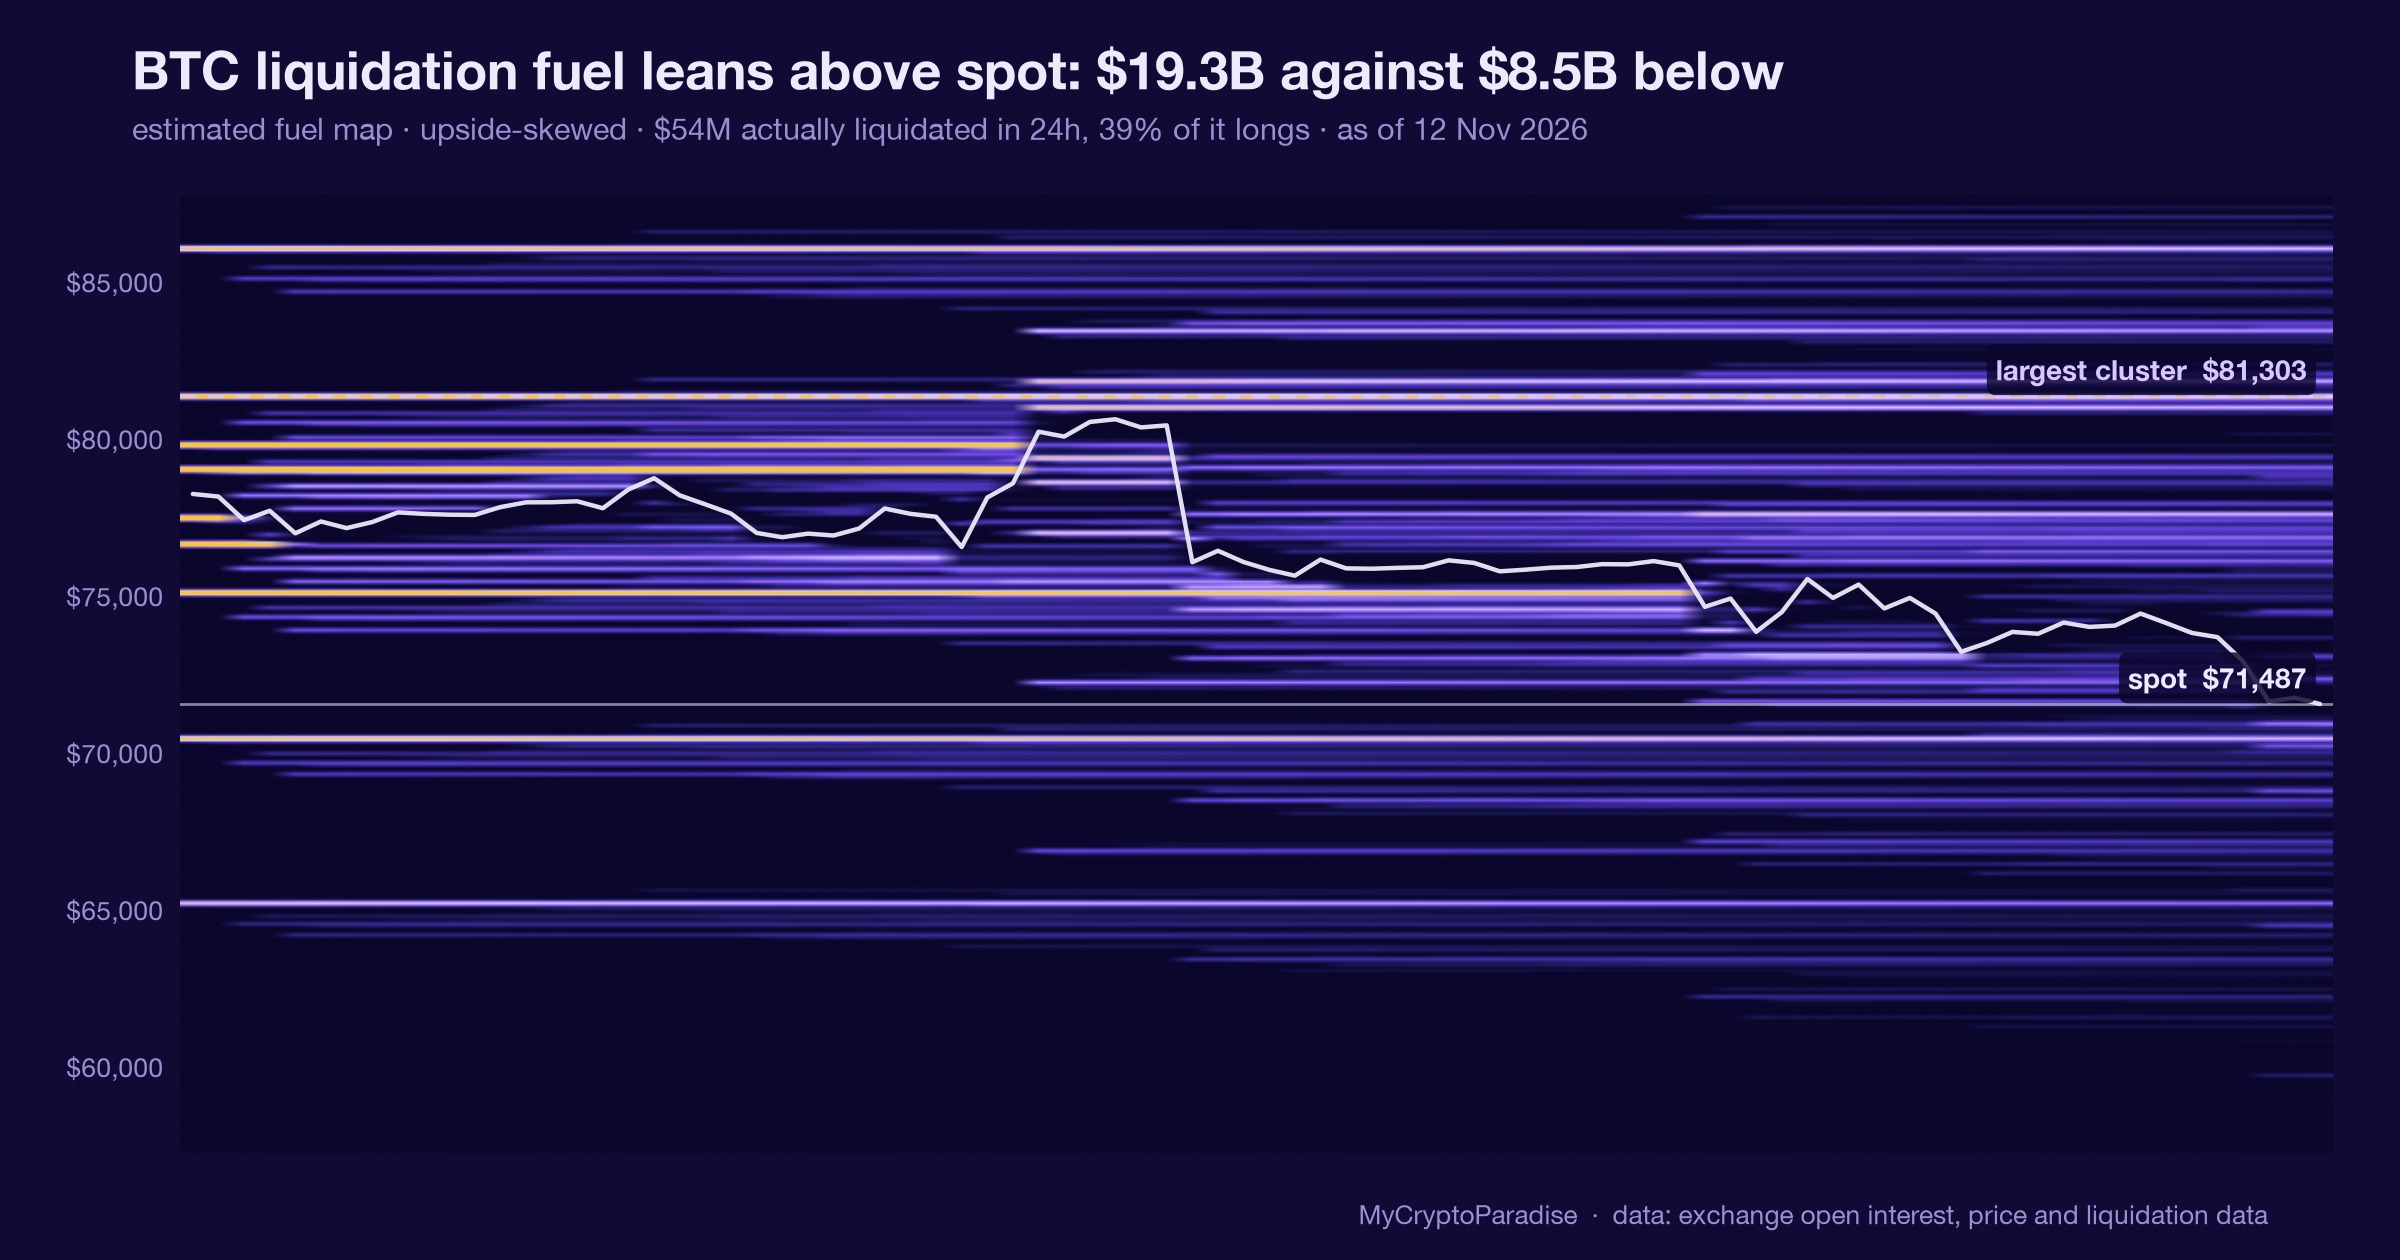
A projected target becomes more useful when it overlaps an independent reference. Examples include a prior swing high, a support zone, or a clear liquidity cluster on a heatmap.
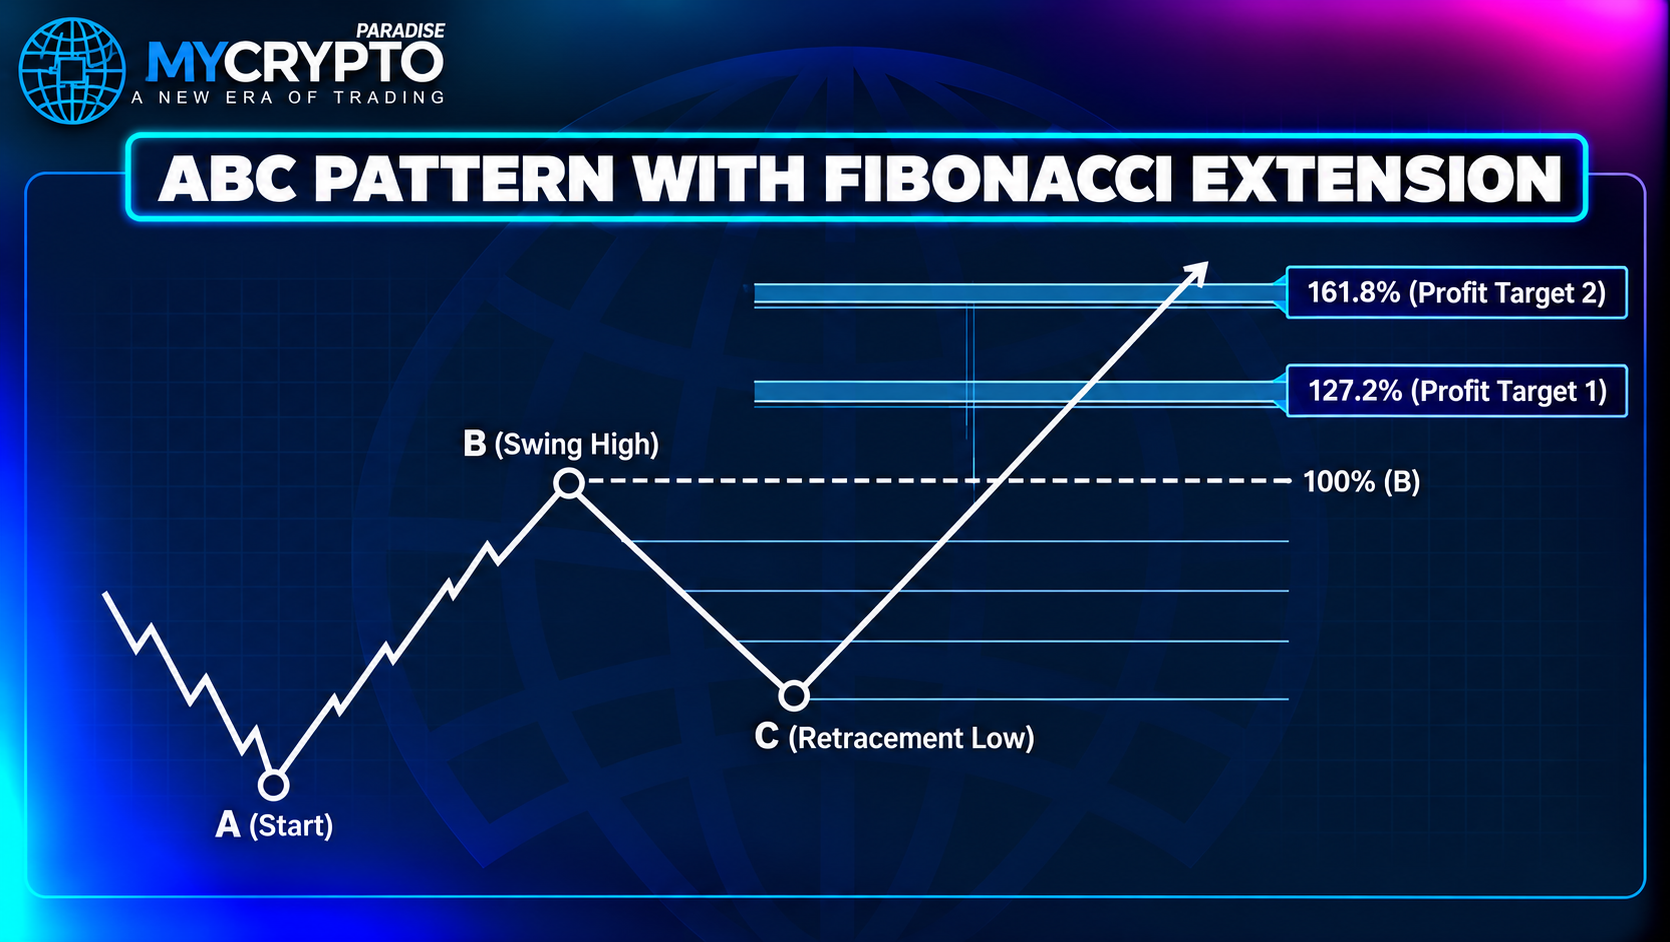
This overlap is confluence, not confirmation by itself. Volume and candle behaviour add context as price nears a target.
A rejection wick or a bullish engulfing signal may suggest the area matters. No single candle guarantees a reversal.
A target can also be missed. Price may turn early, consolidate, or accelerate through the level. Account for fees, slippage, and partial fills.
Extensions in Elliott Wave
Elliott Wave analysis compares the size of motive and corrective waves. Extensions help frame objectives, but they do not determine a wave count alone.
Wave 3 is often discussed as a potentially extended motive wave. Traders may compare its length with wave 1 using ratios such as 1.618.
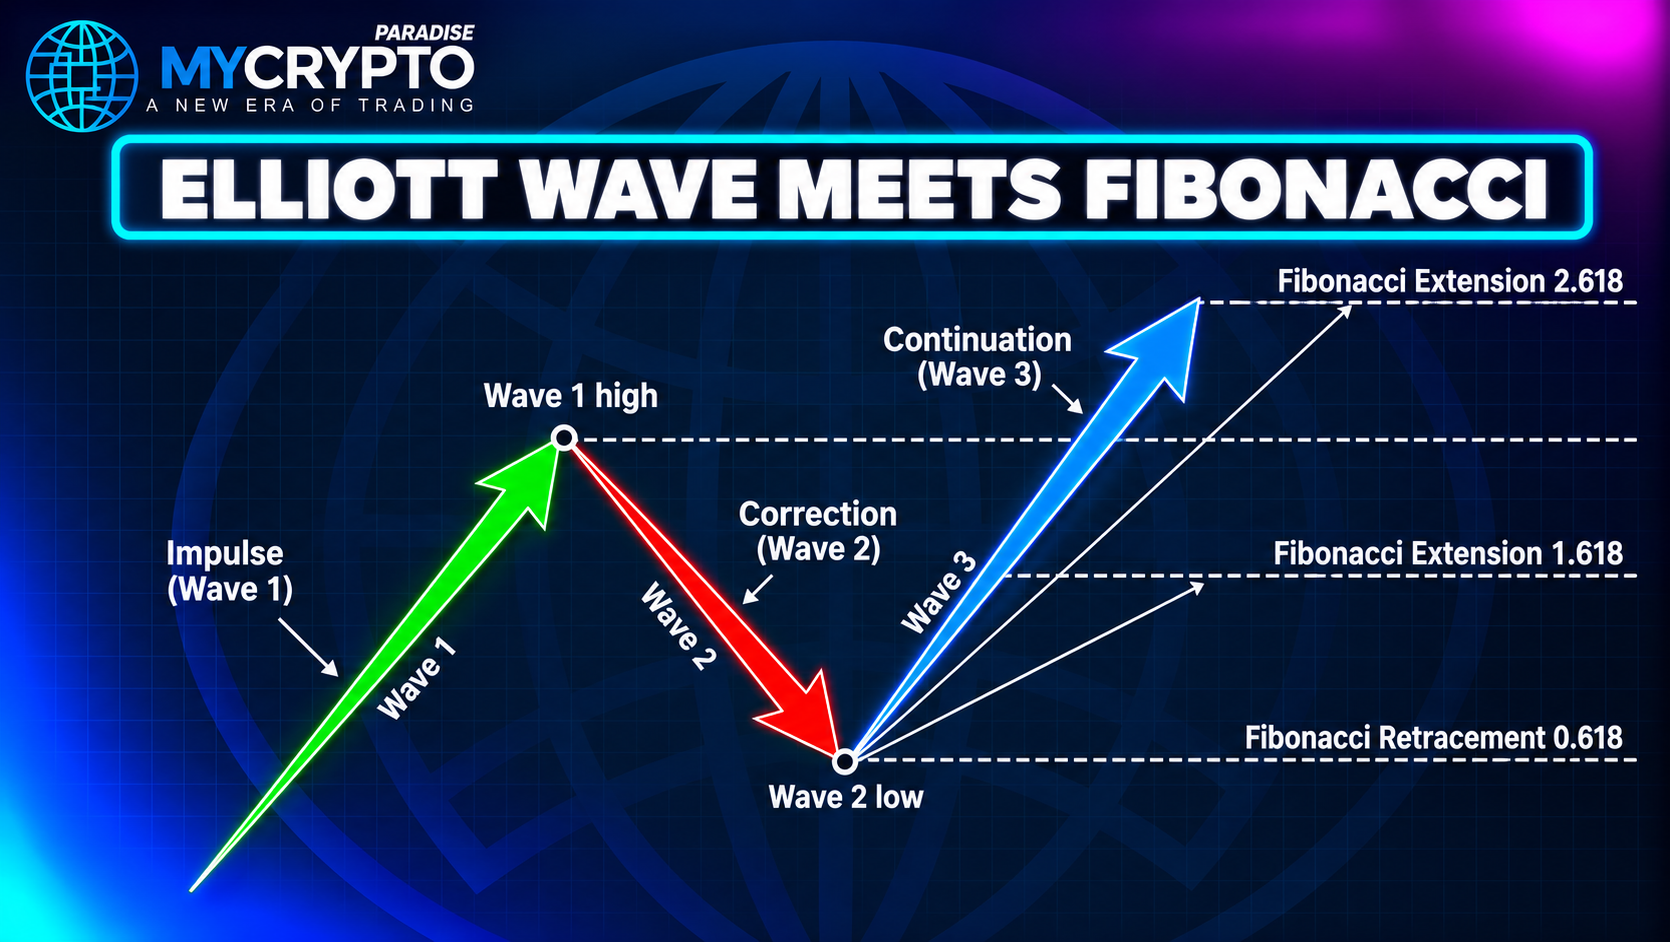
Wave 5 can be measured relative to wave 1 or to earlier waves. If momentum weakens, a target based on the original count may stop being relevant.
In a zigzag correction, wave C is commonly compared with wave A. A projection where C equals A is the 1.0 relationship.
Extensions in harmonic patterns
Harmonic patterns compare multiple swings through defined Fibonacci relationships. An extension may help assess a completion zone, often alongside retracement measurements.
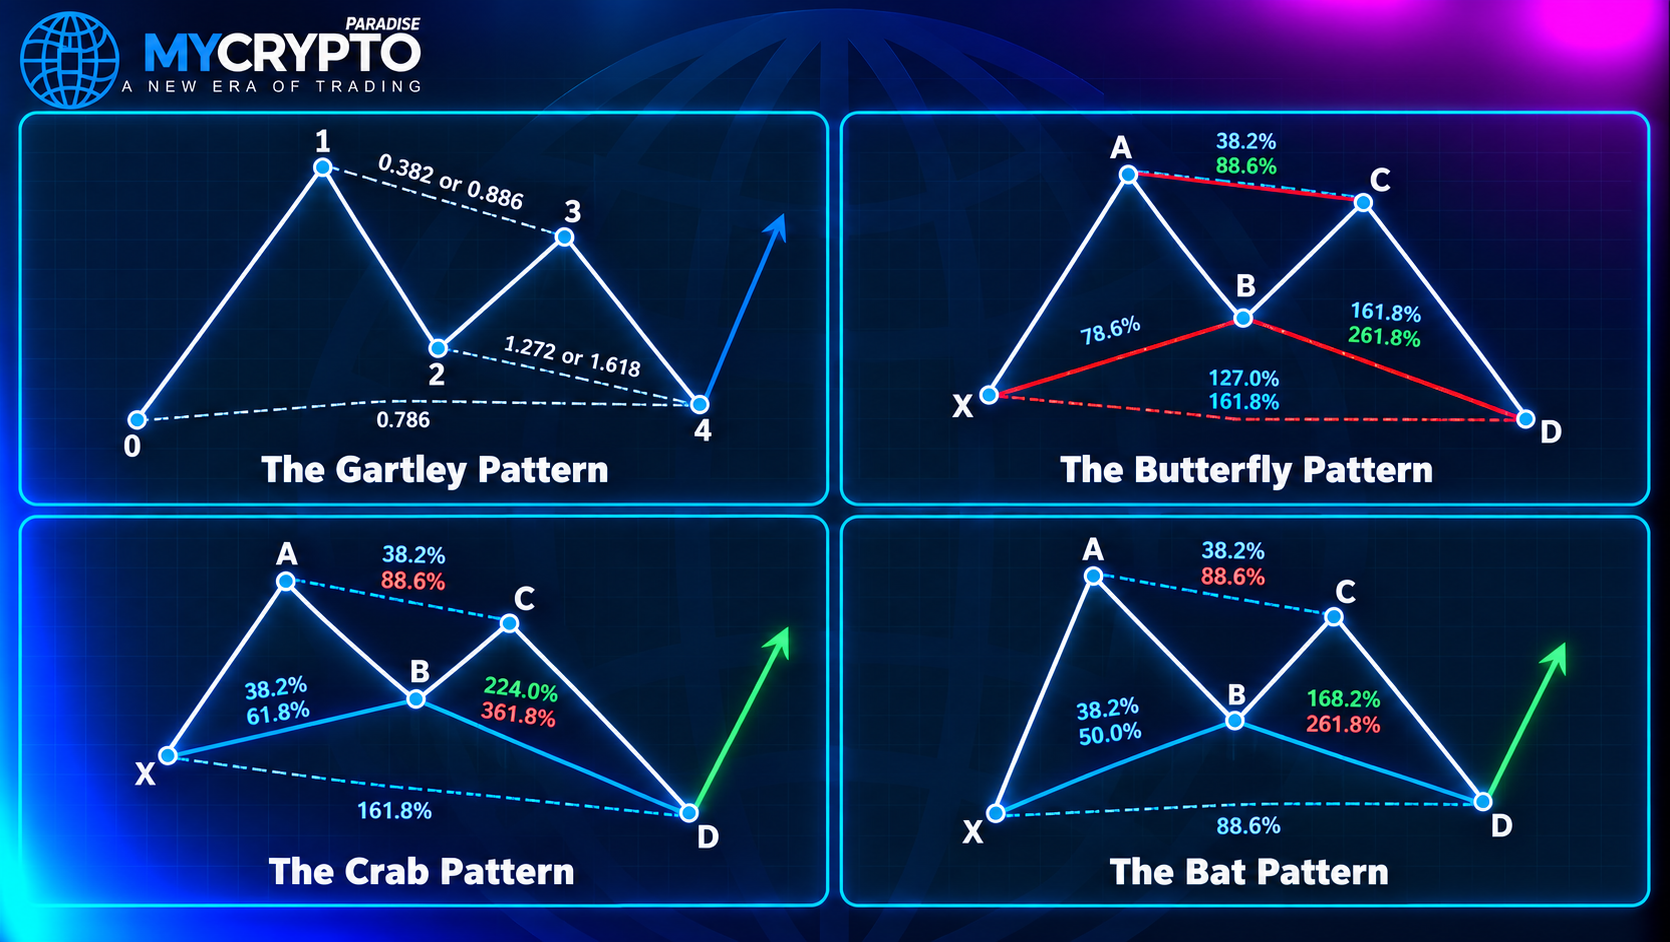
In a Gartley or similar structure, the potential reversal zone is built from several measurements, not one isolated ratio. Validate the complete pattern before acting.
Confirmation still depends on price behaviour. A piercing line reversal near the zone can add evidence, but it never replaces the full pattern.
When extensions fail
Extensions become less useful when the anchors are unclear. In a choppy range, several possible A, B and C points produce conflicting projections.
Parabolic moves can overshoot several levels with little pause. Strong momentum may carry price far beyond a planned target.
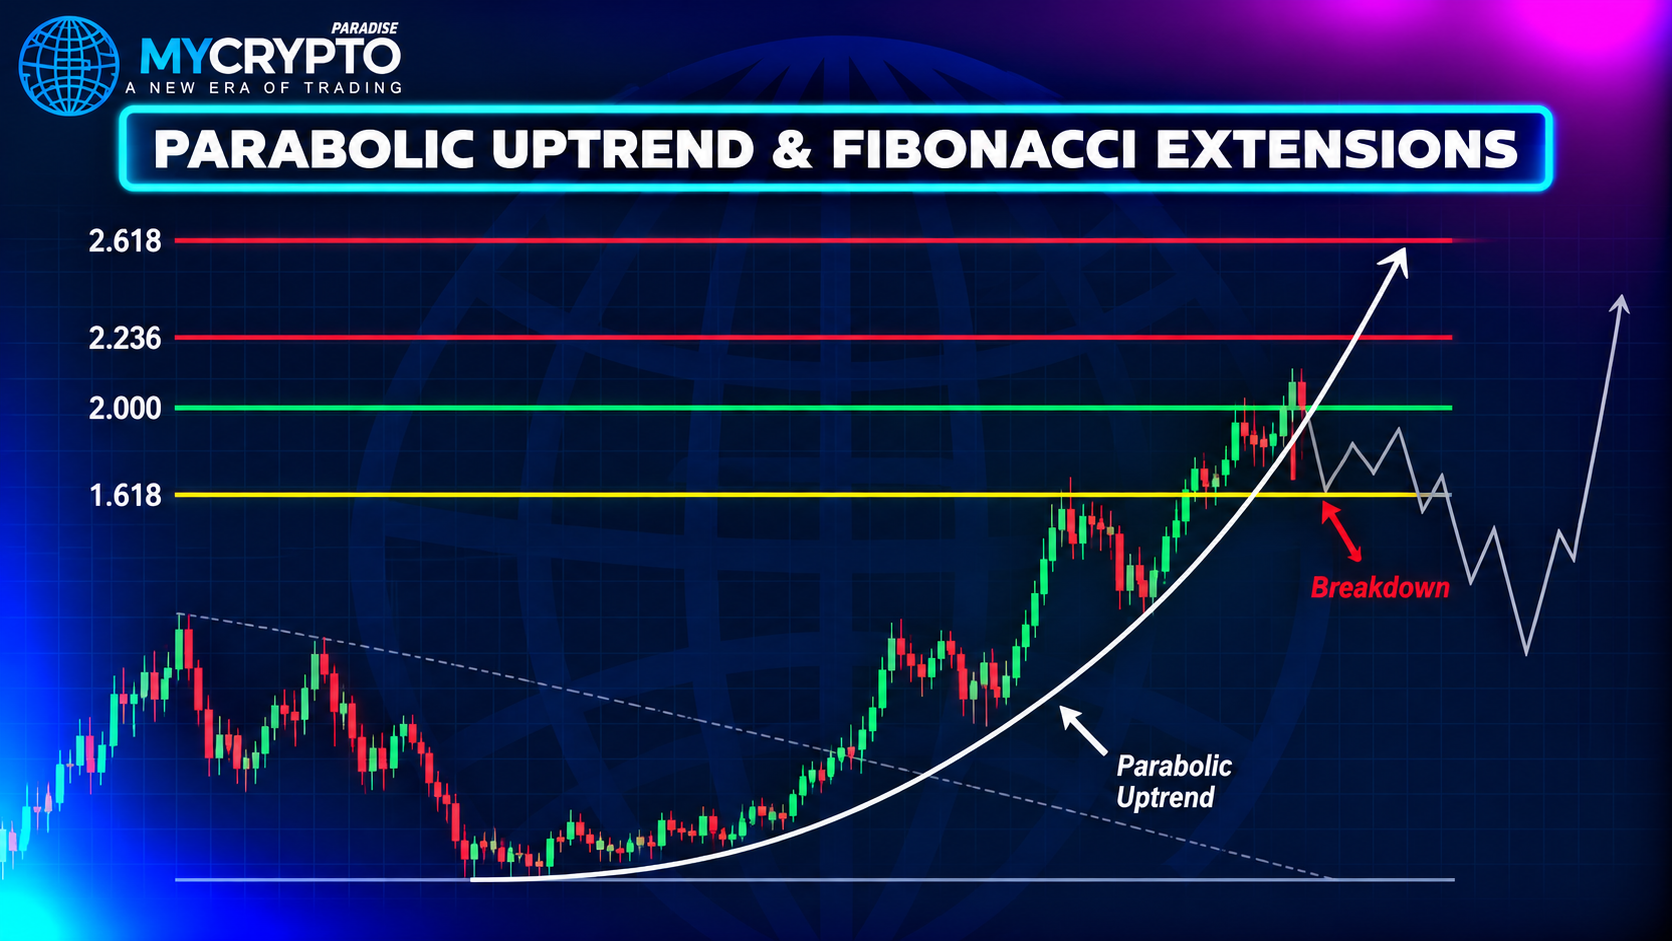
Thin liquidity produces sharp wicks and fast moves through projected zones. Orders may fill at worse prices than expected during volatile periods.
News events and liquidations can distort a swing. Checking crypto funding rates and the fear and greed index helps you read the regime before trusting a projection.
Common mistakes
- Choosing the wrong impulse. If A and B miss the meaningful move, every target is distorted.
- Marking point C too early. A correction may continue after the first pause, so wait for a real swing point.
- Treating 1.618 as a promise. The ratio is widely watched, but it guarantees nothing.
- Crowding the chart with levels. Too many ratios encourage selective interpretation.
- Ignoring confluence. An extension alone is weak context without structure and price behaviour.
- Moving anchors after the outcome. Record the original anchors and review them honestly.
- Confusing targets with entry signals. A projected target does not justify an entry on its own.
Practice this
Open a daily chart and find one clean impulse that changed structure. Mark A, B and C, then plot the trend-based extension.
Write down your invalidation price, your position size, and the reward you expect against the risk. Do this before any entry.
Estimate the distance from entry to invalidation and from entry to target, including fees and plausible slippage. If the balance is poor, skipping the trade is valid.
This content is education, not financial advice. Crypto markets are volatile, and every projected level can fail.
FAQs
What are Fibonacci extension levels?
They are projected price levels beyond a measured swing. Traders use them to plan potential targets and reassessment areas if a move continues. A level is a reference, not a prediction.
What is the difference between retracement and extension?
Retracement measures how much of a prior move price gives back. Extension projects possible destinations beyond the swing if price resumes its original direction.
Does price have to reach 1.618?
No. It is a reference level, not a prediction. Price may stop short, pass through it, or reverse somewhere else entirely.
How are extensions used in Elliott Wave?
Traders compare projected wave lengths, such as wave 3 against wave 1, or wave C against wave A. The ratio does not validate a wave count by itself.
Are Fibonacci extensions financial advice?
No. This content is education only. Crypto markets involve substantial risk, and every projected level can fail. Always define your risk before trading.
Risk disclaimer: Crypto trading involves substantial risk of loss. This class is education only, not financial advice. Never trade with money you cannot afford to lose. Past results do not guarantee future results.








Join the discussion
No comments yet. Members, share how you are reading this.