



In short: The Bearish Counterattack Pattern is a two-candle bearish reversal after an uptrend. The second candle opens higher, then closes near the first candle's close, showing sellers absorbing demand. Treat it as an early warning, and wait for confirmation before shorting.
The Bearish Counterattack Pattern is a two-candle warning that control is shifting from buyers to sellers near the top of an uptrend. Treat it as an early alert, not an instant sell signal.
It forms after a rally, when sellers quietly absorb strong buying and drag price back to the prior close. This lesson teaches why it forms, so you can separate strong setups from weak ones.
What the Bearish Counterattack Pattern is
This is a two-candle bearish reversal that usually develops after a prolonged uptrend. It suggests buying strength is fading while sellers begin to regain control.
The first candle is a strong bullish candle, so sentiment stays optimistic and most traders expect higher prices.
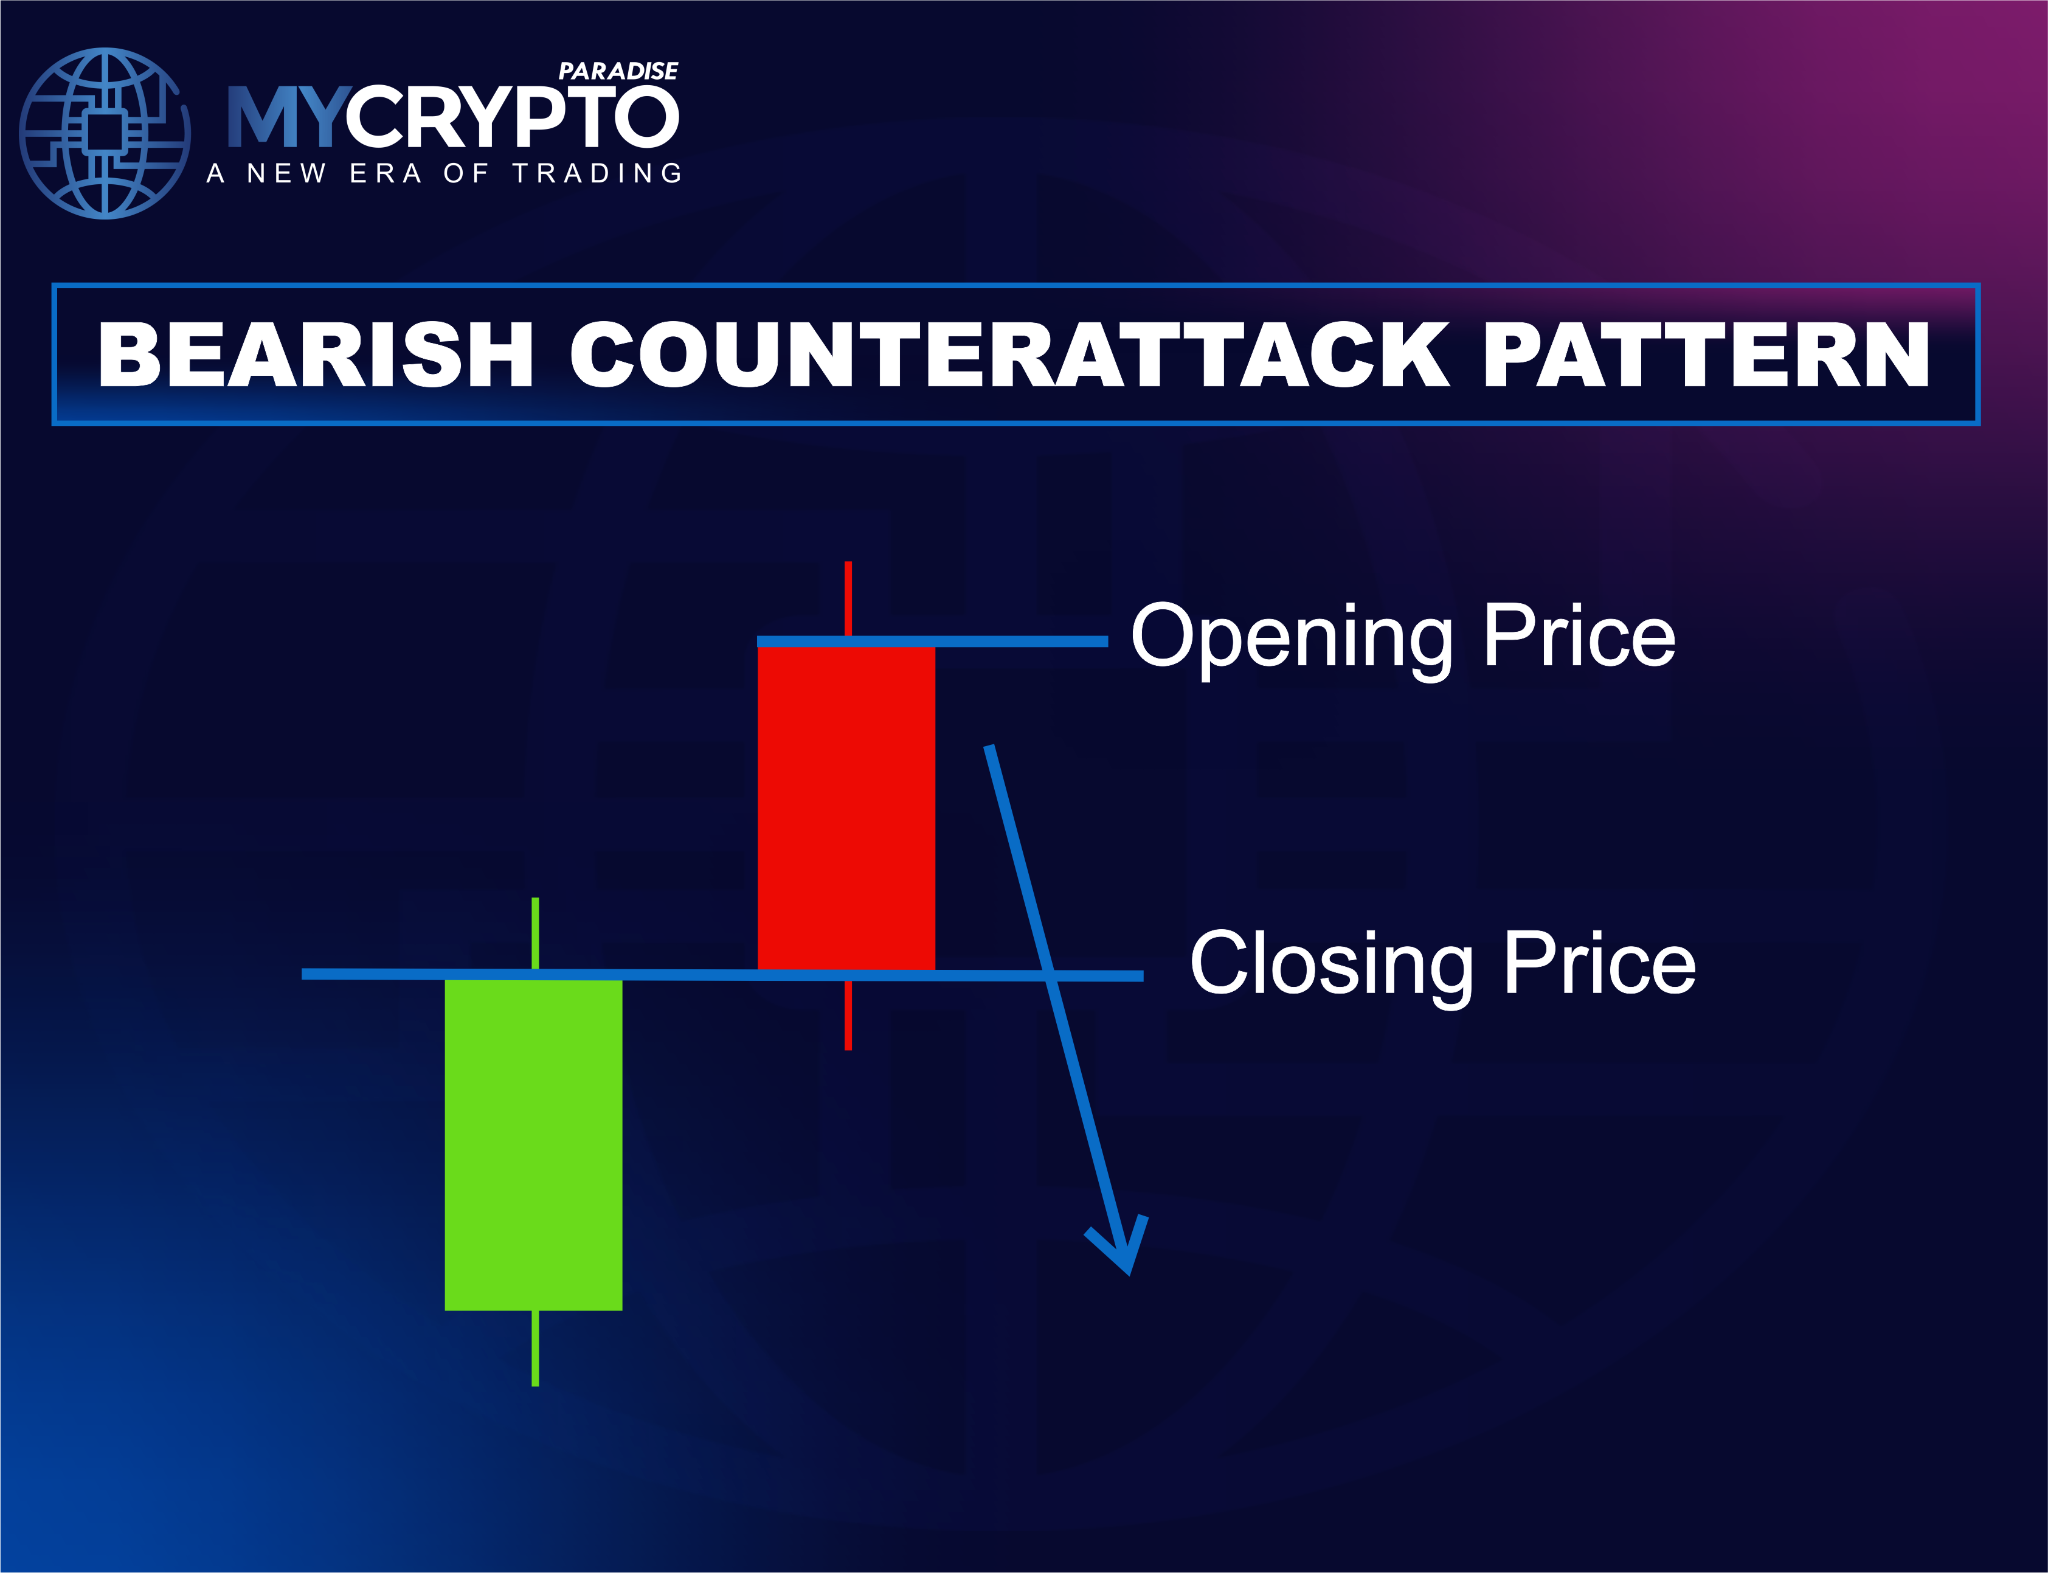
The second candle opens above the prior close, or pushes higher early, which replaces the traditional gap in the 24/7 crypto market.
Then the balance shifts. Selling pressure absorbs that early demand and pushes price back to the first candle’s close. Holding gains fails, so buyers look no longer in control.
Candlestick charting reads this shift as crowd psychology, a well documented idea in candlestick charting basics. The signal matters most near major resistance or after a liquidity sweep.
Key characteristics
A strong uptrend is essential
The pattern only carries weight after a clear uptrend of higher highs and higher lows. Without that momentum, sellers have no dominant trend to reverse.
Matching closes signal weakness
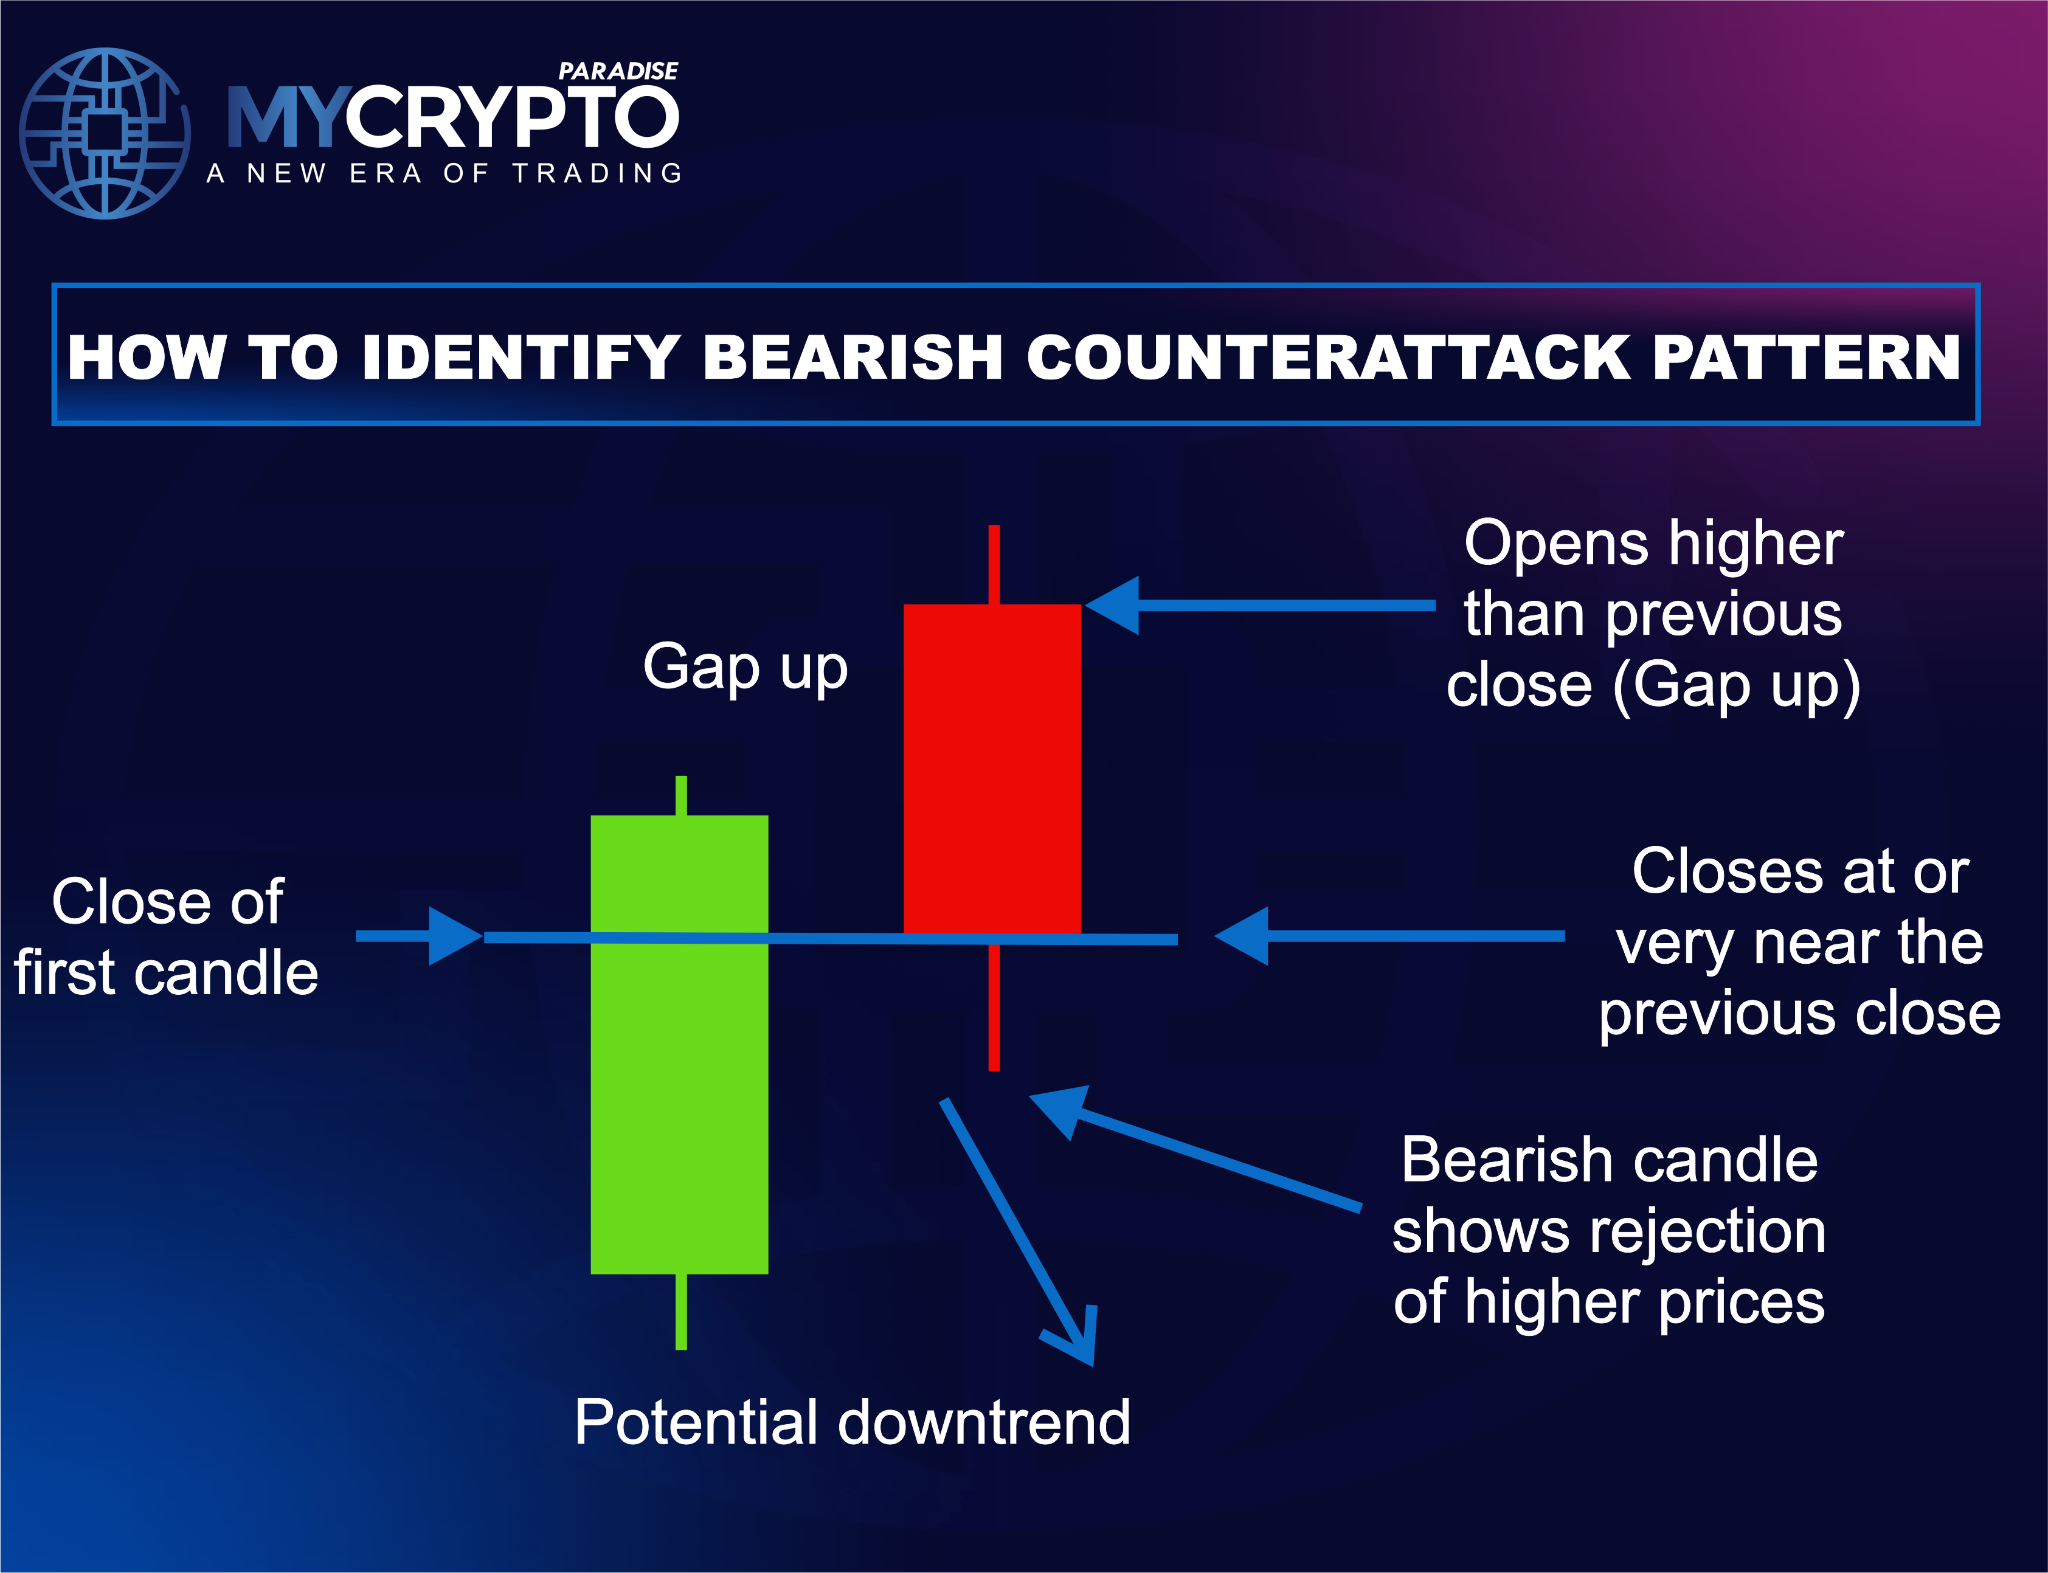
The defining feature is the near identical close of both candles. Buyers extend the move early, then fail to hold it, which shows fading strength.
Context decides reliability
The strongest setups appear near higher-timeframe resistance, supply zones, or after a buy-side liquidity sweep. Rising selling volume and bearish structure add weight. You can gauge broader mood with a crypto fear and greed read.
Why it works
The pattern is really a shift in order flow, not just two candles. After a long rally, buyers still look confident, yet their failure to hold higher prices signals weakening demand.
In crypto this often follows a sweep of liquidity above prior highs. Breakout traders go long, shorts cover, and buy-side liquidity builds fast. Larger players can then distribute into that demand.
A liquidation heatmap helps you see where that resting liquidity sits. Confirmation from bearish structure and volume separates real reversals from routine pullbacks.
How to spot it step by step
Two candles alone are not enough. Grade the market around the pattern before you act.
- Confirm the uptrend: look for steady higher highs and higher lows above key support.
- Find major resistance: historical resistance, supply zones, higher-timeframe order blocks, or Fibonacci levels.
- Read both candles: a strong first candle, then a second that opens higher and closes near the first close.
- Check volume: a reversal on rising volume shows real selling, not routine profit taking.
- Wait for confirmation: a close below the pattern low, a failed retest, or a break of structure.
Market structure is the anchor here. Tools like Elliott Wave analysis can frame where the trend sits before you trust the reversal.
How to trade it
Entry
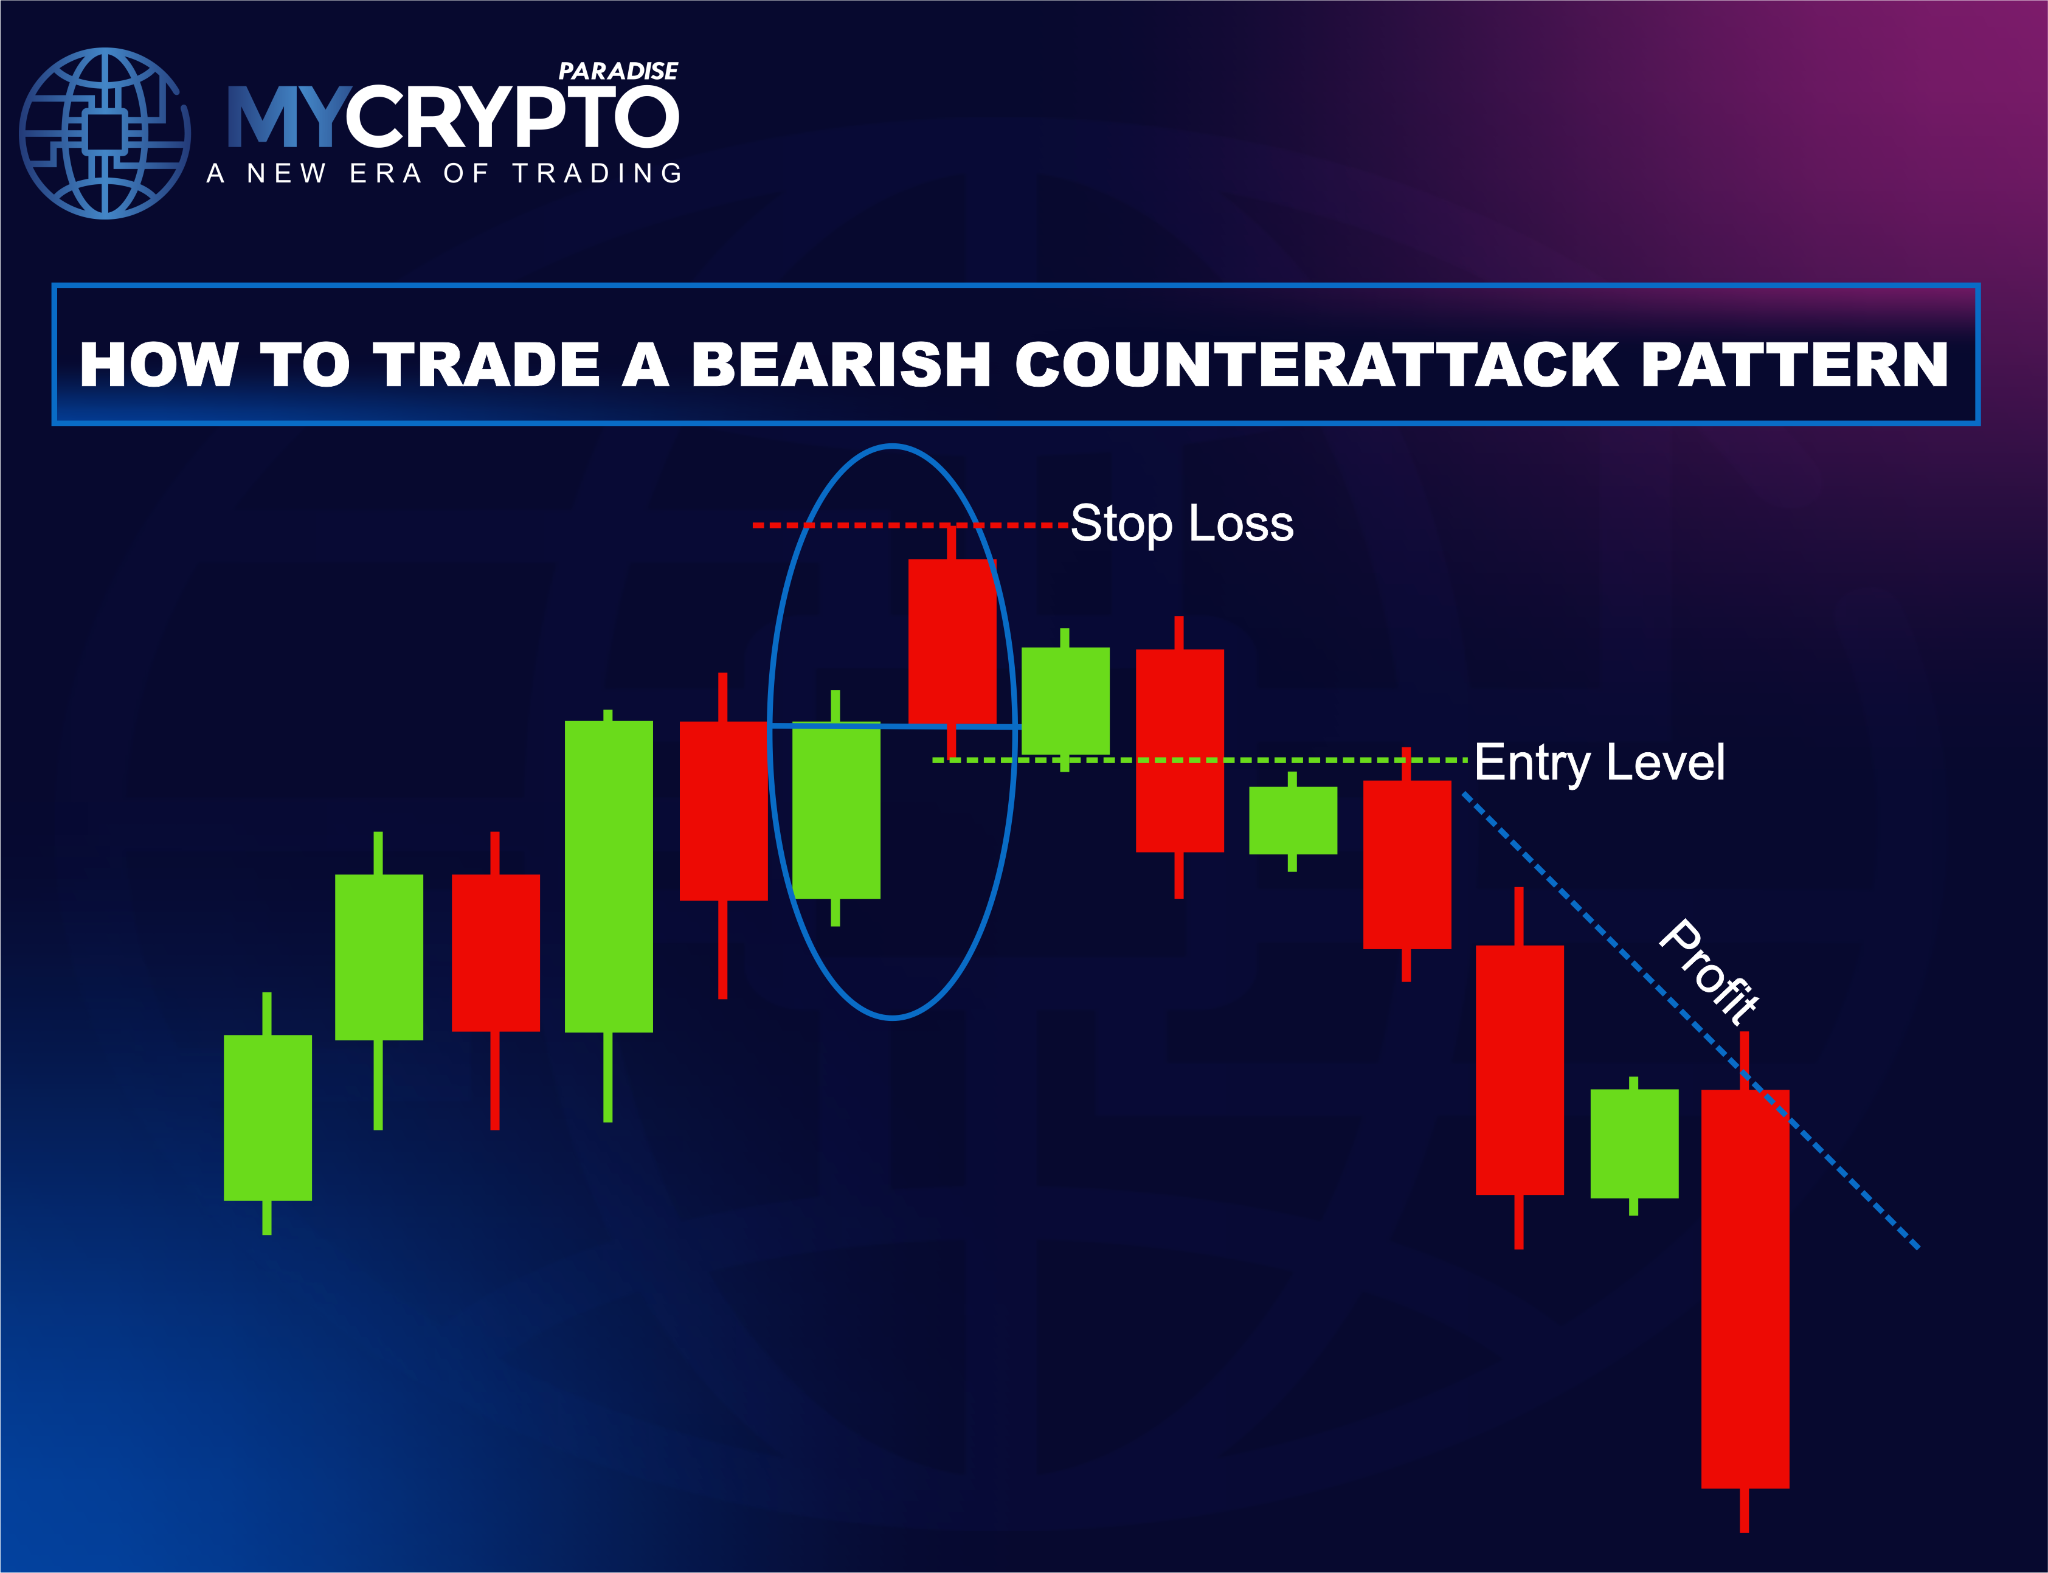
The safest entry comes after price confirms sellers are in control. Most traders wait for a break below the pattern low before shorting.
A conservative version waits for that break, then a pullback or retest. An aggressive version enters on the second candle close when confluence is strong.
Stop-loss
The common stop sits above the highest point of the pattern. That defines the level where the bearish idea is simply wrong.
Profit targets
Professional traders target logical price areas, not arbitrary percentages. Think prior swing lows, major support, resting liquidity below recent lows, or Fibonacci extensions.
Many take partial profit at the first support, then trail the rest to ride a larger move. This locks in gains while keeping room to run.
How reliable is it
This is a moderate reliability reversal signal, and context does the heavy lifting. It works best after a sustained rally where momentum is clearly fading.
Reliability rises near higher-timeframe resistance, after a clean liquidity sweep, on rising volume, and when structure starts printing lower highs. Reading funding rates can add another layer of confirmation.
Common mistakes
- No clear uptrend: the pattern needs bullish momentum to reverse, so sideways or downtrends weaken it.
- Entering before confirmation: shorting the second candle close alone invites false signals.
- Ignoring structure: a textbook pattern can fail while price still prints higher highs.
- Overlooking volume: weak volume often means profit taking, not committed selling.
- Forgetting liquidity: markets seek liquidity, and skipping that context misreads many reversals.
- Poor risk management: even strong setups fail, so protecting capital always comes first.
How it differs from similar patterns
Several bearish reversals look alike, yet each shows a different balance between buyers and sellers.
Versus bearish engulfing
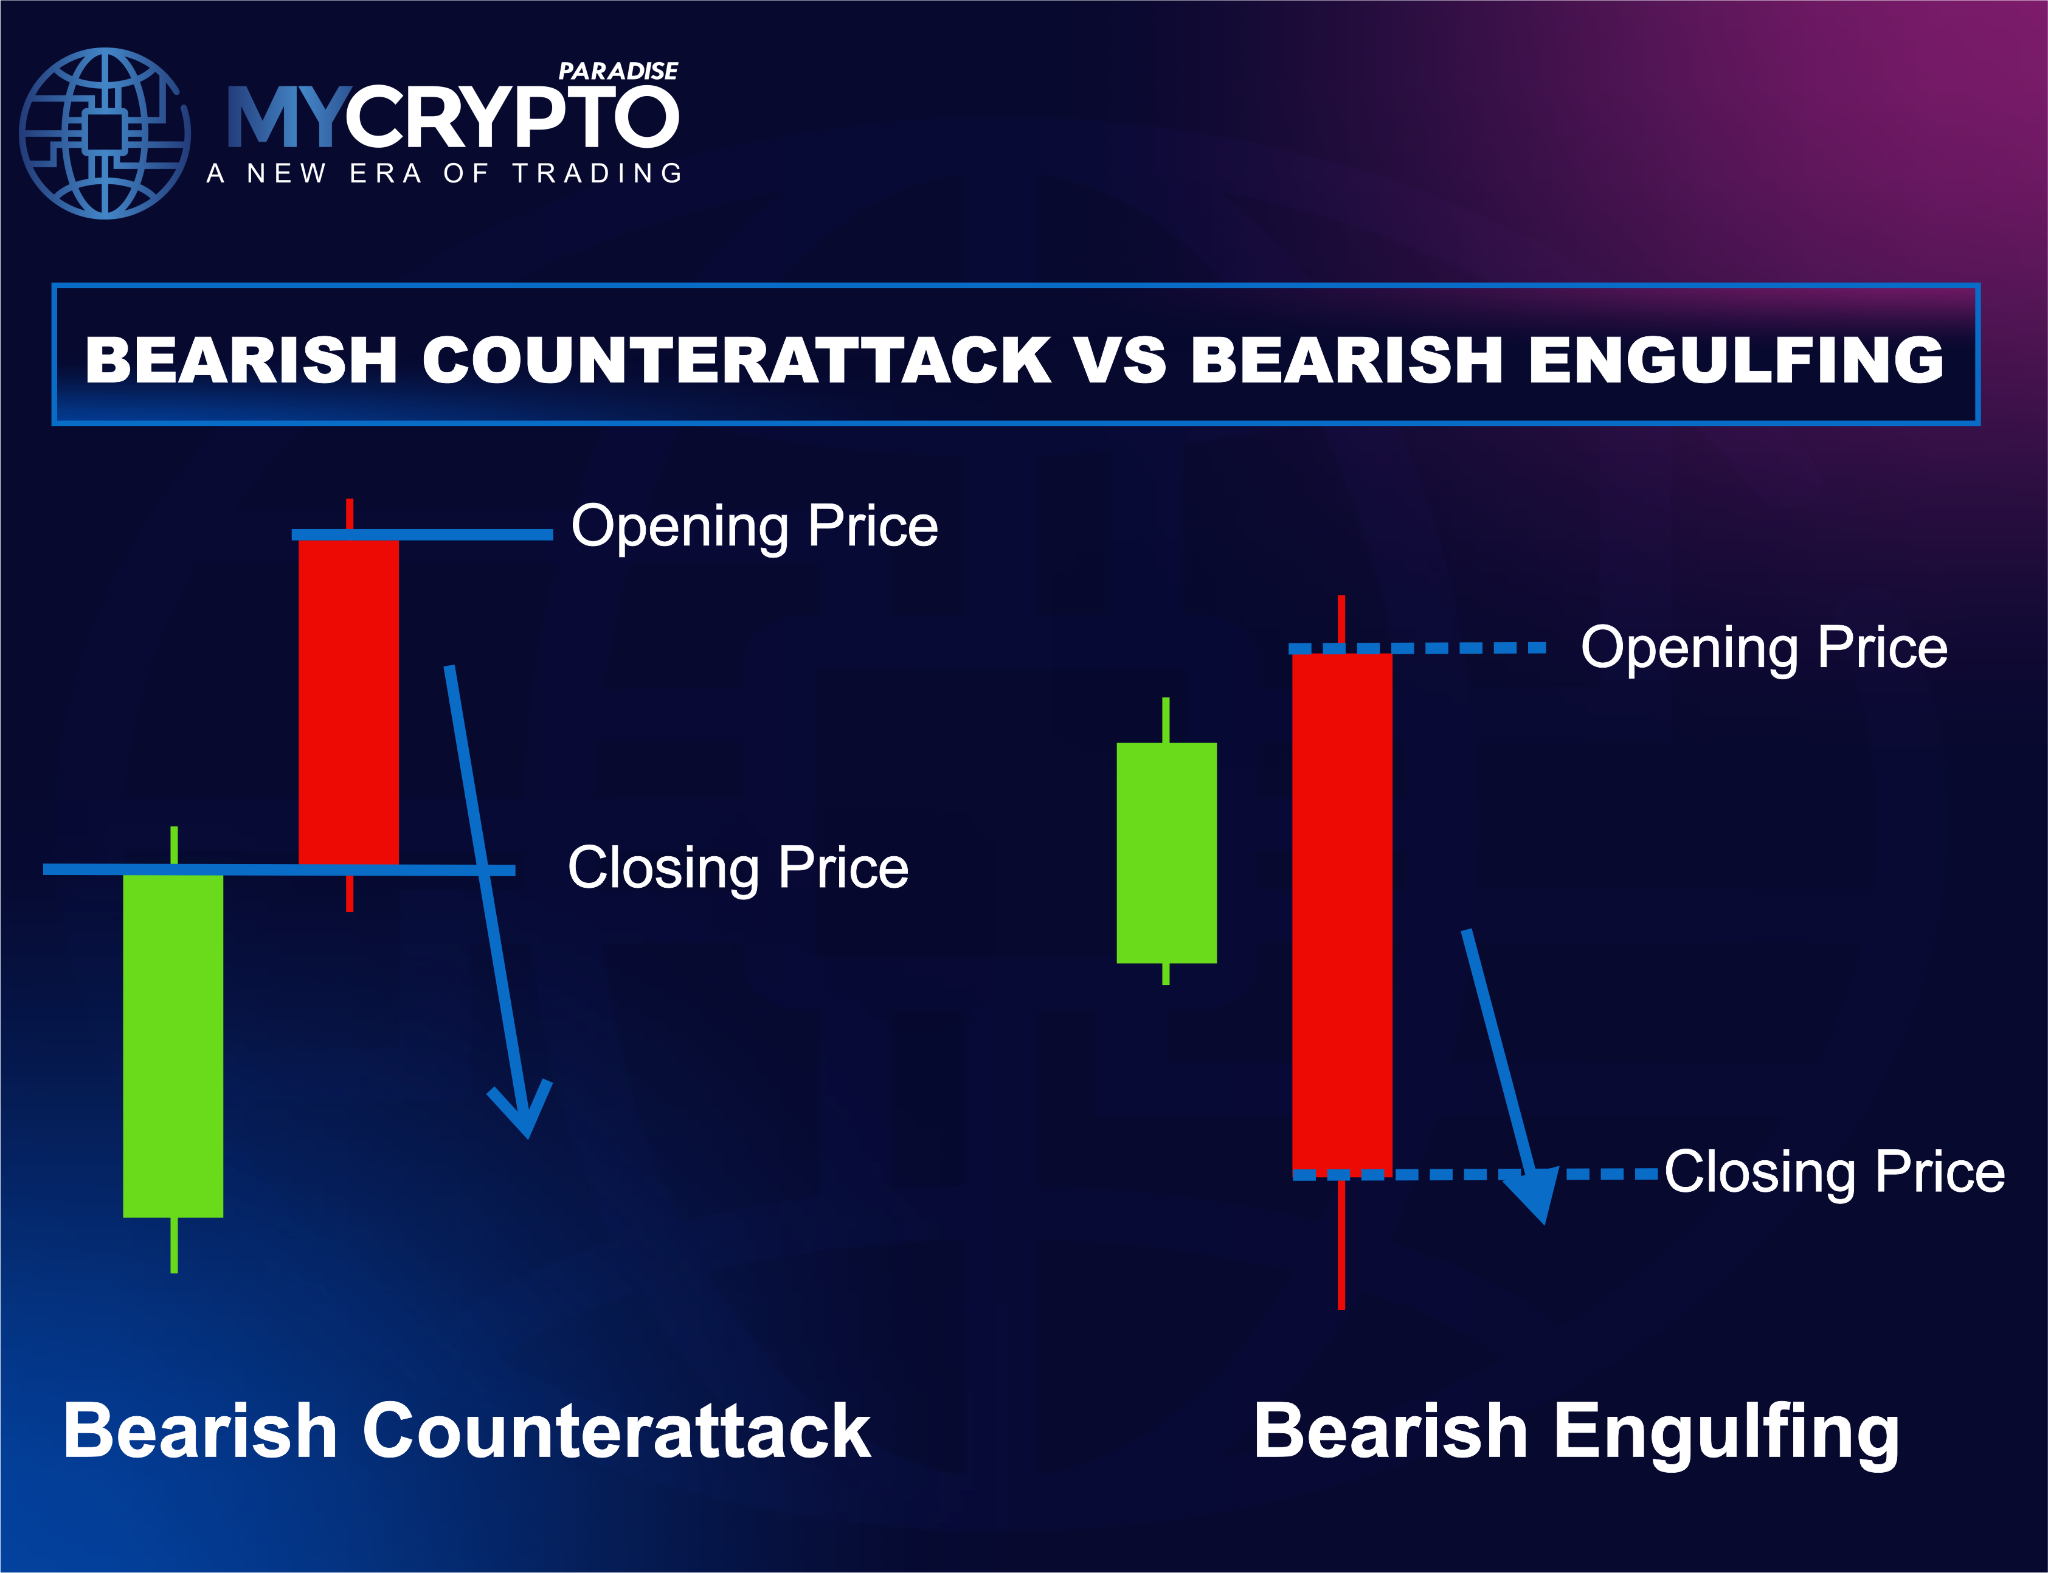
A bearish engulfing candle fully swallows the prior bullish body, showing decisive control. This is the opposite of the bullish engulfing pattern. The counterattack only matches the close, so sellers erase the rally without overpowering buyers.
Versus dark cloud cover
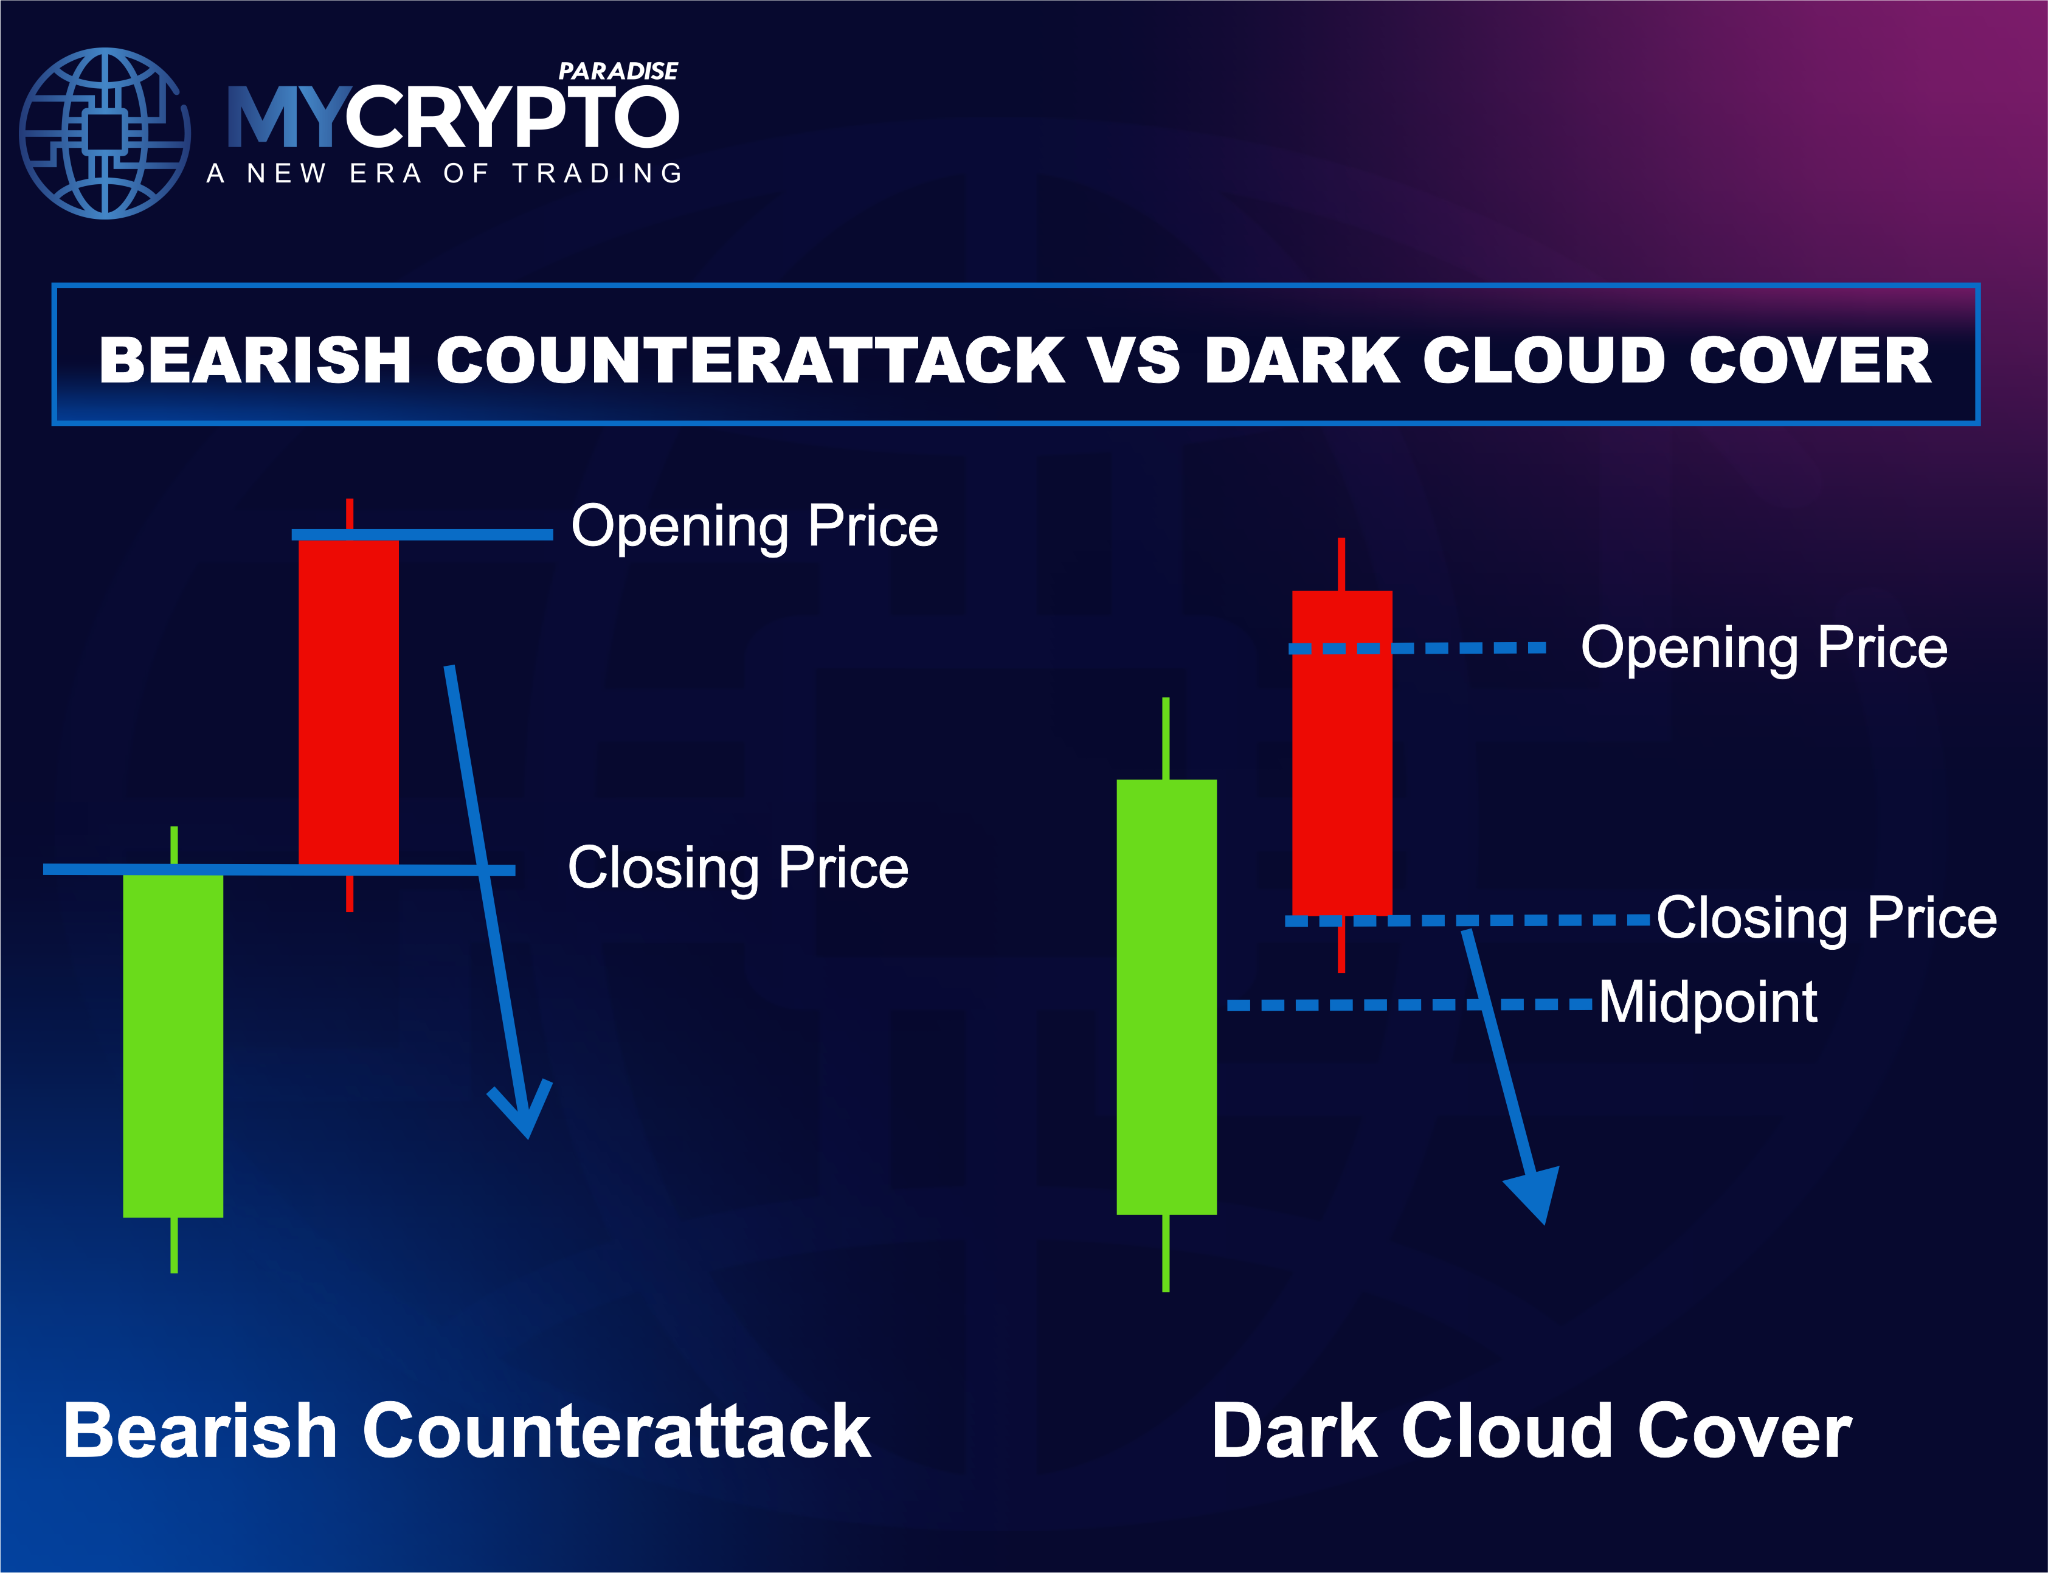
Dark Cloud Cover closes below the midpoint of the prior candle, but not always near its close. The counterattack is defined by a close at or very near that first close.
Versus bearish harami
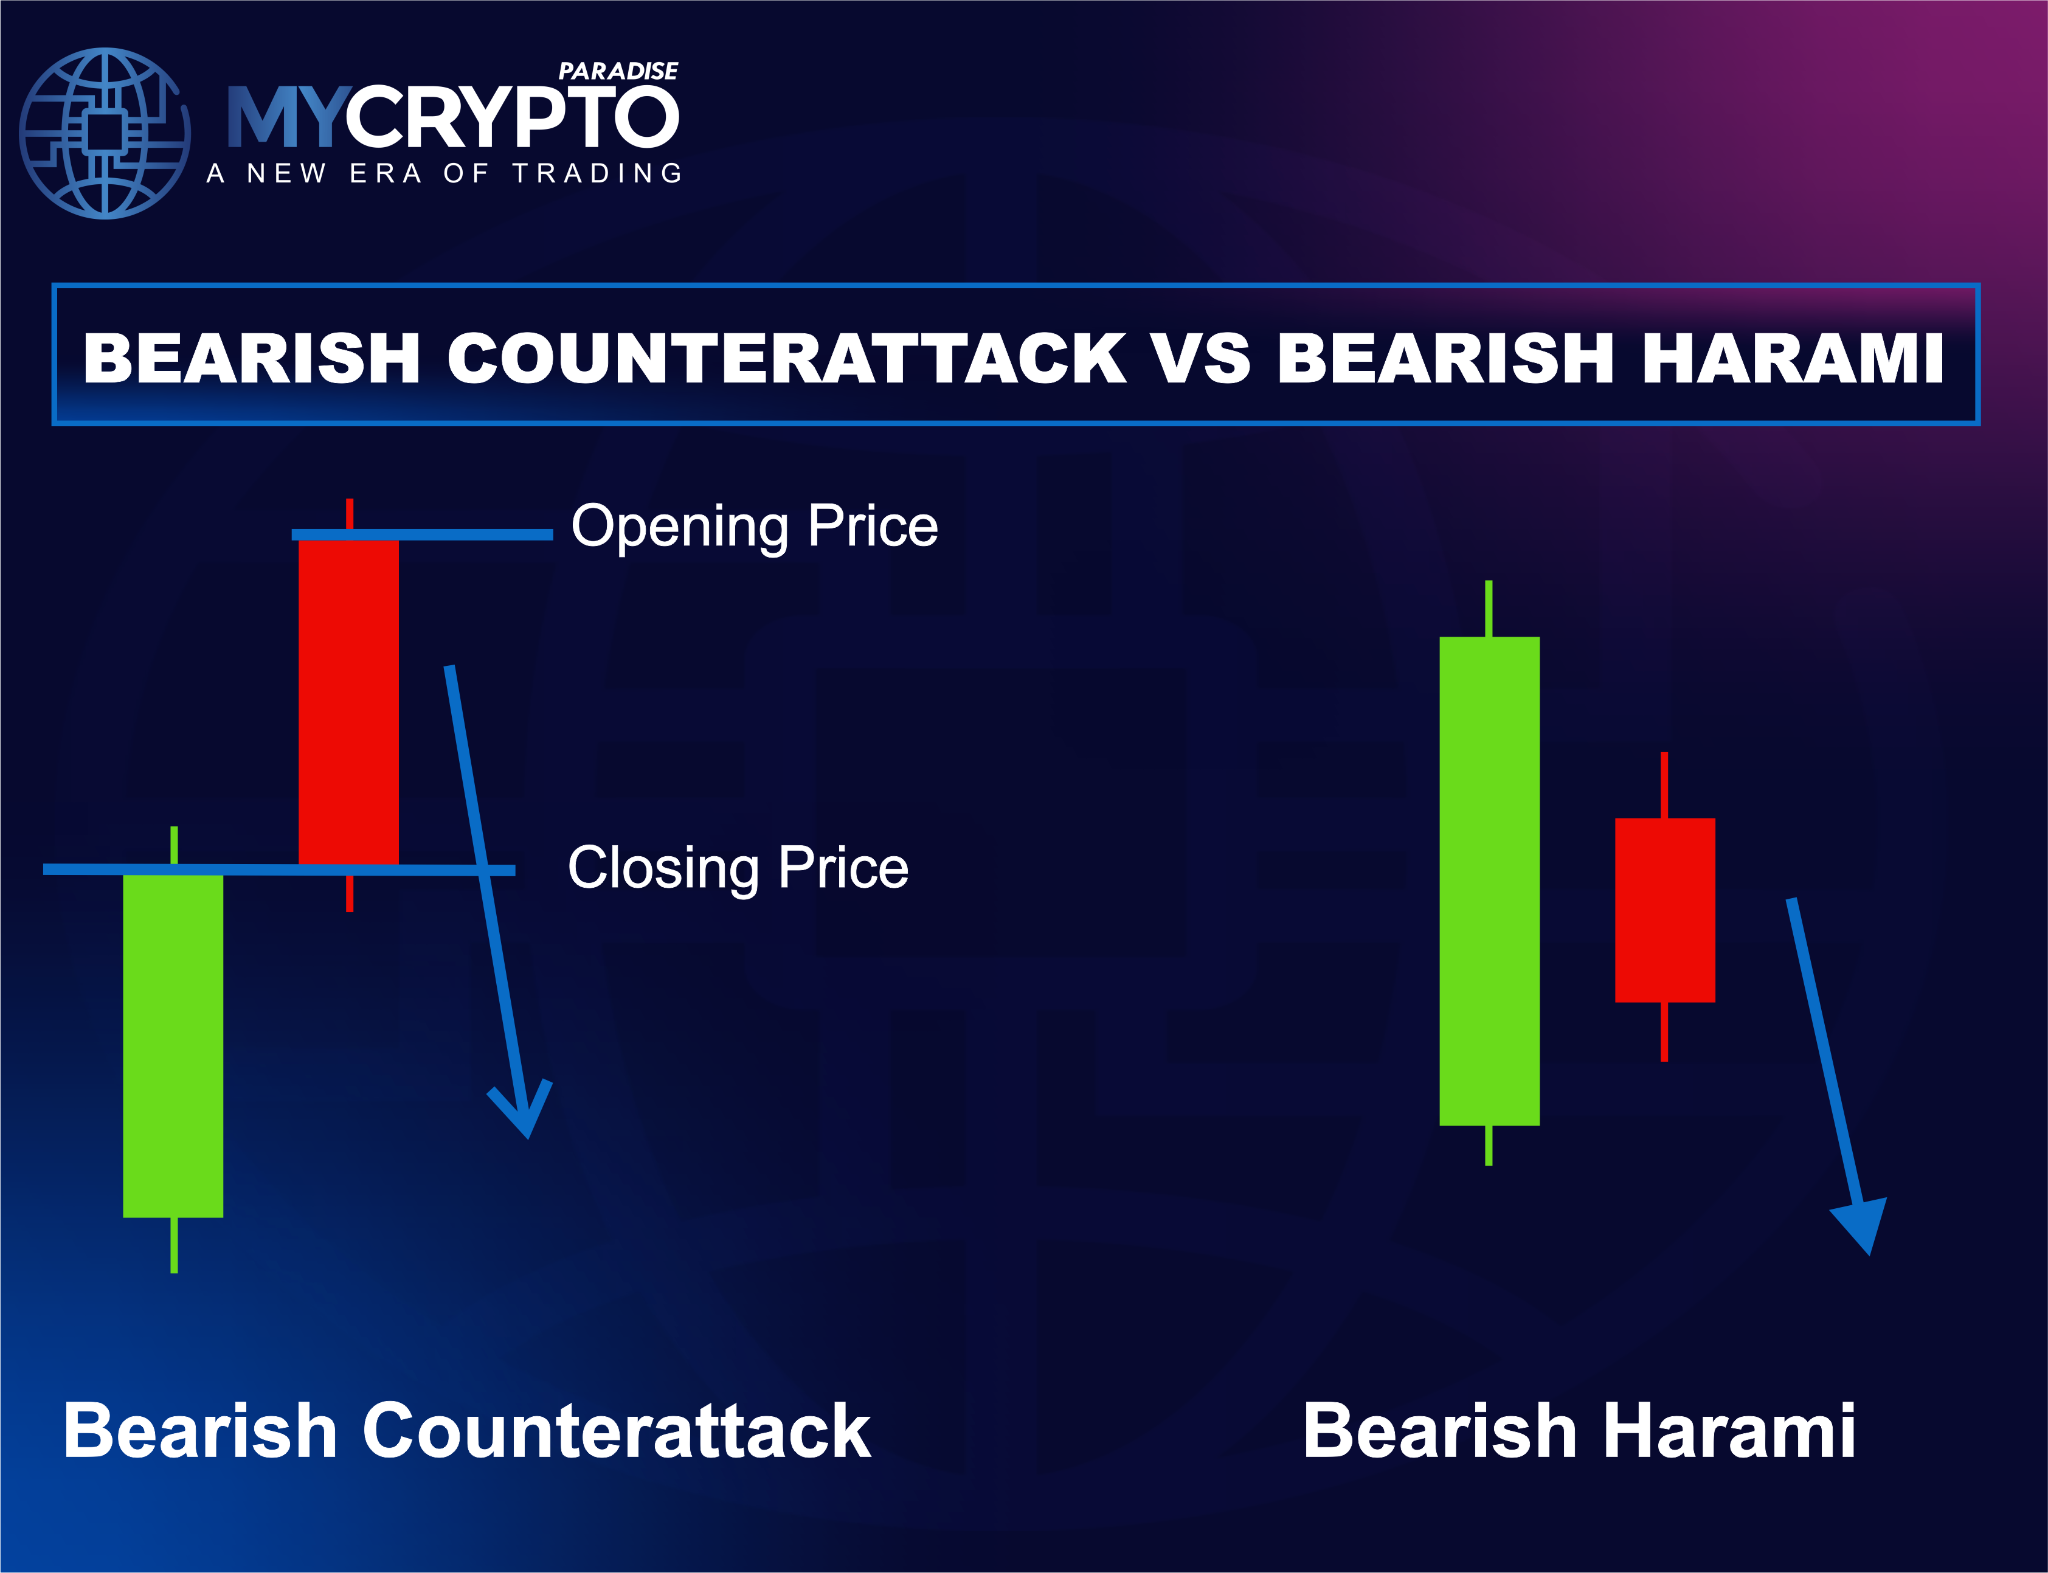
A bearish harami sits inside the prior bullish candle and hints at fading momentum. The counterattack shows a stronger seller response, closing near the previous close.
Versus tweezer top
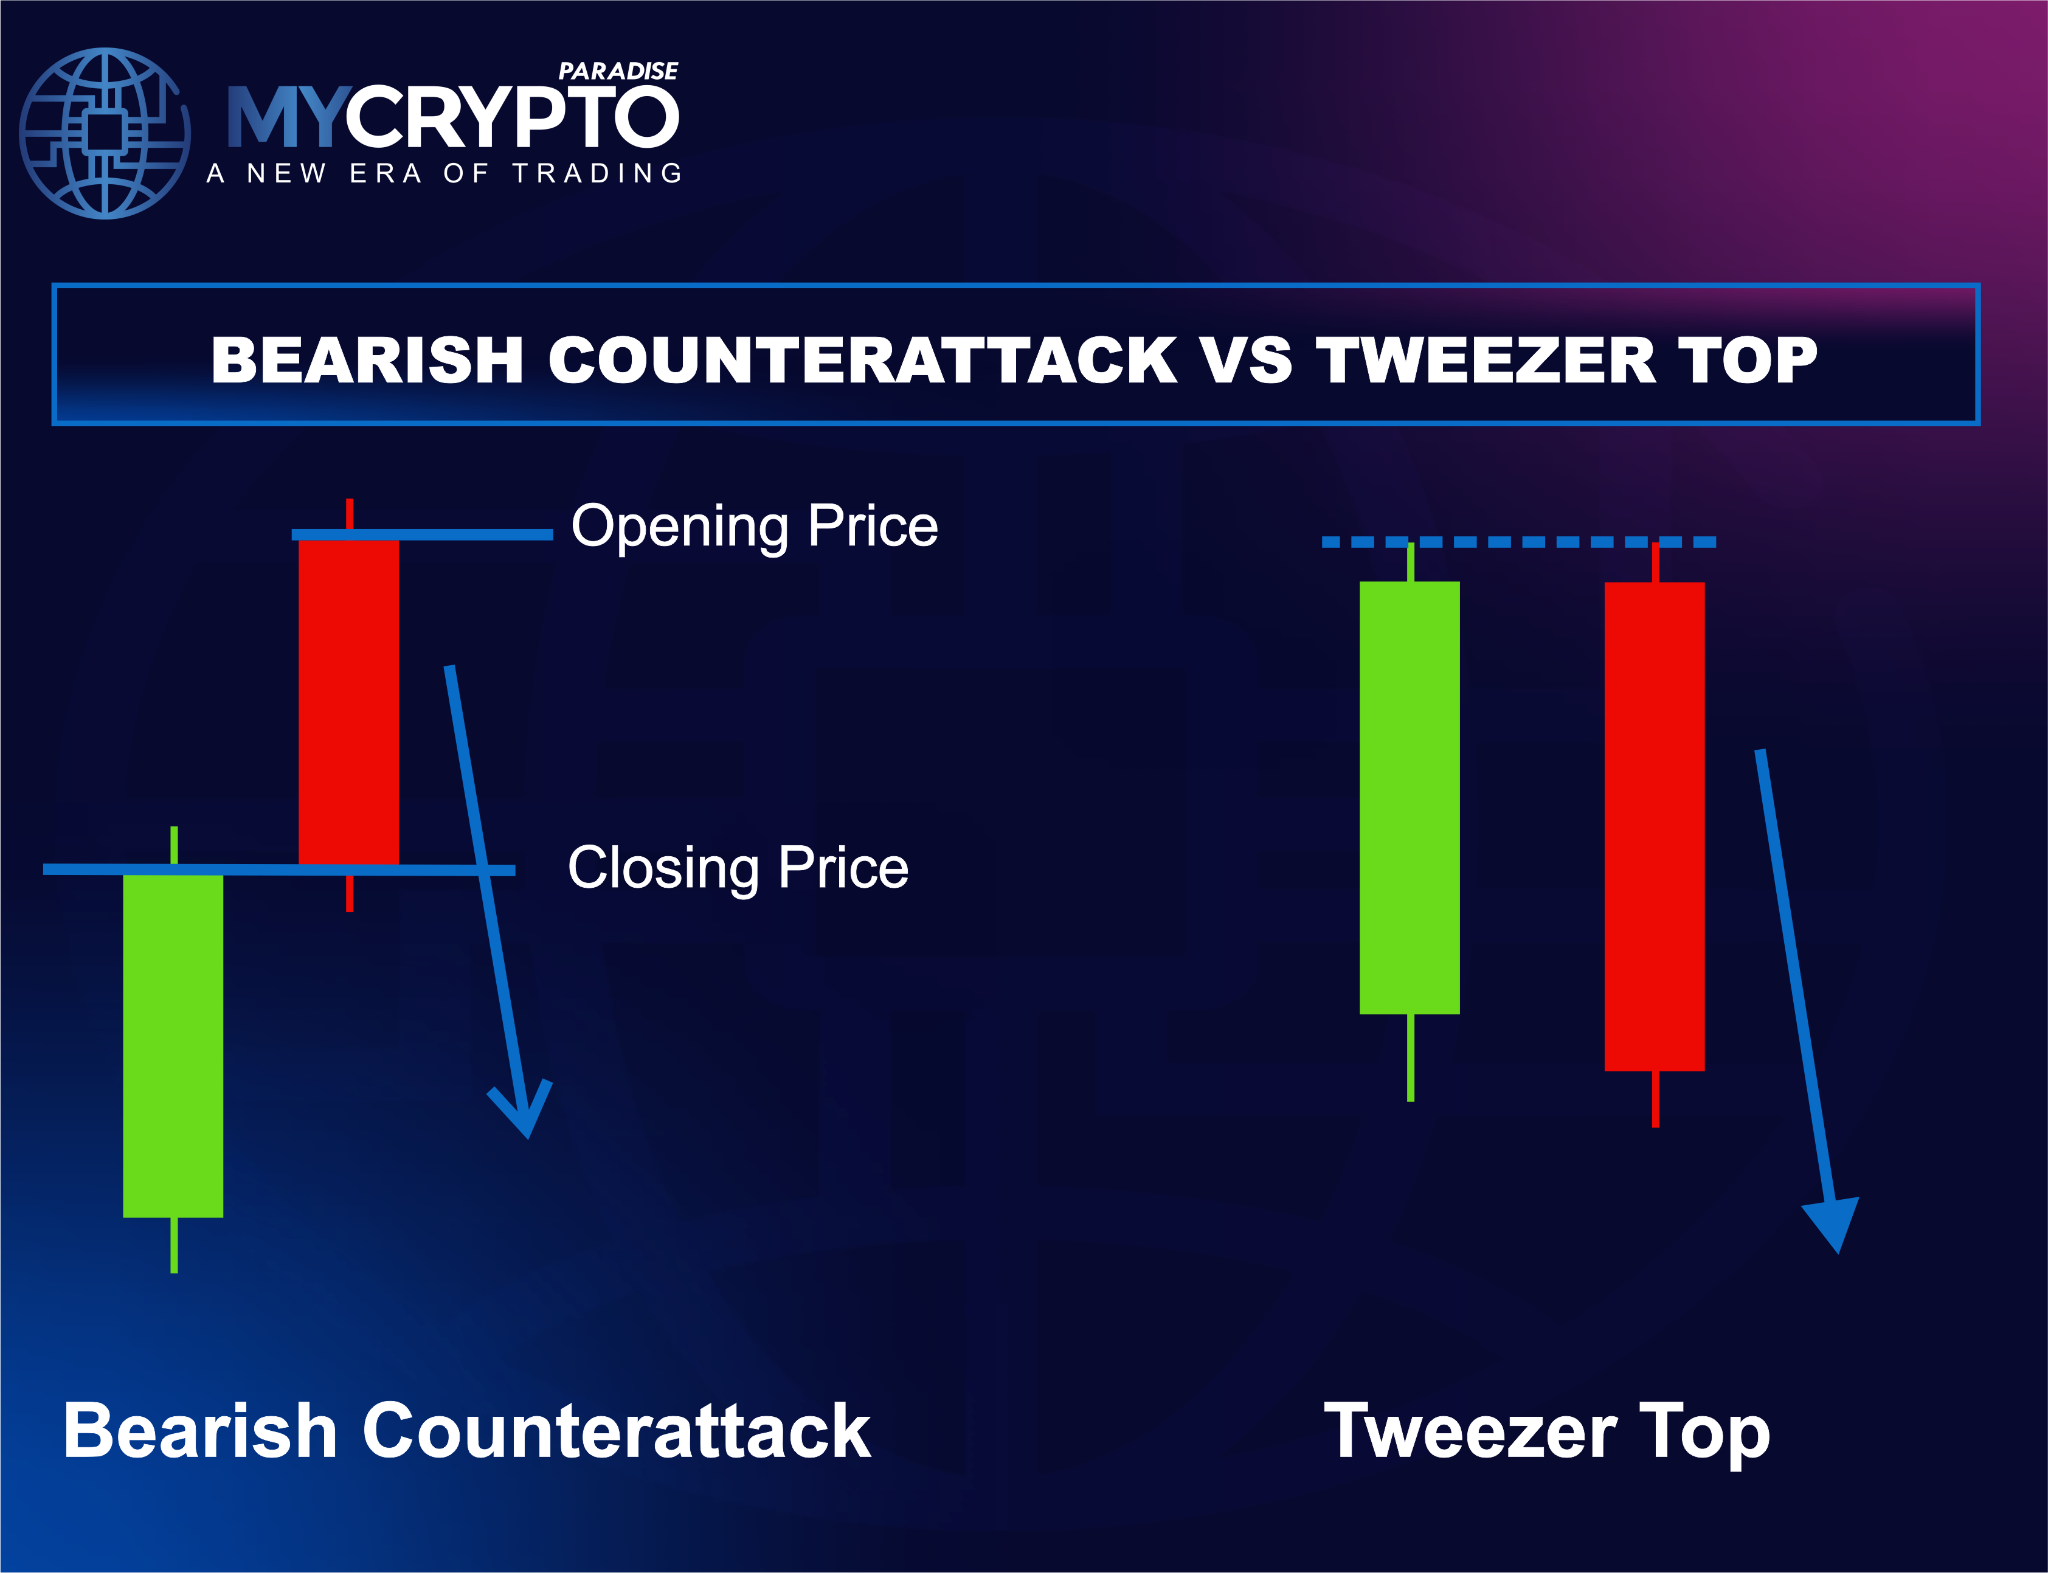
A tweezer top centres on two matching highs and repeated rejection at resistance. The counterattack cares more about the closing price than the high itself. A piercing line pattern is the bullish mirror worth studying too.
Versus evening star
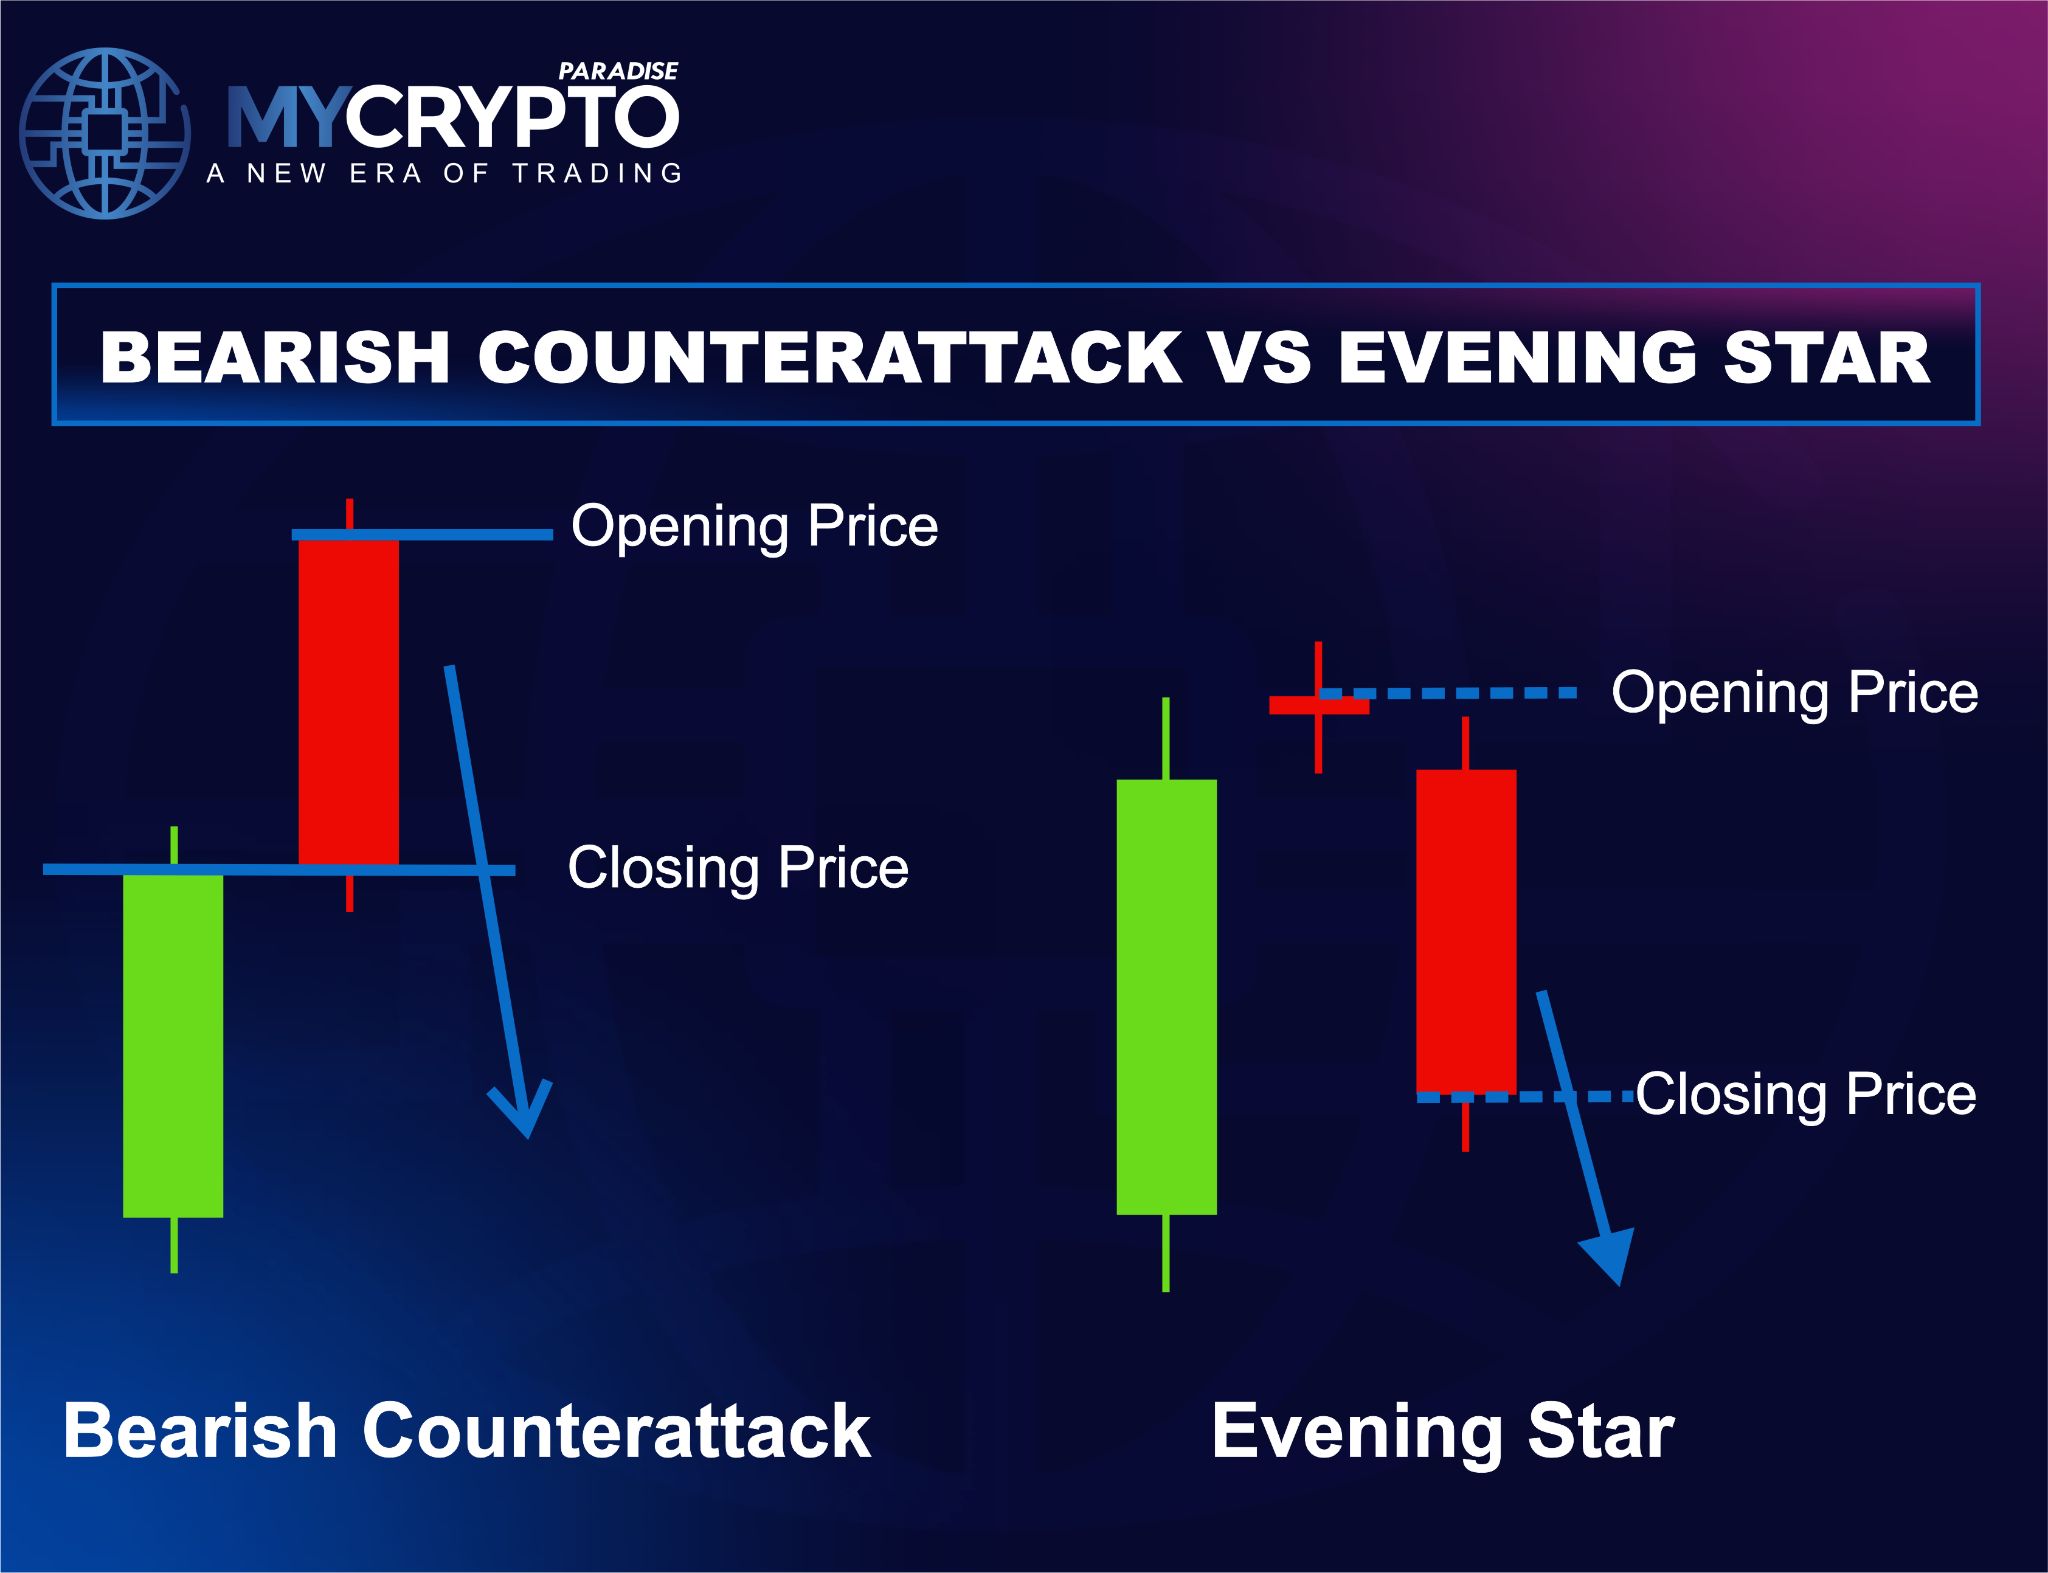
The evening star uses three candles to show buyers stalling before sellers take over. The counterattack relies on two candles and leans on that matching close.
Practice this
- Open a daily crypto chart and mark two or three completed uptrends.
- Find spots where a second candle closed near the first candle close after opening higher.
- Note whether major resistance or a liquidity sweep sat nearby.
- Mark where a break of structure would have confirmed the reversal.
- Review outcomes on paper until the read feels repeatable, without risking capital.
The bottom line
The Bearish Counterattack Pattern is a shift in psychology, not a guaranteed reversal. On its own it is weak, but with resistance, liquidity, volume, and structure it becomes a useful early alert.
MyCryptoParadise is a professional crypto signals and trading-education service operating since 2016. We teach traders to read context and manage risk, so patterns become one input among many, never a shortcut.
FAQs
What is the Bearish Counterattack Pattern?
A two-candle bearish reversal that appears after a sustained uptrend. It signals sellers are absorbing buying pressure and that bullish momentum may be weakening.
Is the Bearish Counterattack Pattern reliable?
Reliability depends on context. It performs best with higher-timeframe resistance, liquidity, market structure, volume confirmation, and disciplined risk management. Probability improves when several factors align, but no pattern is certain.
Does it guarantee a reversal?
No candlestick pattern guarantees future price movement. The Bearish Counterattack Pattern only suggests conditions may be changing. Waiting for confirmation before entering remains the safer approach.
Which timeframe works best?
It can form on any timeframe. Signals on the 4-hour, daily, and weekly charts usually carry more weight because they reflect larger market participants.
Where should a stop-loss go?
A common approach places the stop-loss just above the highest point of the pattern. That level defines where the bearish setup is no longer valid.
Crypto trading involves substantial risk and is not suitable for everyone. Nothing here is financial advice; it is education only. Never risk more than you can afford to lose.














Join the discussion
No comments yet. Members, share how you are reading this.