



In short: The Bullish Counterattack is a two-candle reversal that forms after a downtrend. Buyers absorb heavy selling and push price back to the prior close. Treat it as an early warning, not a buy signal. It works best near support, with rising volume and clear confirmation.
The Bullish Counterattack Pattern is a two-candle reversal that hints control is shifting from sellers to buyers. It forms after a downtrend, when buyers quietly absorb heavy selling and drag price back to the previous close.
At MCP University FREE, we teach why a pattern forms, not just its shape. This lesson shows you how to separate strong setups from weak ones, and when this pattern deserves your attention.
What the Bullish Counterattack Pattern is
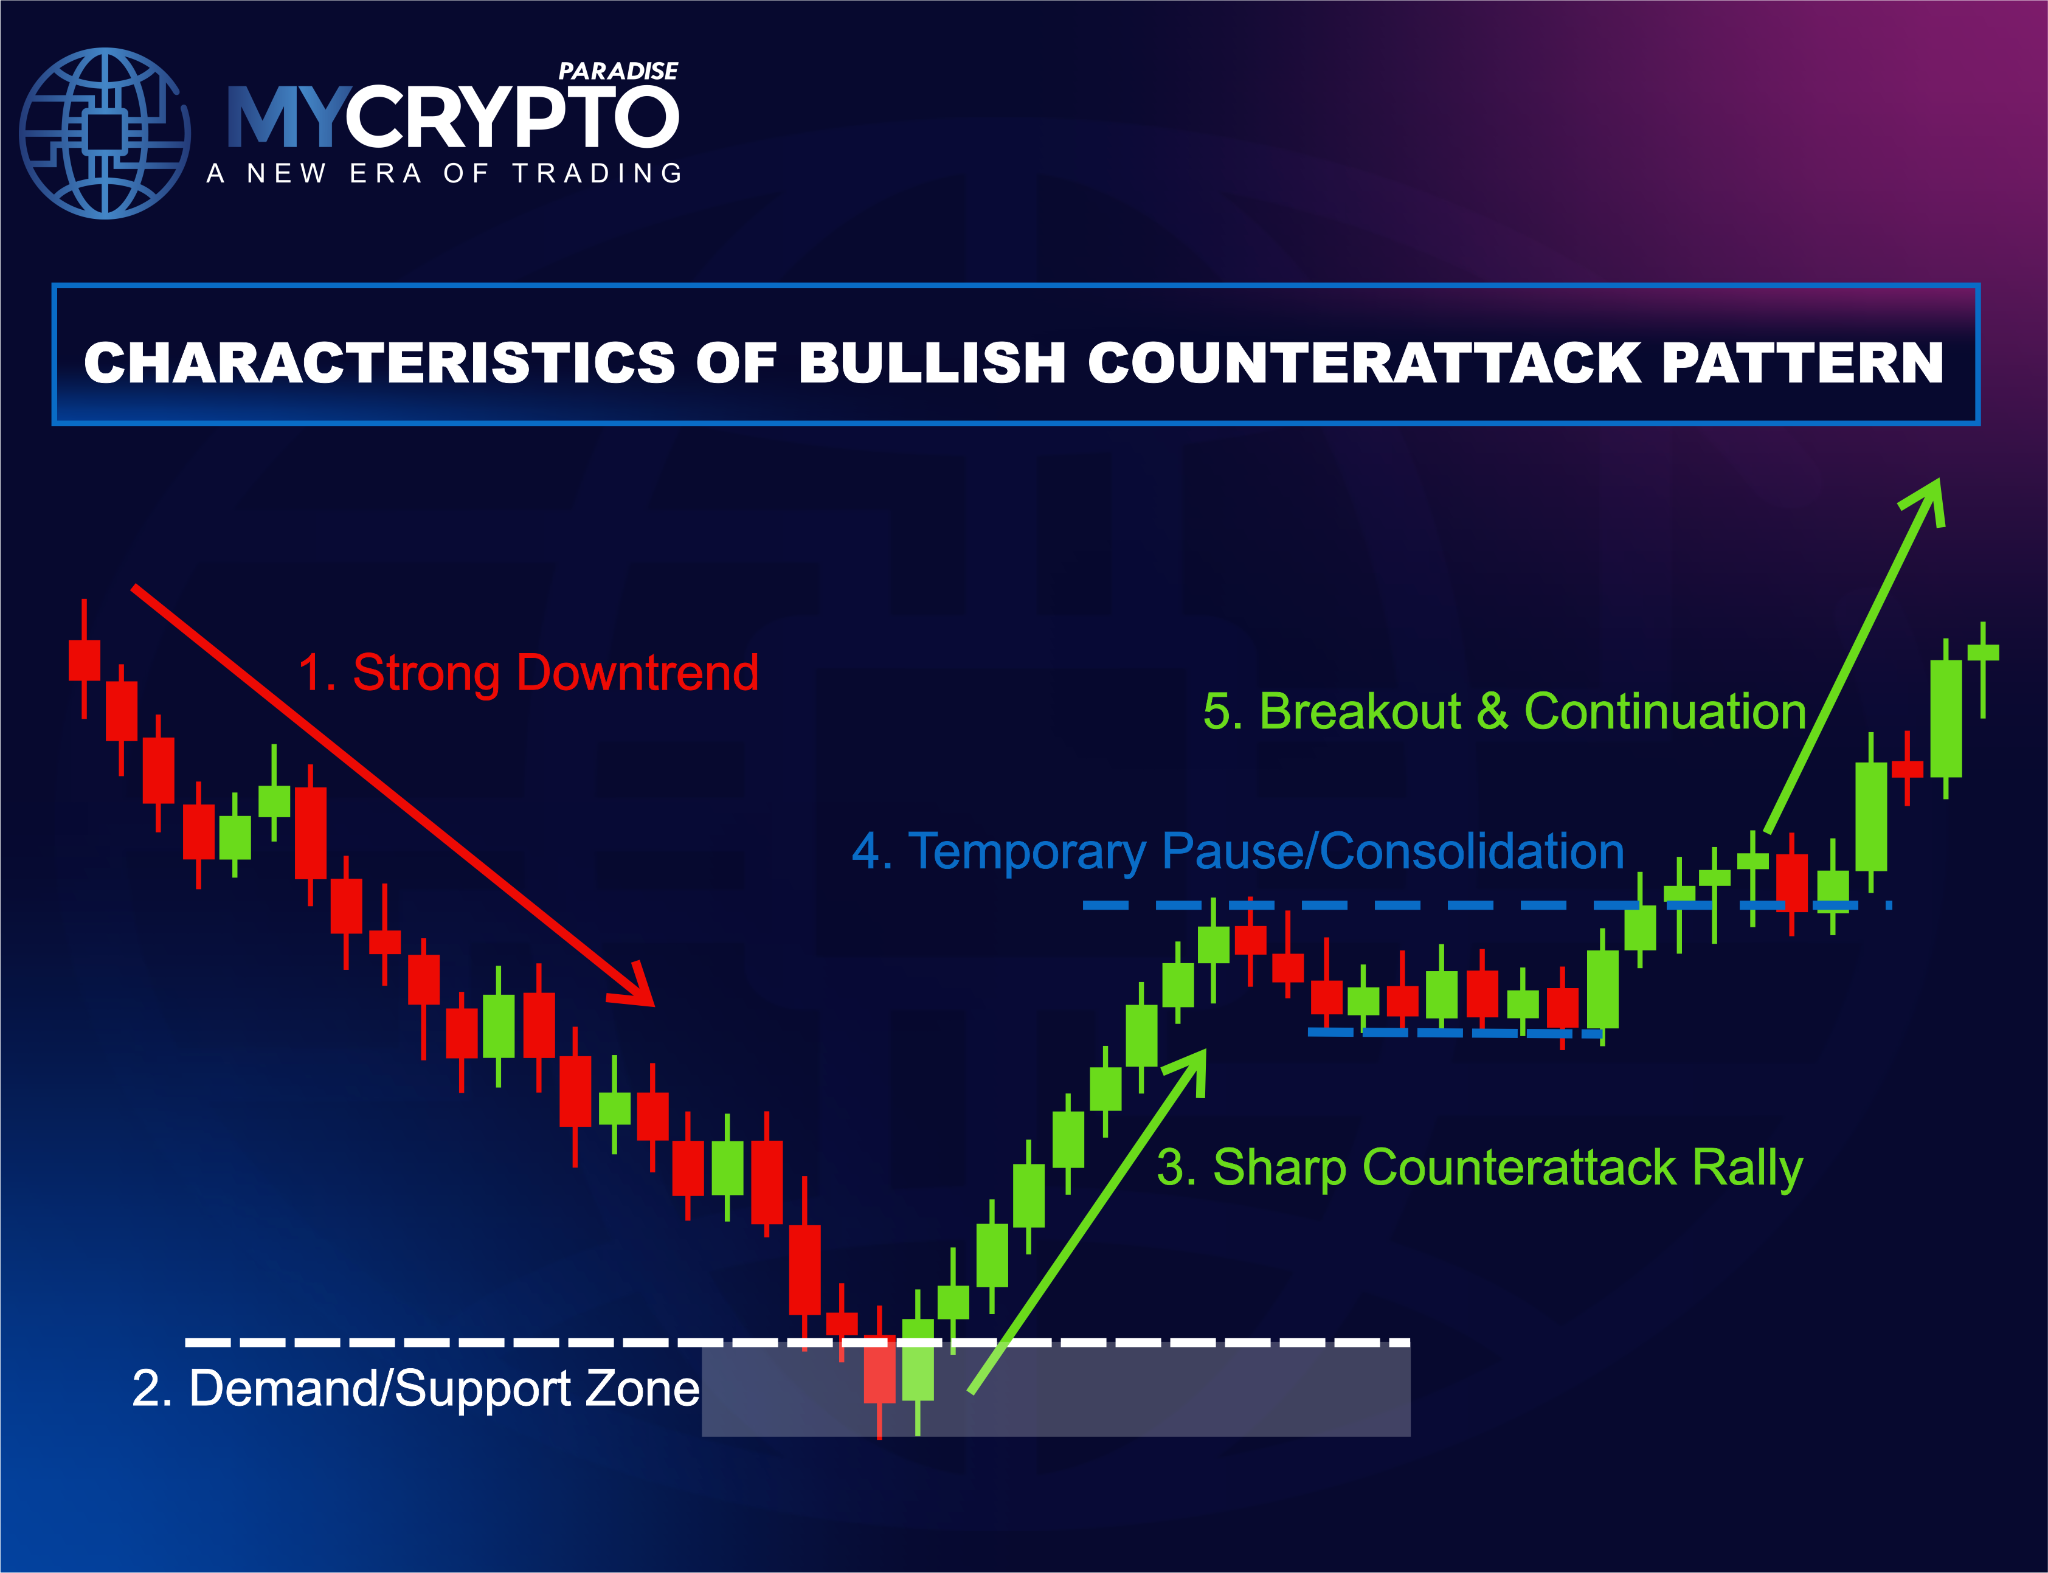
This is a two-candle bullish reversal that develops after a clear downtrend. The first candle is strongly bearish and confirms the ongoing decline. Market sentiment stays negative, and most traders expect lower prices.
The second session opens below the previous close, so the downtrend looks intact. Then something changes. Buyers absorb the incoming sell orders and lift price back toward the first candle’s close.
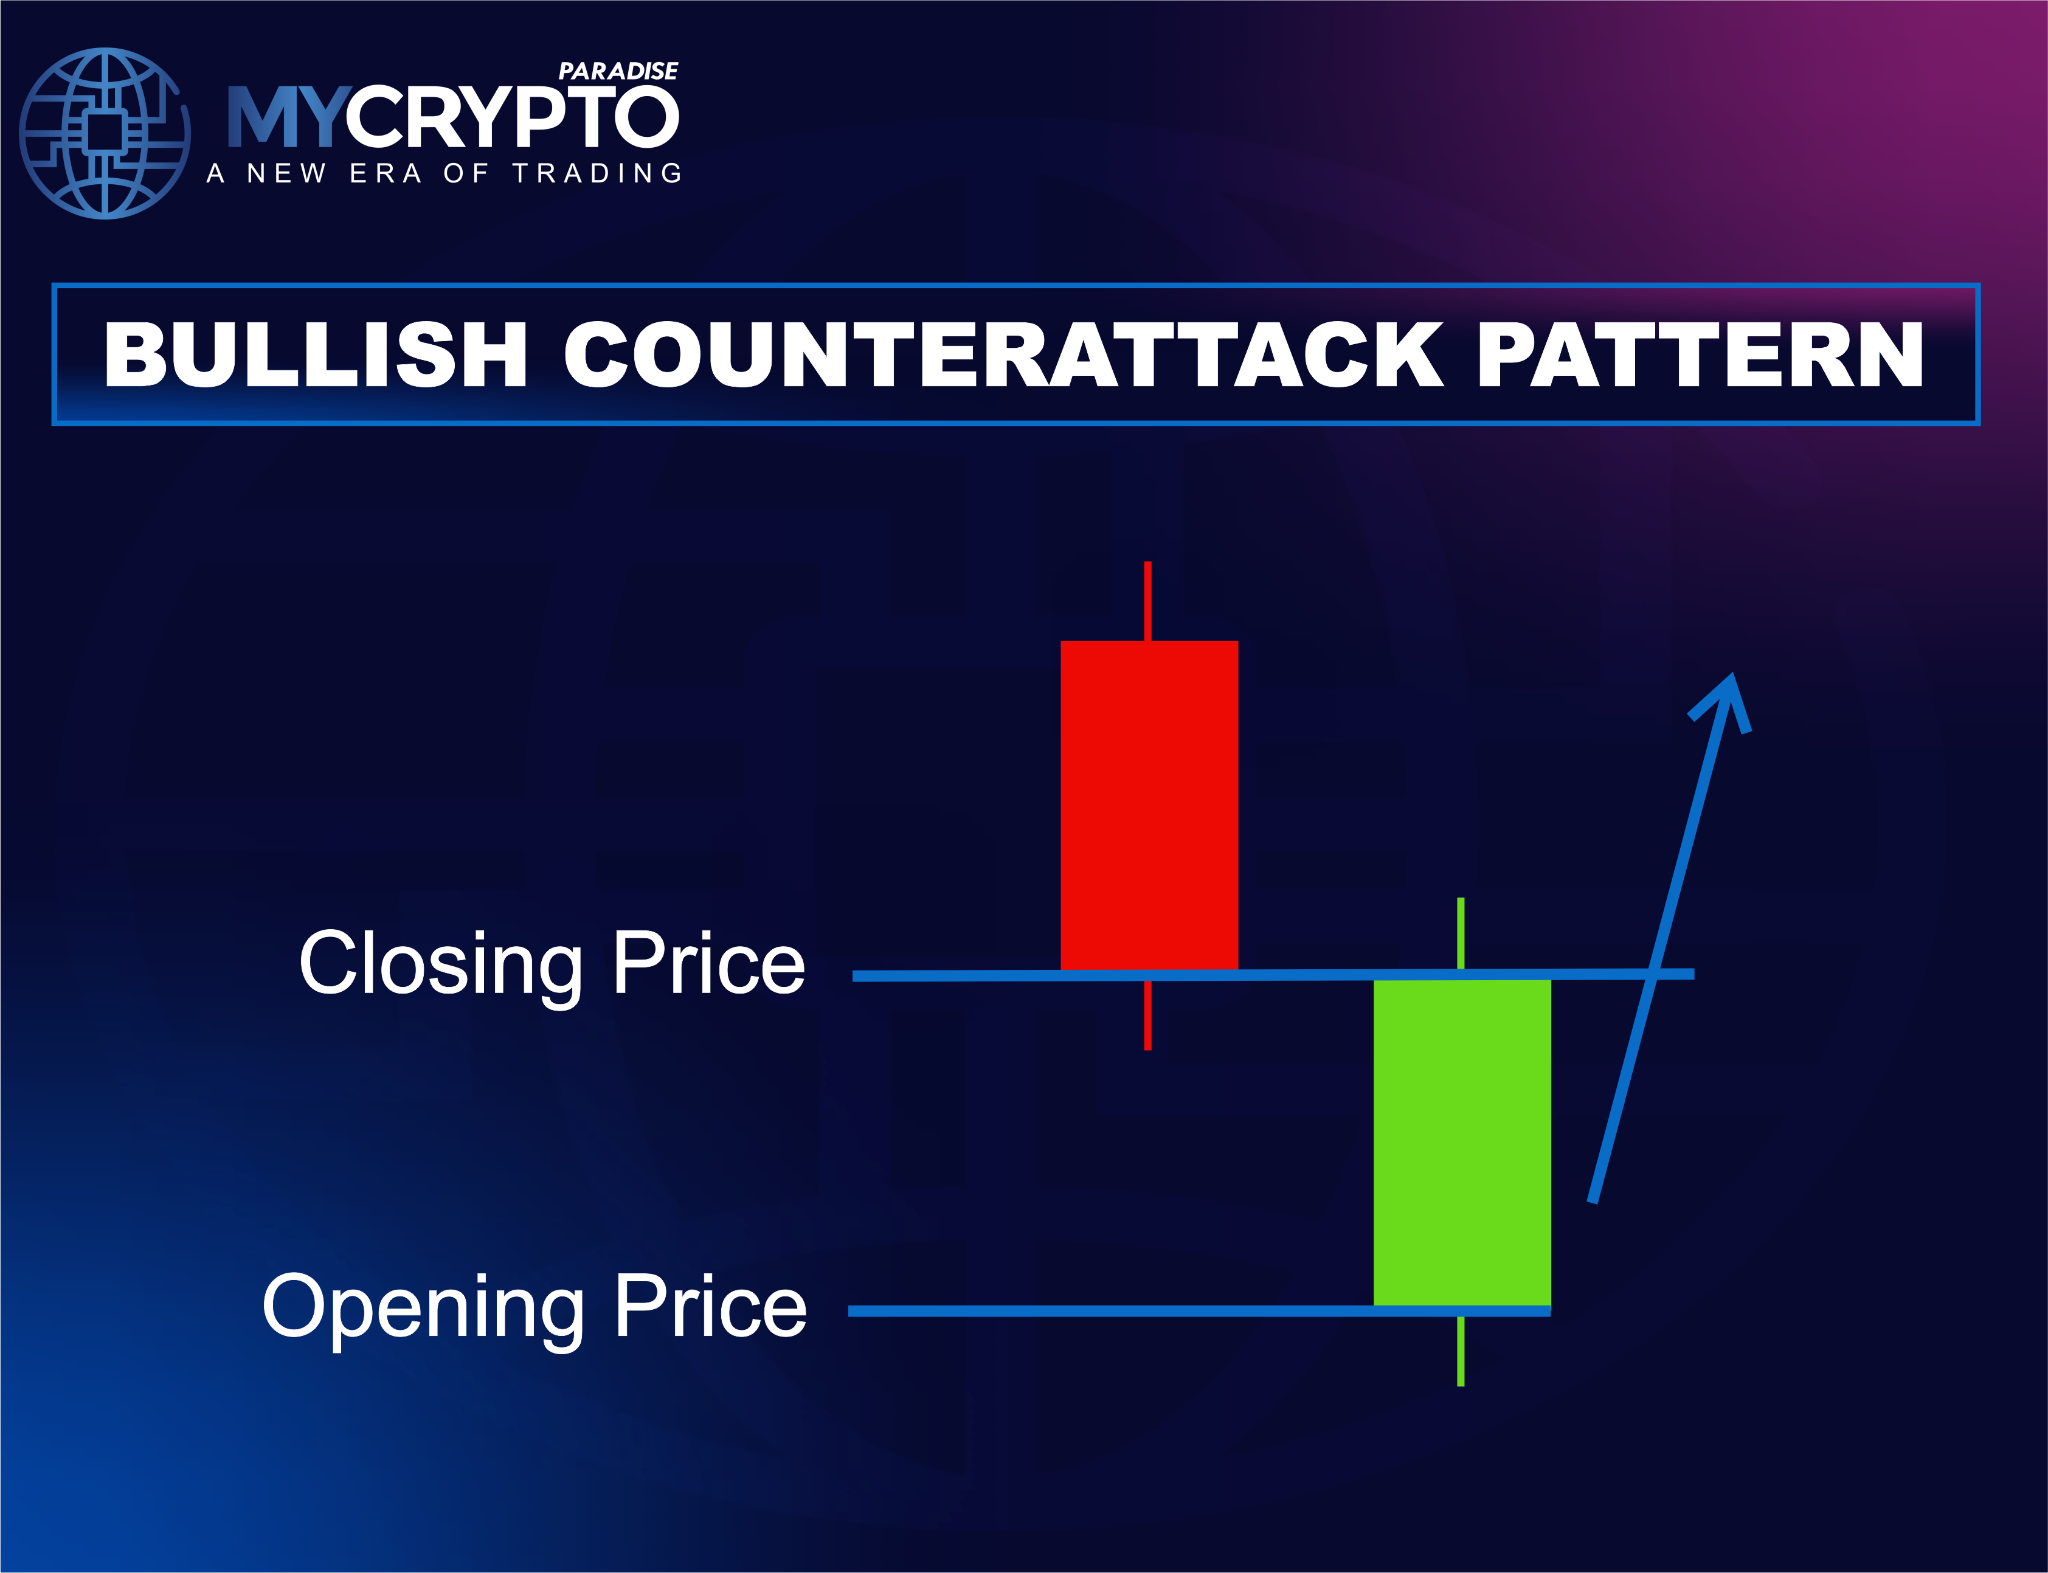
That recovery defines the pattern. Unlike a Bullish Engulfing, buyers do not overpower sellers. They erase almost all of the previous session’s loss, showing bearish momentum is fading.
In crypto, sharp emotional swings are common. The pattern often appears around demand zones, liquidity sweeps, higher-timeframe support, or after panic-driven selloffs.
Key characteristics to check
- A clear downtrend first: the longer sellers have controlled price, the more meaningful the potential reversal.
- A strong bearish first candle: a large down body shows sellers remain firmly in control.
- Weakness on the second open: price starts lower, since round-the-clock crypto rarely leaves true gaps.
- Buyers take control: demand absorbs sell orders through the session and pushes price back up.
- Matching closing prices: the second candle closes almost exactly where the first one closed.
Why the pattern works
The real strength comes from order flow, not the candle shapes. As price falls, bearish confidence grows. Retail traders panic-sell, shorts add exposure, and tired holders exit at poor prices.
When the second candle opens lower, most people read it as more downside. A firm recovery back to the close surprises them. That shift can trigger fresh buying and force short sellers to cover.
How to identify a high-quality setup
Spotting two candles is not enough. The environment around the pattern is what separates strong signals from noise.
- Confirm the downtrend: look for consistent lower highs and lower lows below key resistance.
- Find major support: historical support, demand zones, order blocks, Fibonacci levels, or psychological prices.
- Read both candles: aggressive selling first, then weakness that recovers to the prior close.
- Check volume: a recovery on rising volume suggests real buying, not just short covering.
- Wait for confirmation: a strong close above the pattern’s high, or a clean support retest.
How to trade it
The pattern works best as one part of a full plan, not a standalone signal. Your entry style should match the confluence you see.
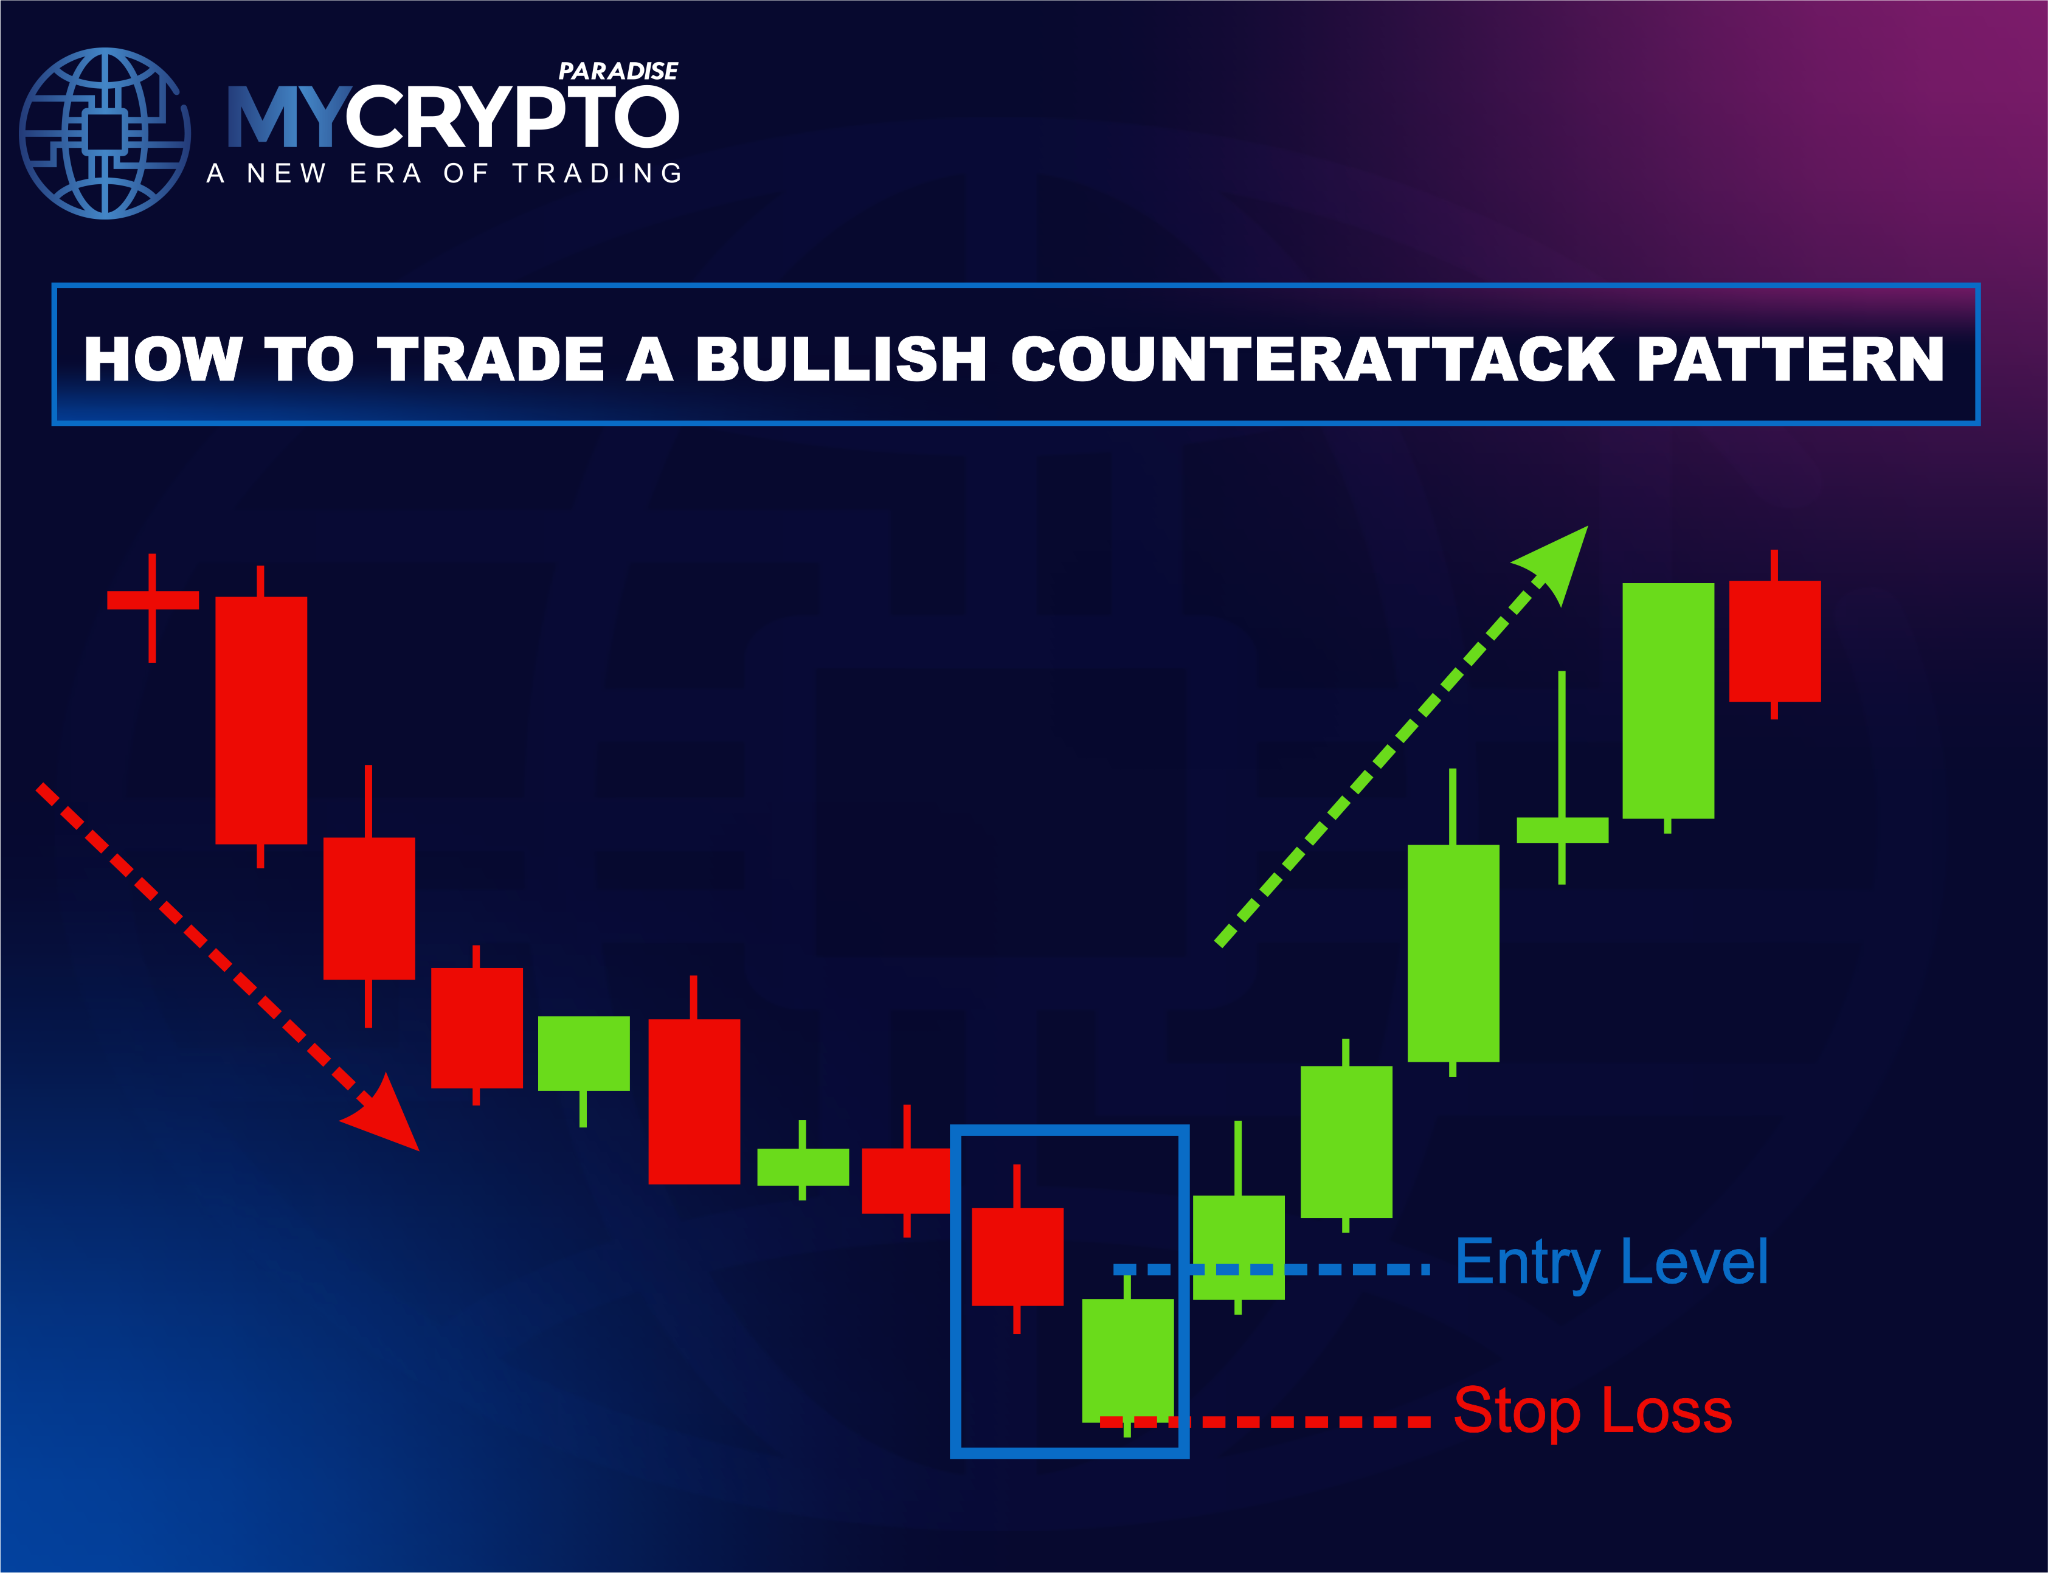
A conservative entry waits for a breakout above the pattern’s high, then a pullback or retest. A more aggressive entry acts as the second candle closes, but only with strong support and rising volume.
Place the stop-loss below the lowest point of the pattern. This gives room for normal volatility and marks where the bullish idea is invalid.
For targets, use logical levels where selling may return. Common choices are prior swing highs, major resistance, resting liquidity, or Fibonacci extensions. Many traders bank partial profit at the first level and trail the rest.
How reliable is it?
Treat this as a moderately reliable signal that depends on context. Several factors raise the odds of a real reversal.
- Extended prior decline: exhausted bearish momentum leaves more room for buyers to turn price.
- Strong support: higher-timeframe support and demand zones naturally attract buyers.
- Liquidity sweep: a brief dip below recent lows, then a sharp reversal, is a powerful tell.
- Rising volume: stronger buying volume points to genuine demand, not a quick bounce.
- Higher-timeframe confluence: alignment with daily or weekly support tends to outperform.
Common mistakes
The pattern is easy to spot and easy to misuse. Most costly errors come from ignoring the wider market context.
- No real downtrend: without prior selling, there is little momentum to reverse.
- Entering before confirmation: buying the second candle’s close invites more false signals.
- Ignoring structure: a clean pattern still fails if price keeps making lower highs and lows.
- Overlooking volume: a weak-volume recovery is often just short-term profit-taking.
- Poor risk management: even strong setups fail, so protect capital before chasing gains.
How it differs from similar patterns
Several bullish reversals look alike but tell different stories. Reading the differences helps you match the right pattern to the right plan.
Versus the Bullish Engulfing
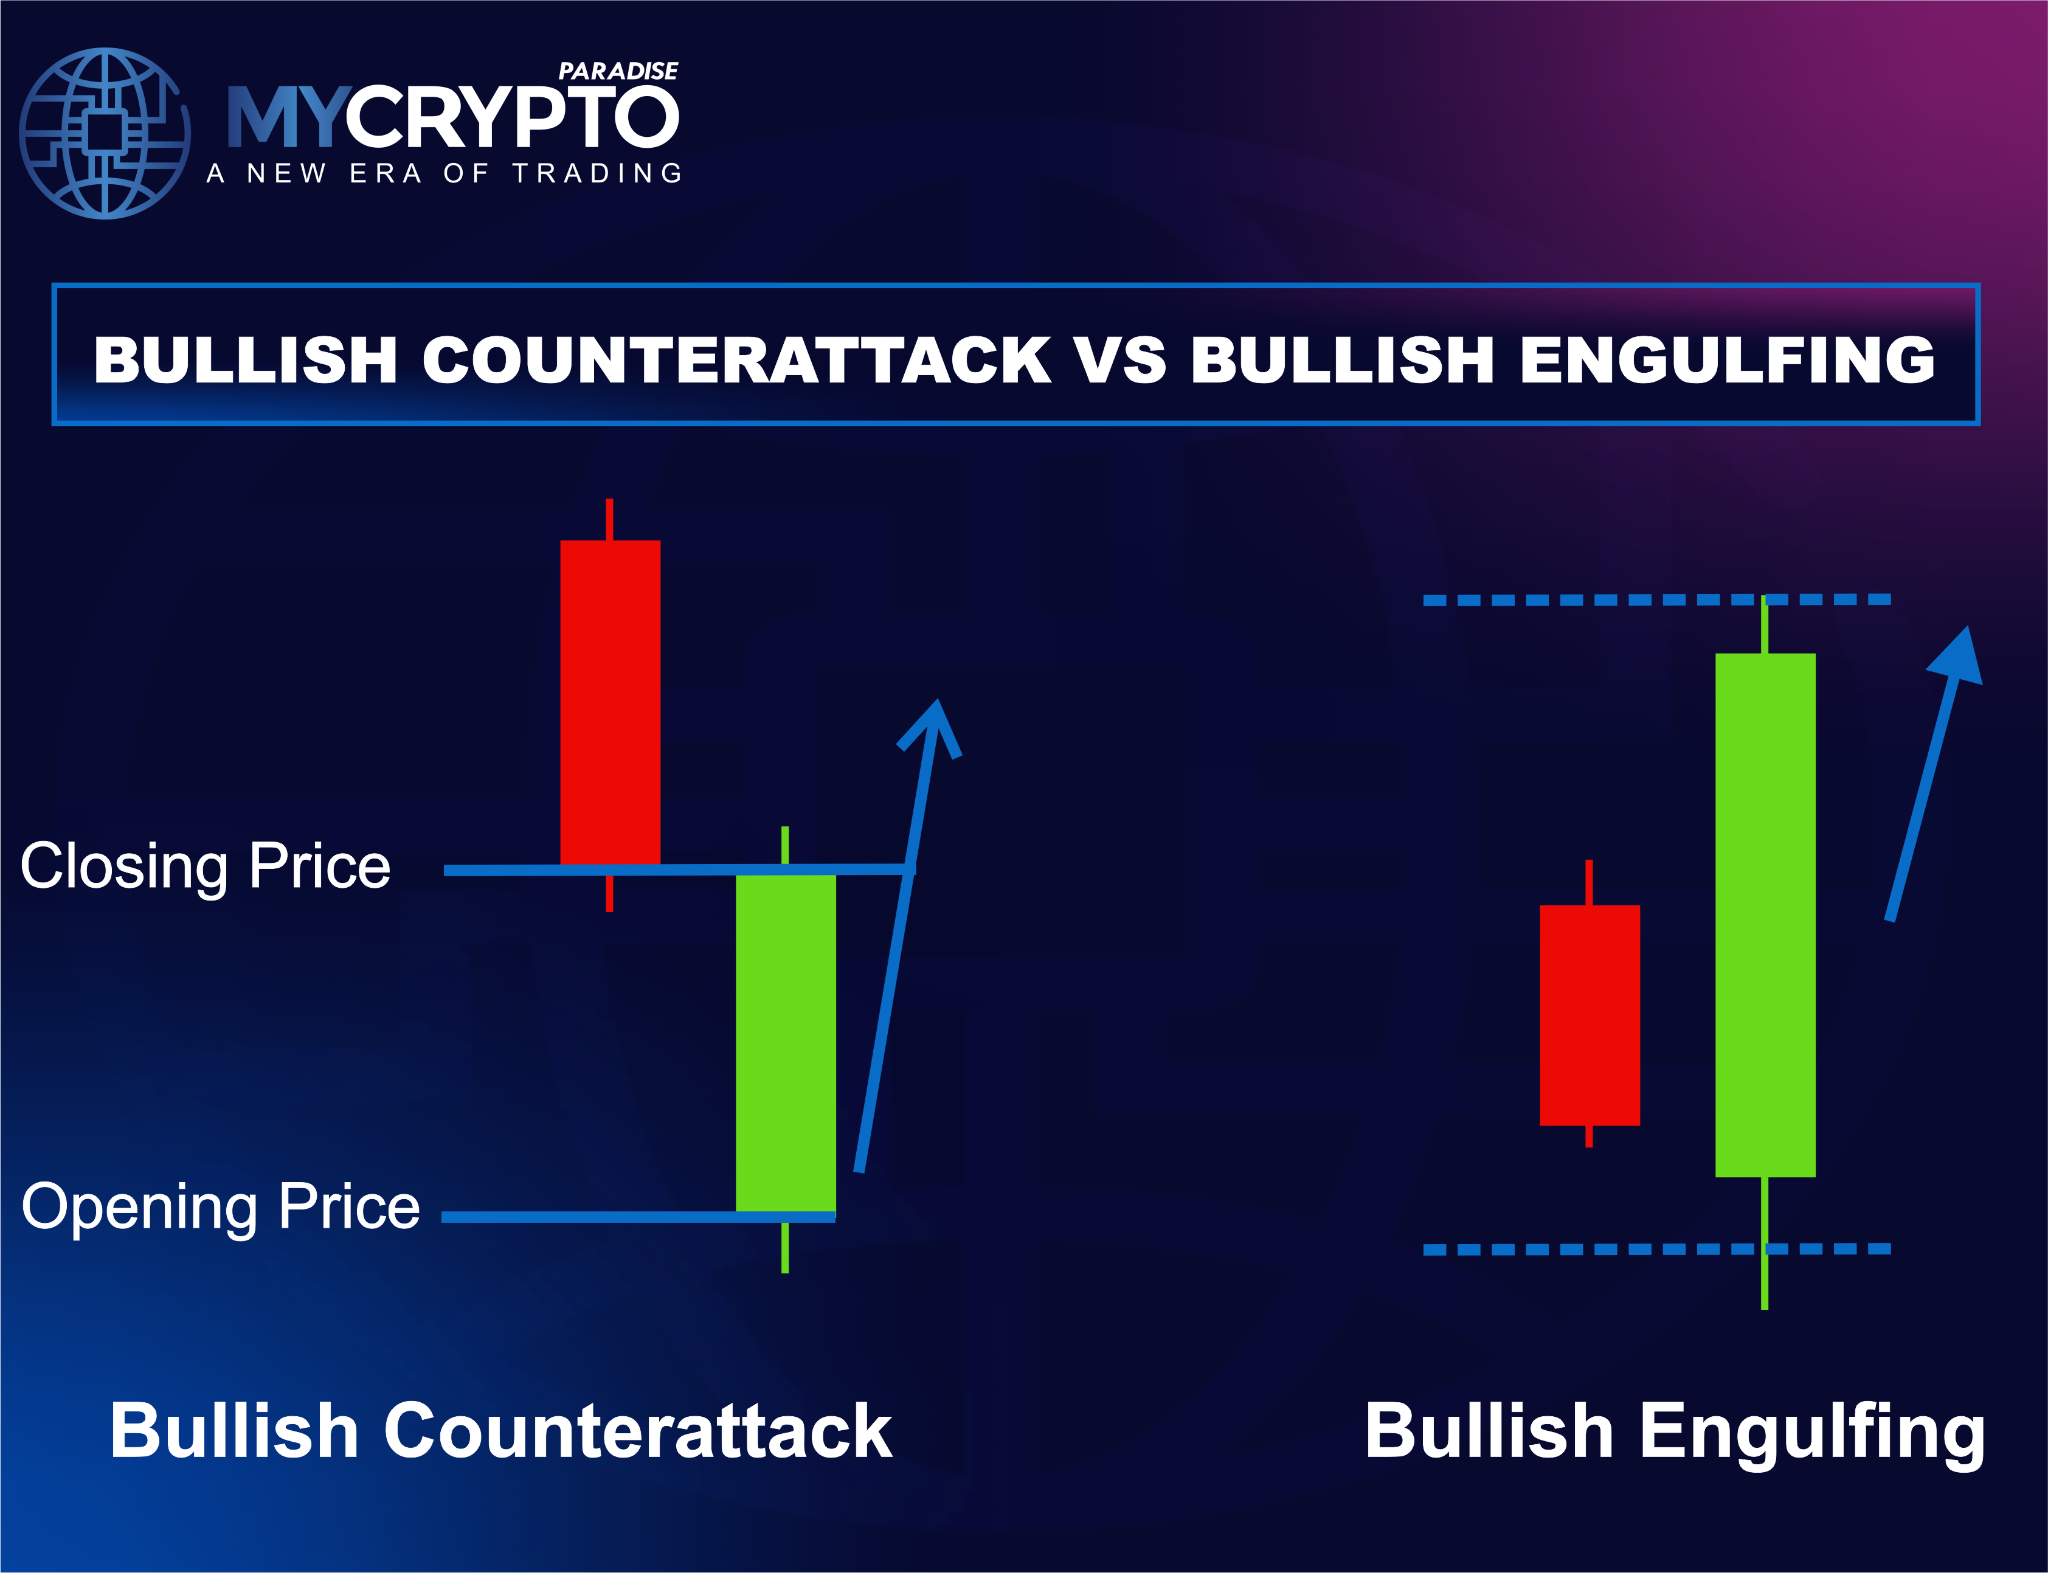
Both patterns show sellers losing control as buyers step in. The difference is the strength of the recovery.
A Bullish Engulfing completely engulfs the previous bearish candle, which signals overwhelming buying pressure. The Counterattack stops short: it closes near the prior close, neutralising the decline without fully dominating sellers.
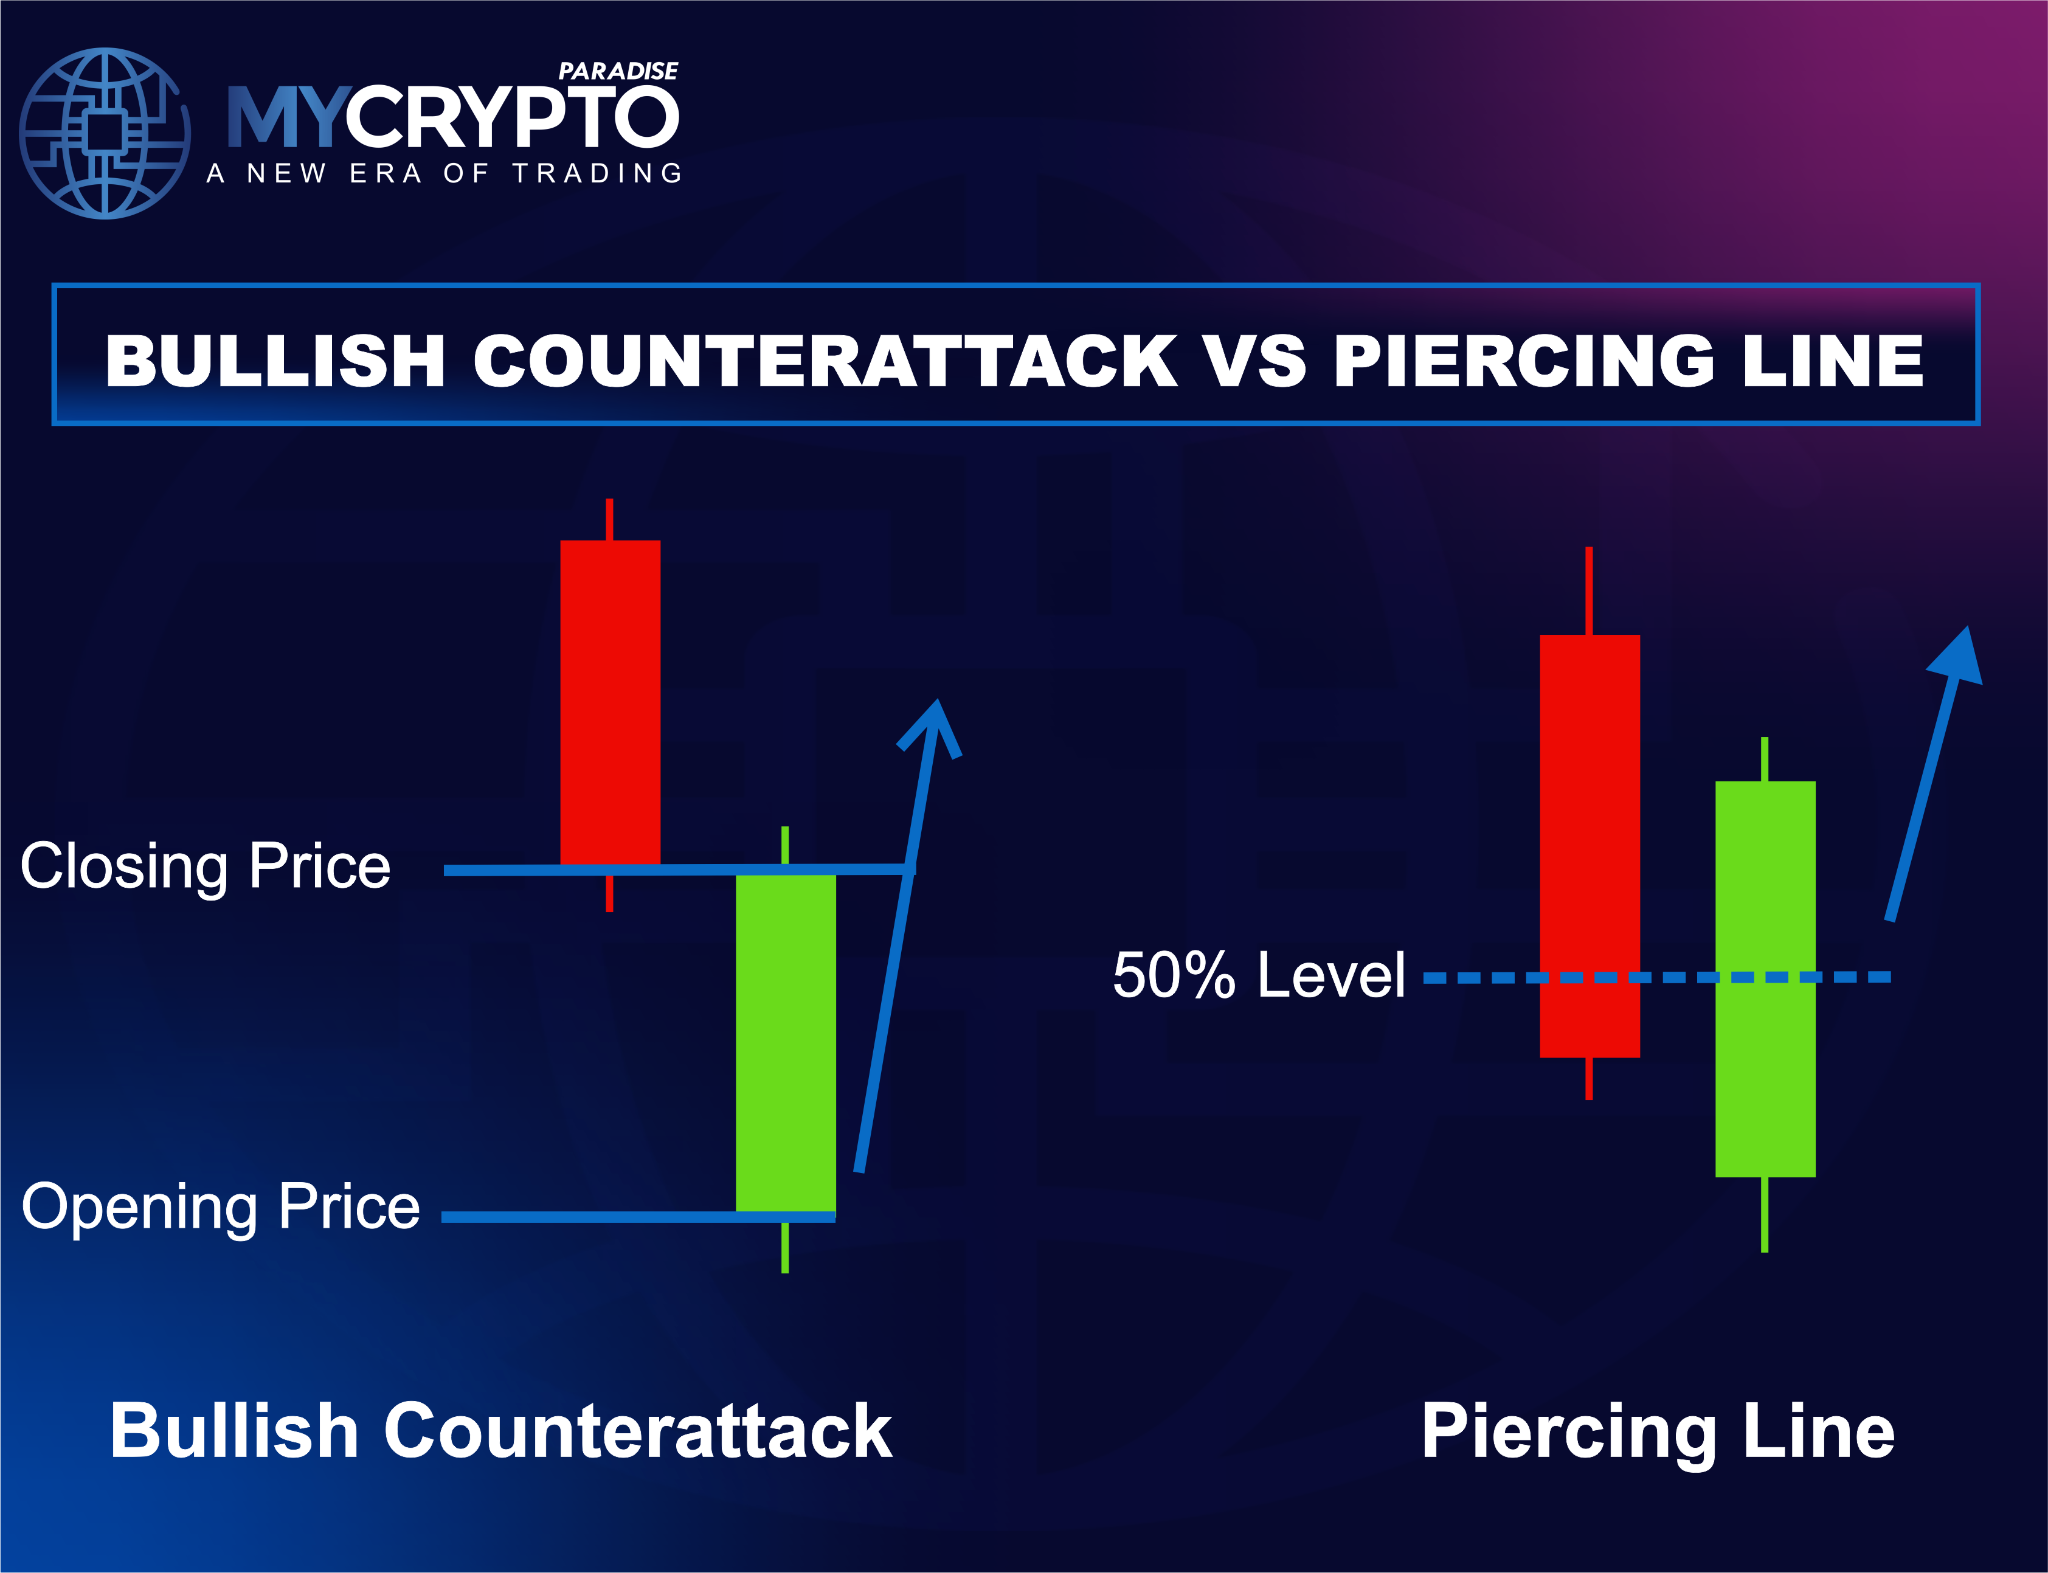
Versus the Piercing Line
Both form after a downtrend and use two candles. A Piercing Line closes above the midpoint of the previous bearish candle, but not always near its close.
The Counterattack is stricter. Its second candle finishes almost exactly where the first candle closed.
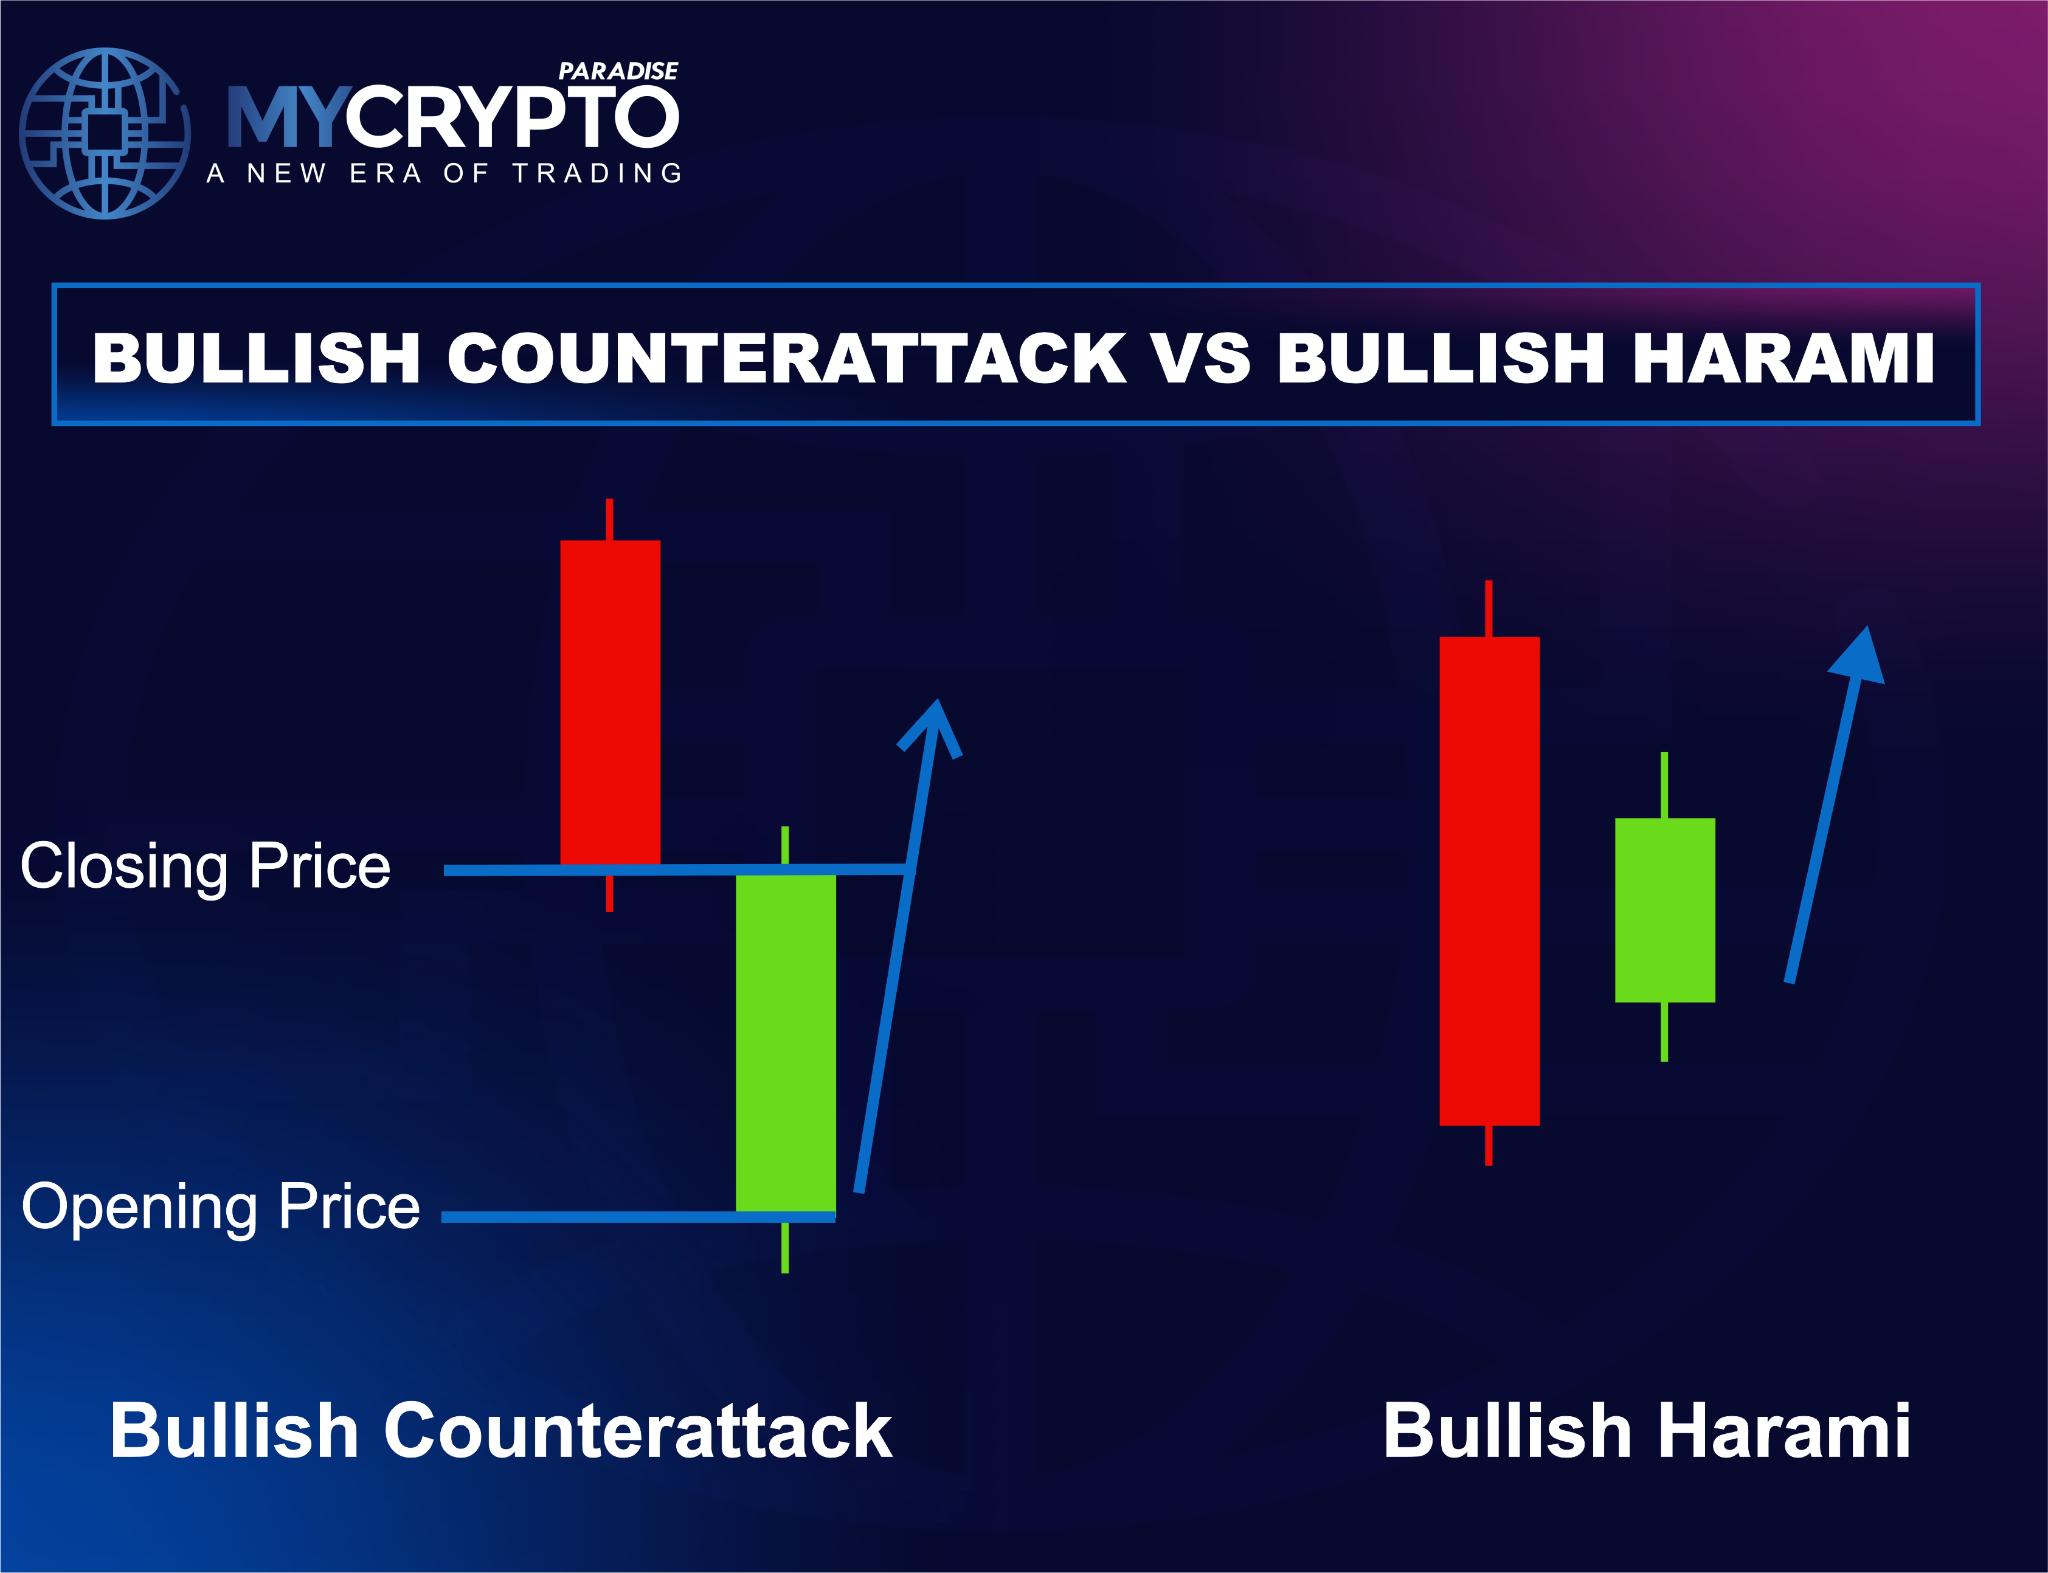
Versus the Bullish Harami
A Bullish Harami prints a small bullish candle inside the previous bearish body. It hints at fading momentum rather than a strong fight back.
The Counterattack shows a firmer recovery, driving price all the way back to the prior close.
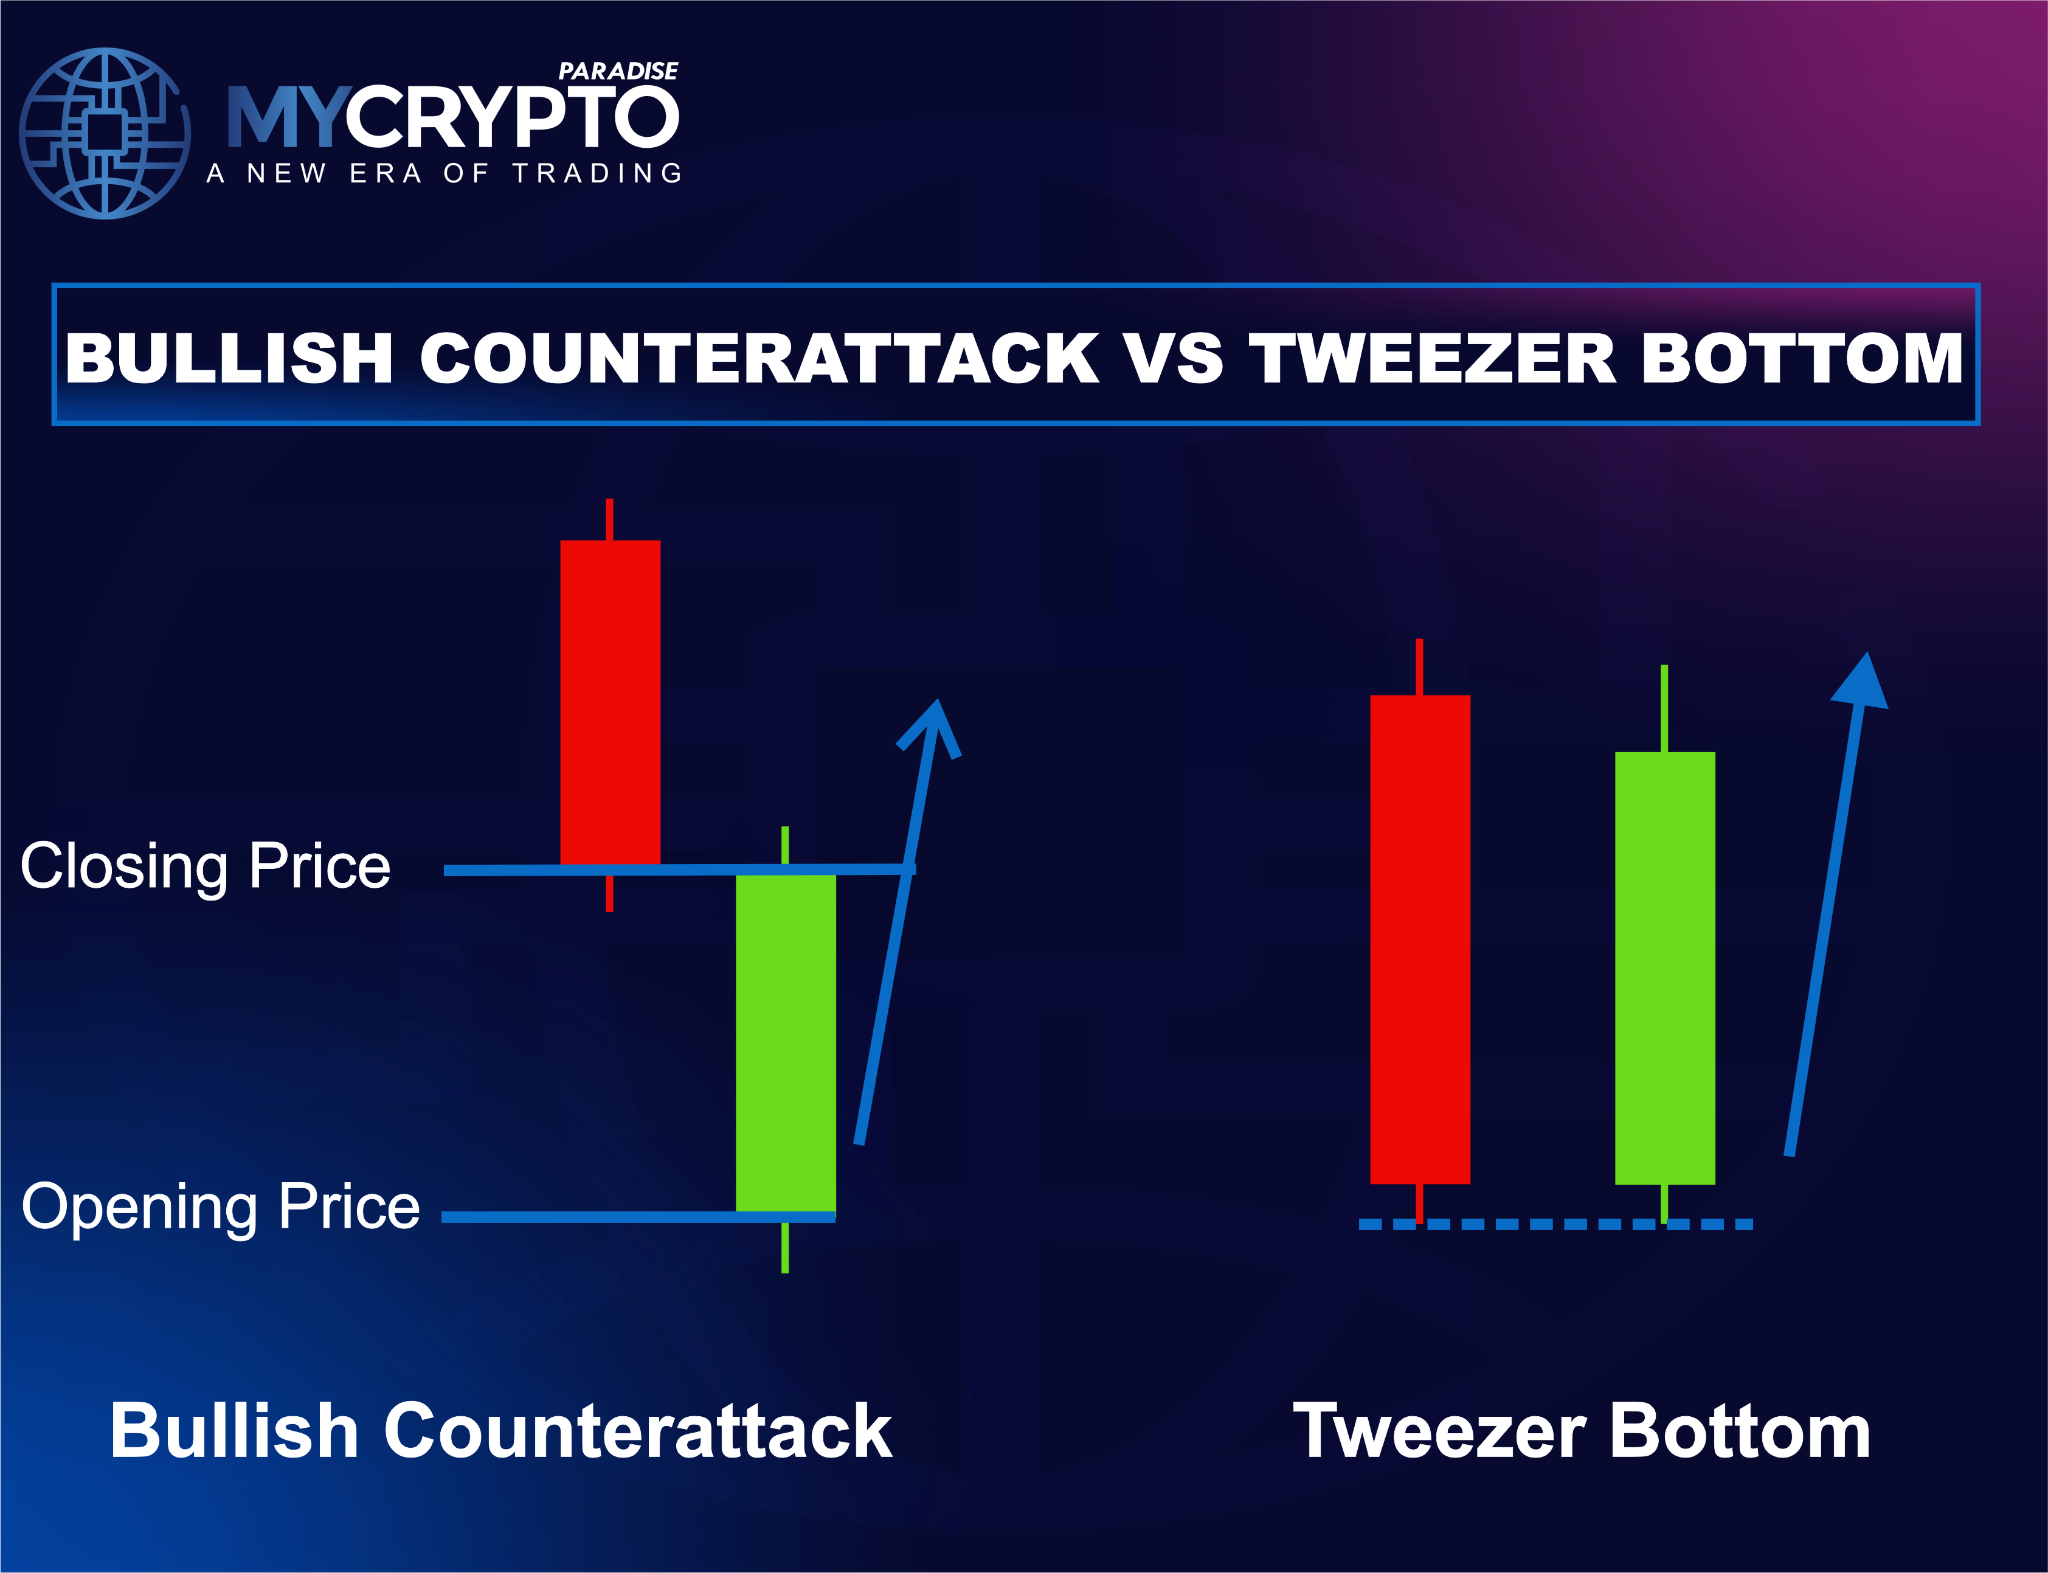
Versus the Tweezer Bottom
A Tweezer Bottom forms two nearly identical lows, showing buyers defending the same support twice. The Counterattack cares about the close, not the low.
Both can signal a reversal. They simply highlight different parts of market psychology.
Practice this
Open a chart and mark the last three clear downtrends on the daily. Find any two-candle spot where price opened lower, then closed near the prior close. Note whether support and volume were present.
Then track what happened next without trading it. Did price confirm above the pattern’s high, or fail? Repeat across several coins to build pattern recognition and honest expectations.
Remember: no candle pattern guarantees the next move. The Counterattack simply flags that conditions may be changing. Combine it with structure, liquidity, volume and disciplined risk, and it becomes a useful early clue.
FAQs
What is the Bullish Counterattack Pattern?
A two-candle bullish reversal that appears after a sustained downtrend. It signals that buyers are absorbing selling pressure and that bearish momentum may be weakening.
Is the Bullish Counterattack Pattern reliable?
It is moderately reliable when context supports it. The pattern performs best alongside higher-timeframe support, liquidity analysis, market structure, volume confirmation and disciplined risk. Its odds improve when several confluence factors align.
Does the pattern guarantee a reversal?
No candle pattern guarantees future price movement. This one simply suggests conditions may be changing. Waiting for confirmation before entering remains the safer approach.
Which timeframe works best?
It can form on any timeframe. Signals on the 4-hour, daily and weekly charts usually carry more weight. Larger charts reflect participation from bigger market players.
Where should a stop-loss be placed?
A common approach places the stop-loss below the lowest point of the pattern. This gives room for normal volatility and defines where the bullish idea is invalid.
This class is part of the free education library from MyCryptoParadise, a professional crypto signals and trading education service operating since 2016.
Crypto trading involves substantial risk and is not suitable for everyone. Nothing here is financial advice; it is education only. Never risk more than you can afford to lose.











Join the discussion
No comments yet. Members, share how you are reading this.