


Candlestick Patterns Explained
In short
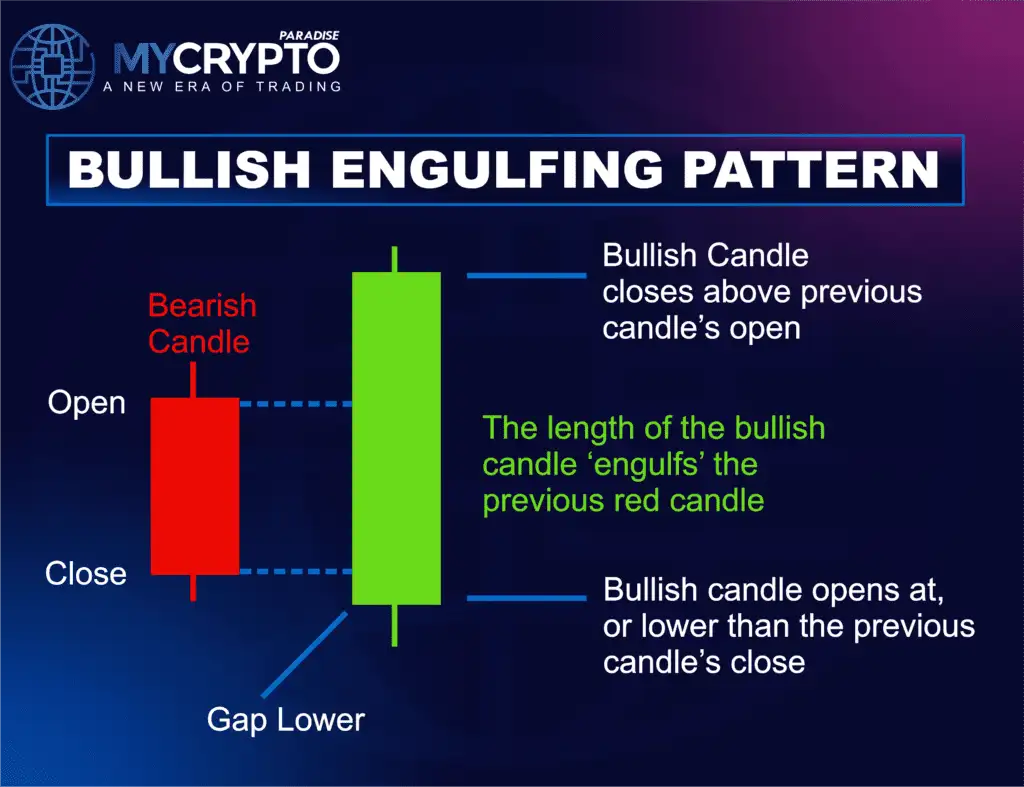
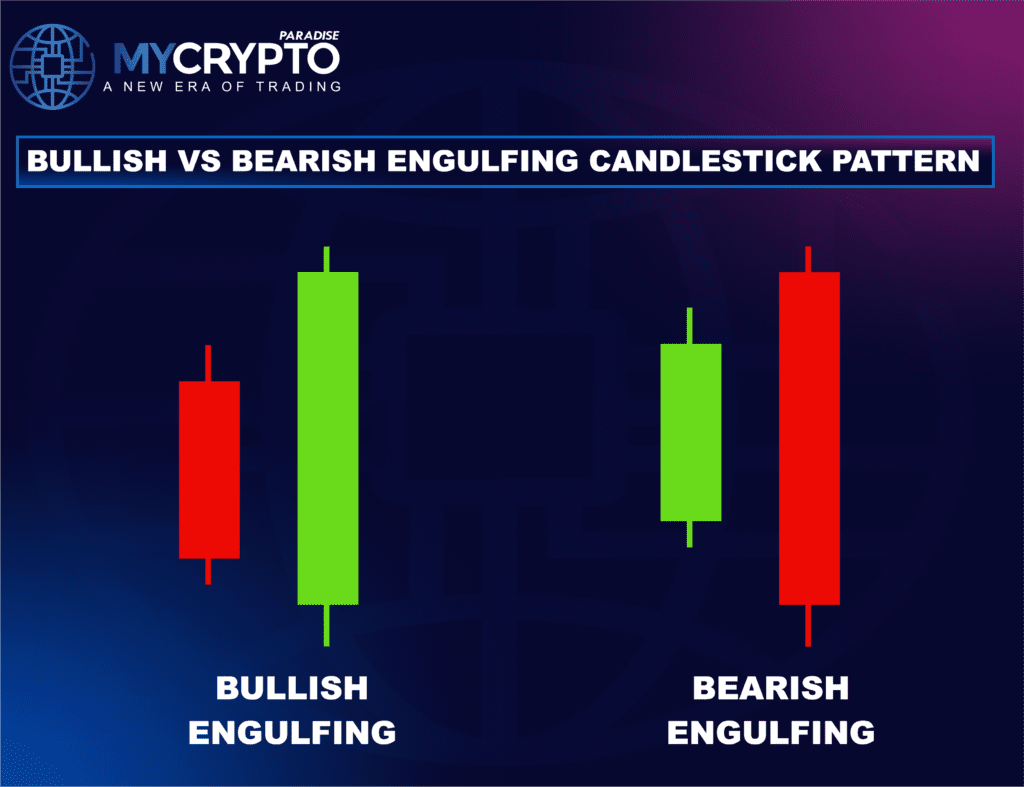
A bullish engulfing pattern is a two-candle reversal signal where a large green candle completely covers the body of the preceding red candle, indicating a potential shift from selling to buying pressure. This pattern is considered more reliable when it appears at a support level, is accompanied by increasing volume, and is confirmed by the candle's closing price.
- A bullish engulfing pattern can be a solid sign that the market might be getting ready to turn higher. You’ll often see it after a sharp selloff, where buyers finally step in with enough strength to push the price back up and shift short-term momentum.
- Still, confirmation is everything. Seasoned traders don’t react to the pattern alone; they wait for a clean close and then weigh volume, nearby support, and how the trade fits within their risk plan before taking action.
- The setup can highlight a potential change in momentum early, but its edge always depends on the bigger picture, the overall structure, where it forms on the chart, and how volatile the market is at that moment.
The Bullish Engulfing Pattern is incredibly powerful and one of crypto’s most effective short-term reversal indications. If you spot it early, you’ll have a clear idea that selling pressure is fading and buyers are starting to step in. This gives you a chance to profit from crypto reversals.
At MCP University FREE, this guide is part of our precision-trading series developed for disciplined, structure-focused crypto traders. After reading the full article, you will be able to identify, confirm, and trade Bullish Engulfing trading setups with expert accuracy and confidence.
What is Bullish Engulfing Pattern?
A bullish engulfing pattern seems straightforward on paper. One red candle, then a strong green candle that fully engulfes or overtakes it. Textbooks call it a reversal indicator during a short-term downturn.
That’s okay, but in live crypto markets, it’s rarely that clean. Most of the time, the red candle closes much lower before the move happens. Sellers feel in control. Maybe it swept an earlier low. Maybe it provoked some late shorts. Nothing dramatic, just continuous pressure. If you’ve traded long enough, you’ve seen that kind of candle a thousand times.
Then the next session opens. And instead of continuing lower, buyers come in immediately. No hesitation. Price is regaining lost ground swiftly. The preceding candle’s open gets taken back. Shorts who entered late start getting uncomfortable. By the time the candle closes around its highs, the entire tone of the chart has transformed.
A bullish engulfing forming in the middle of a choppy range isn’t very meaningful; it’s usually just noise. The ones that matter frequently come up at important levels before support, a demand zone, when liquidity gets swept below a swing low. Sometimes it arises shortly after a phony breakdown that catches pushy salespeople.
A strong enveloping doesn’t beg for continuation. It forces it. There’s also a psychological component. When shorts see their entire earlier candle destroyed in one move, mistrust seeps in. Some close. Some flip. That adjustment in positioning fuels continuation if real demand is behind it.
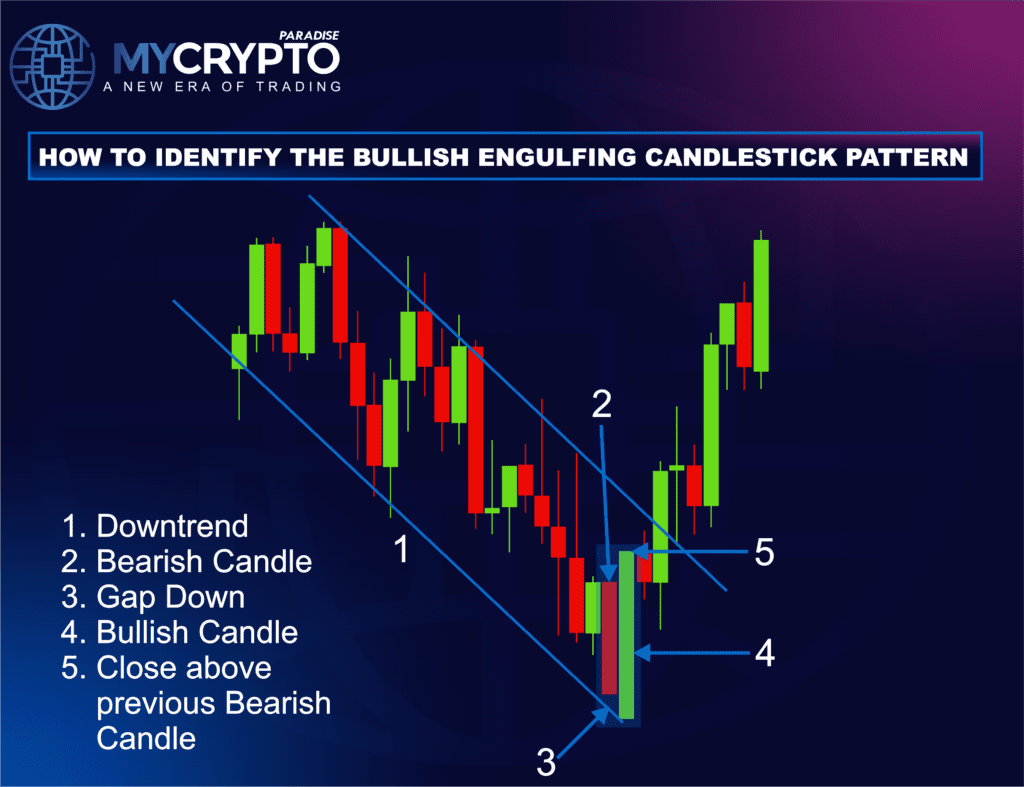
How to Identify the Bullish Engulfing Pattern?
To spot a legitimate Bullish Engulfing Pattern, you have to read the structure, grasp the context, and wait for confirmation. It’s not merely two candles on a chart. It’s two candles developing in the right spot, under the right market conditions. It’s two candles at the perfect position, under the correct conditions.
1. Existing Downward Pressure
The pattern should appear after a visible drop or corrective movement. Without antecedent bearish pressure, the engulfing loses its meaning. If the price has been chopping laterally and prints a random engulfing in the middle of a range, that’s noise.
2. First Candle: Bearish Body
The first candle should close red and demonstrate genuine selling pressure. Not a tiny doji. Not a sign that the market’s unsure which way it wants to go. A robust bearish body reflects short-term negative control. It reinforces that the market was turning gloomy. That makes the reversal more important when it happens.
3. Second Candle: Strong Bullish Reaction
The second candle opens at or slightly below the previous close and then pushes higher aggressively. It must close over the prior candle’s open, entirely enclosing the body. The size matters. A small bullish candle technically engulfing a tiny bearish candle isn’t spectacular. But a huge, impulsive candle that erases the earlier move demonstrates intent.
4. Body Engulfment Wicks are secondary.
The real body is the battlefield. The body tells you where the market opened and where it ultimately closed. That’s the real battleground, where buyers and sellers settled their fight for that session. When a strong bullish body completely overruns the previous bearish one, it’s a clear sign that control may have shifted hands in a meaningful way.
5. Volume Expansion
Volume is where the truth hides. If the bearish move into the pattern comes on dropping volume, that’s exhaustion. If the engulfing candle prints with a substantial jump in volume, that’s participation. A high-volume engulfing at support is significantly more dependable than a low-volume one at quiet hours.
Is the Bullish Engulfing Pattern Bullish or Bearish?
By definition, the pattern is bullish. That’s how it’s built. But whether it actually leads to a strong shift relies largely on the situation around it.
Bullish Reversal Within an Uptrend
Most of the time, the clearest setups happen during a downturn in an existing rally. Picture Bitcoin going higher on the daily chart. Price pulls back into a 4H support zone. Short-term sentiment turns slightly negative. Then a bullish engulfing candle appears on the 4H period, backed by rising volume.
That’s not random. That’s continuance. The higher-timeframe trend already favors buyers. The engulfing candle simply acts as the signal to resume momentum. These are the trades that feel organized and controlled: pullback, shift, growth.
Potential Major Trend Shift
Now, examine a different scenario. Price has been in a sustained slump and has struck a critical macro support level. A bullish engulfing candle forms. It tells you purchasers finally turned up with some determination and absorbed the quick sell pressure. It can imply that the bearish momentum is weakening and that early accumulation might be happening under the surface.
But let’s not get ahead of ourselves. One candle doesn’t flip a market that’s been distributing for months. A real trend change has to prove itself. You need to see structure rebuild higher highs, higher lows, and continuous demand that holds on pullbacks. Without that, it’s merely a reaction, not a definite reversal.
How Reliable Is the Bullish Engulfing Pattern?
Out of all two-candle patterns, the bullish engulfing is one of the most dependable ones when it’s traded in the appropriate context.
Statistical observations
On paper, these setups can work 60-75% of the time when they form at firm support and are backed by rising volume. But statistics alone don’t tell the full story. A good-looking pattern in the wrong area is nevertheless a lousy trade.
When Reliability Improves
The pattern tends to perform substantially better when:
- It arises at a clear demand zone
- Price sweeps liquidity before reversing
- The bullish candle closes around its peak
- Volume expands noticeably
- The higher timeframe trend favors the move
When numerous circumstances align, the engulfing candle becomes less of a guess and more of a structured indication.
When Reliability Drops
The pattern becomes significantly less predictable in settings like:
- Sideways, rough consolidation
- Strong macro downtrends
- Thin weekend liquidity
- Heavy resistance is sitting just overhead
Crypto markets are renowned for phony breakouts. An engulfing candle can look textbook-perfect and still fail rapidly if it runs straight into higher-timeframe supply.
How to Improve Your Odds
If the next candle maintains above the engulfing high and demonstrates strength, that adds confirmation. If momentum pauses instantly, that’s hesitation, and hesitation matters. Professional crypto trading isn’t about memorizing patterns. It’s about stacking probability in your favor and knowing the context behind every move.
How to Trade the Bullish Engulfing Pattern
Execution is what differentiates amateurs from professionals. You can spot the bullish pattern easily. However, trading it with discipline, structure, and good risk management is what delivers consistent success.
Entry Strategy
Close-Confirmation Entry
You need to enter the trade only after the engulfing candle has fully closed, never before. Intracandle strength can be deceiving. A candle may look powerful midway through formation, only to retrace and close weak. What matters is the close. The close confirms whether buyers genuinely retained control until the session’s end.
Break-of-High Entry
This technique waits for the price to break above the high of the engulfing candle before entering. The break confirms the move is continuing. It shows that buyers didn’t just absorb the available supply, they’re willing to step in again and drive price higher. That follow-through helps filter out the weaker reversals that tend to fade shortly after they appear.
Stop-Loss Placement
Stop-loss placement must be structural, not emotional.
Stops should be placed:
- Below the low of the engulfing candle or somewhat beneath the liquidity sweep that preceded the reversal
That low represents invalidation. If the price breaks below it, the bullish premise is false. Buyers failed to maintain control. There is no need to give the trade greater room beyond structural logic. If invalidation happens, the setup has changed. Accept it and move forward.
Take-Profit Targets
Targets should always be reasonable and pre-planned, not arbitrary.
Common profit objectives include:
- Previous resistance levels where selling previously occurred
- Recent swing highs
- Range highs in consolidation structures
- Measured motion estimates based on structure
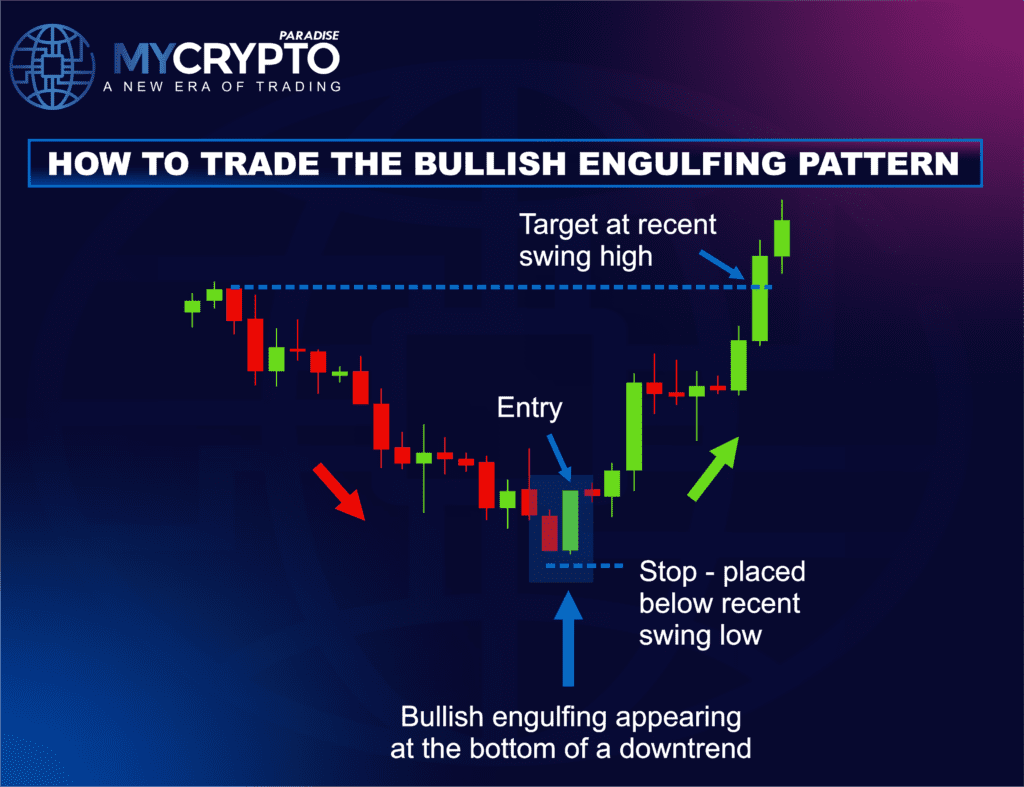
Each aim should make structural sense. If there is a big supply directly overhead, anticipating a sustained trend without confirmation becomes impractical. Professionals don’t aspire to be right every time. They try to ensure that when they are right, they are paid adequately for the risk taken. That’s the difference between pattern trading and expert execution.
Bullish Engulfing vs Similar Patterns
Understanding the variations between comparable candlestick formations sharpens execution. Many patterns look alike at first view, but the structural nuances directly alter probability. When capital is on the line, precision matters.
Bullish Engulfing vs Hammer
A hammer forms with a long lower wick and a tiny body near the top of the range. It shows rejection. Sellers pushed the price lower, but buyers stepped in and caused a comeback before the closing.
A bullish engulfing pattern goes further. The second candle doesn’t just reject lower prices; it utterly consumes the prior bearish body. That’s not hesitancy. That’s a takeover.
Bullish Engulfing vs Morning Star
The morning star is a strong reversal pattern. It reflects a diminishing pace and a phased move from sellers to buyers. The bullish engulfing pattern is more aggressive. It compresses that transition into two candles. There’s no pause, simply an abrupt shift in control.
In rapid crypto markets, speed matters. Engulfing patterns generally inspire earlier entry, whereas morning stars demand more time and confirmation.
Bullish Engulfing vs Piercing Line
The piercing line likewise consists of two candles. The second bullish candle manages to close above the midpoint of the prior bearish candle, but it doesn’t fully take it over. A real bullish engulfing, though, completely swallows the previous candle’s body and leaves no part of it untouched. It suggests a stronger psychological shift and a more decisive momentum change.
Bullish Engulfing vs Bullish Harami
The bullish harami is structurally the inverse of an engulfing. Bullish harami is a strong bearish candle that is followed by a smaller bullish candle that forms completely inside the prior candle’s body. The second candle stays enclosed. The harami imply and indications that selling pressure is diminishing, but buyers haven’t taken full control. It’s an early alert, not a confirmation.
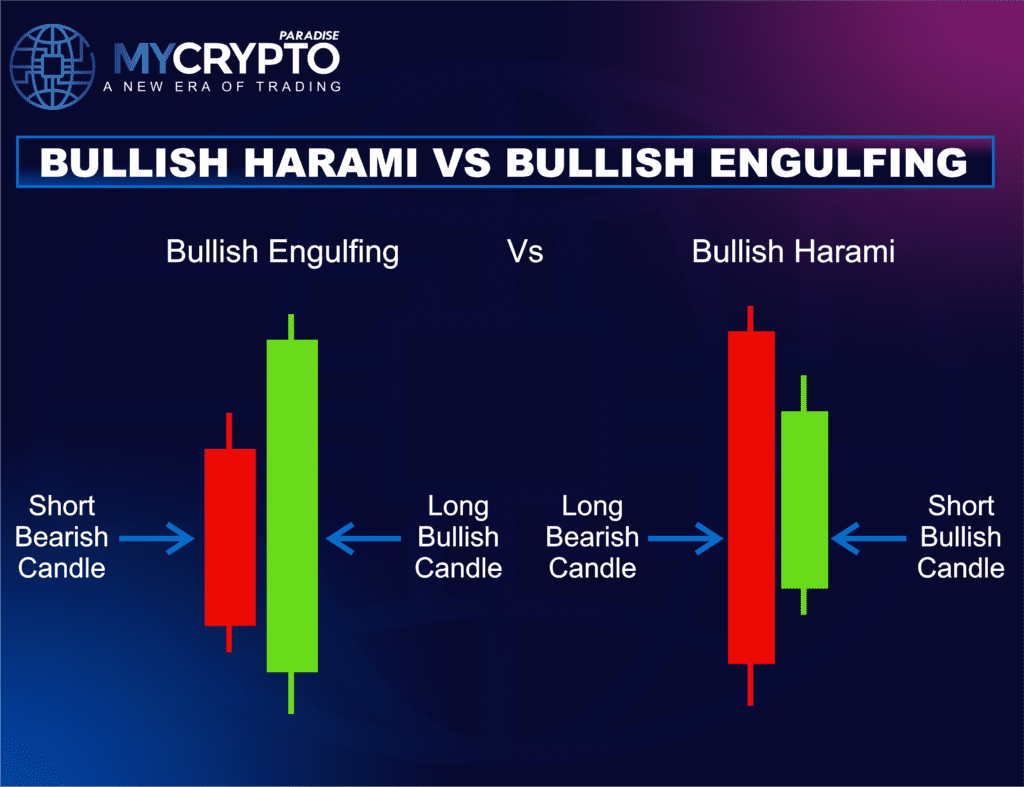
The bullish engulfing pattern shows expansion, not contraction. The second candle completely takes over the prior body, signaling that momentum may be shifting in a meaningful way.
Bullish Engulfing vs Bearish Engulfing
The structure is identical. The direction shifts. A bullish engulfing emerges after downward pressure. A bearish engulfing emerges after upward pressure. Both reflect a shift in control only in opposite directions.
- In a bullish engulfing, buyers absorb supply and reverse short-term bearish momentum.
- In a bearish engulfing, sellers overpower buyers and overturn short-term bullish momentum.
Conclusion
The Bullish Engulfing Pattern stands as one of the most acknowledged short-term reversal signs in crypto trading, but only when it’s understood beyond the surface. Buyers stepped in with enough strength to fully absorb that pressure and reverse it. That shift in velocity is what makes the pattern powerful.
At ParadiseFamilyVIP🎖️, we train crypto traders to mix real-time reversal structures with institutional-level risk frameworks. We focus on clarity, patience, and precision, not hype. Our goal is to assist traders in navigating volatility with structure rather than emotion.
👉 Join ParadiseFamilyVIP🎖️ today and start trading with precision and discipline. Position yourself properly and stay prepared for the next high-probability action.
Bullish engulfing pattern FAQ
What is a bullish engulfing pattern?
It is a two-candle formation where a red candle is followed by a larger green candle whose body fully engulfs the previous one. It signals that buyers have taken control after a short-term decline and momentum may be shifting higher.
Is a bullish engulfing pattern bullish or bearish?
By definition it is bullish, since the green candle reverses the prior selling. Whether it leads to a meaningful move depends on context such as the higher-timeframe trend, nearby support, and volume.
How reliable is the bullish engulfing pattern?
Observations suggest these setups can work roughly 60 to 75 percent of the time when they form at firm support with rising volume. Reliability drops in choppy ranges, strong downtrends, thin liquidity, or near heavy overhead resistance.
How do you confirm a bullish engulfing pattern before trading it?
Wait for the engulfing candle to fully close rather than reacting mid-candle, and check for a volume jump. A break above the engulfing candle's high adds further confirmation that buyers are continuing to step in.
Crypto trading involves substantial risk of loss. This article is educational and is not financial advice. Past performance does not guarantee future results. Always do your own research.
What is different here
Most guides stop at the theory. The MyCryptoParadise team shares the live trades, and the reasoning behind each one, inside ParadiseFamilyVIP. Everything here is education, not financial advice.
Crypto trading involves substantial risk and is not suitable for everyone. Nothing here is financial advice; it is education only. Never risk more than you can afford to lose.


Join the discussion
No comments yet. Pro Paradiser members, share how you are reading this.