


In short: Simon and the ParadiseTeam see Bitcoin pressing into a key support near $82,000 with retail turning fearful and shorts crowding in. He stays more bullish on the daily and 4-hour while that support holds, targeting $90,000 before any larger reversal. This he puts at roughly 70% probability.
Can Bitcoin bounce from support here?
Track it live: our Crypto Fear and Greed Index updates in real time, so you can watch this shift for yourself.
Yes, a bounce is the higher-probability outcome while support holds, according to Simon and the ParadiseTeam. Bitcoin is retesting a zone near $82,000 that flipped from resistance to support back in November 2025. The bulls broke above it on strong volume, and the retest is coming on declining volume.
Several confluences stack on this zone. There is a 0.786 Fibonacci retracement cluster, a VPVR shelf, and a moving average trend line near $82,000 that the price has not even touched. For how Simon frames entries around levels like these, see this guide to levels and sizing.
What do the whales and funding rates show?
Whales sold roughly 65% versus 35% buying over the past 24 hours, which looks bearish on the surface. But the ParadiseTeam reads it as healthy profit taking, not a fresh bet lower. Cumulative volume delta shows smart money reaccumulated heavily from around $83,000 and still holds most of those coins.
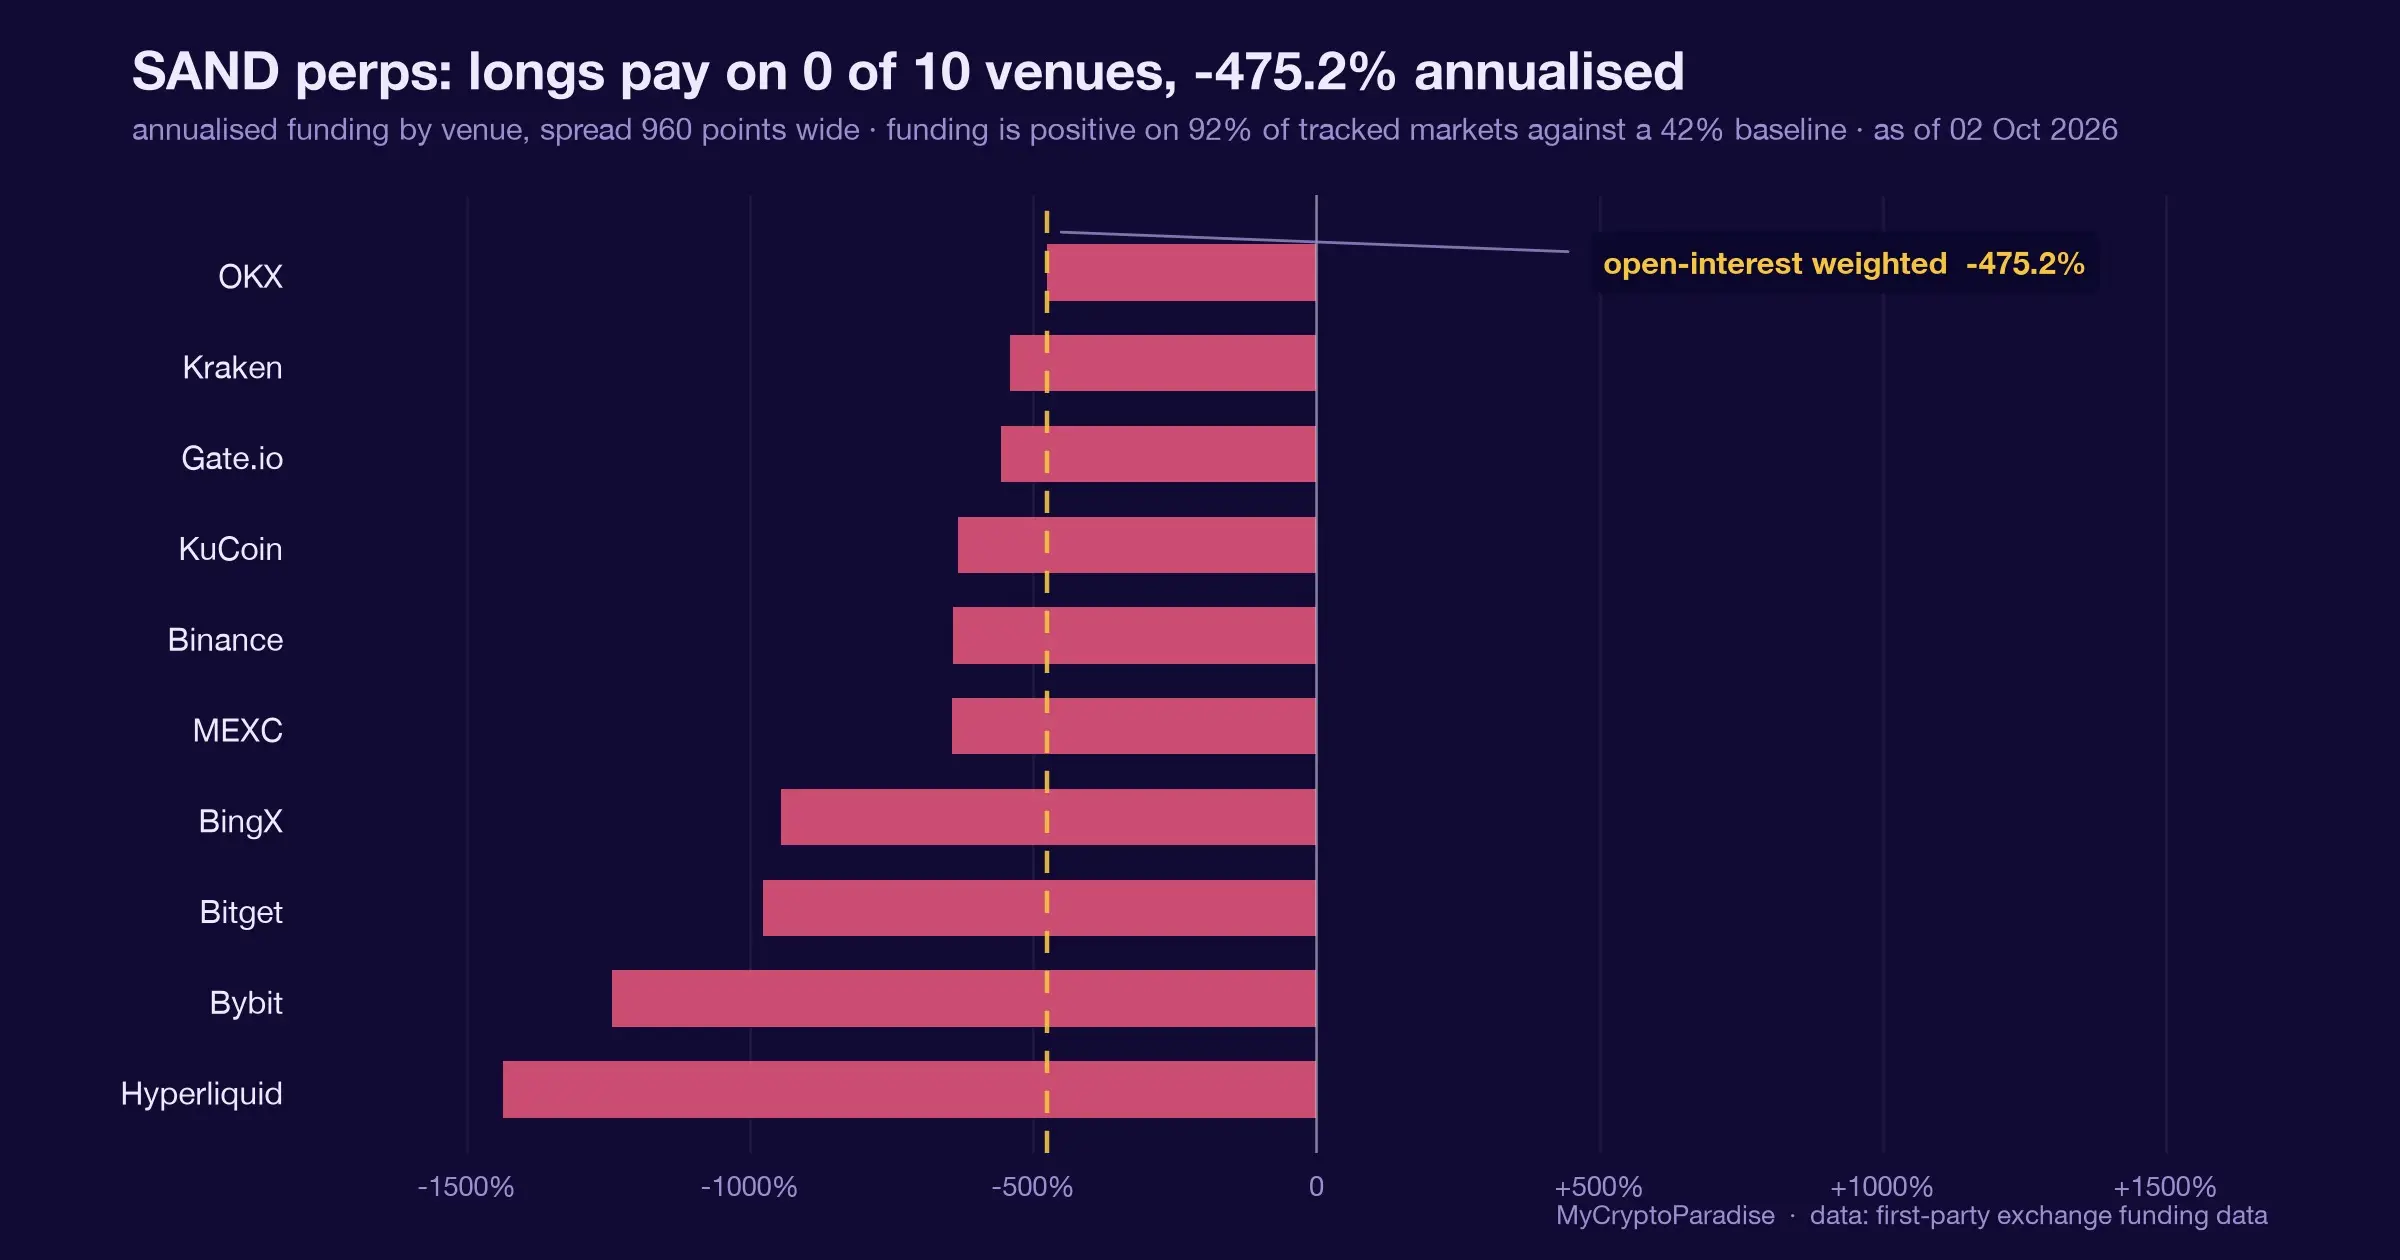
On the shorter time frames, funding has turned negative and shorts are getting crowded. Simon notes the short squeeze probability sits at 17%, not extreme, but rising into support. You can track the same positioning Simon reads on the live funding rates board.
What are the probabilities for the next move?
Simon lays out three weekly paths and keeps a medium-term lean toward higher prices first. He puts roughly 70% probability on Bitcoin pushing to at least $90,000 before a larger reversal. The weekly bias has stayed bearish since $121,000, so he still expects a bigger move down later.
- 60% probability: rejection near $88,000 to $90,000, pushing back toward the $55,000 to $44,000 zone.
- 30% probability: a reclaim of $88,000 that opens a run to $99,000 before reversing.
- 10% probability: a reclaim that attacks the prior high at $124,000 and extends toward $169,000.
Simon walks through this count across weekly, daily and 4-hour charts, building on his earlier breakdowns in the Bitcoin analysis hub.
Where does Simon flip bearish again?
Simon stays with bullish tactics while the immediate support at $83,500 to $84,000 holds. A drop below the secondary wave low near $83,000 would flip his 4-hour read, and he would then watch the next support at $80,000. He wants rejections to come as clean five-wave moves, not shallow corrections.
On the daily, his bearish signal is a reclaim of this support on rising volume, followed by a weak retest on declining volume. His most attractive short would sit at the $99,000 resistance, but that path carries only 30% probability for now.
Frequently asked questions
What is the key Bitcoin support level in this video?
Simon points to a zone near $82,000 on the daily chart, where resistance from earlier flipped to support in November 2025. It carries a 0.786 Fibonacci cluster, a VPVR shelf, and a moving average trend line. On the 4-hour, immediate support sits at $83,500 to $84,000.
Why are crowded shorts bullish here?
Simon explains that funding has turned negative and shorts are crowding in as retail turns fearful at support. The short squeeze probability sits at 17%. If price holds and nudges higher, closing shorts must buy back contracts, which can create a domino move upward. He notes shorting into support is rarely smart.
What price is Simon targeting next?
Simon puts roughly 70% probability on Bitcoin reaching at least $90,000 before a larger reversal. On the 4-hour, $90,000 is an important resistance. On the weekly, a 30% path sees a reclaim open a run to $99,000, where he would look for a high-quality short before the bigger move down.
When does the bullish view fail?
The bullish 4-hour structure fails if Bitcoin loses the immediate support at $83,500 to $84,000 and breaks below the $83,000 secondary wave low. Simon would then watch $80,000. On the daily, a reclaim of support on rising volume, with a weak retest, would push him back to bearish tactics.
MyCryptoParadise has run a professional crypto signals and trading-education service since 2016, led by founder Simon Mach and the ParadiseTeam. Simon records these sessions three times a week, and every episode lands on the Bitcoin video analysis hub.
Video transcript
Auto-captioned from the video audio and lightly cleaned, so it can contain transcription errors; the video itself is the record. It is speech, not a written article; for the structured breakdown read the sections above.
Bitcoin is pushing into support while [music] most people are starting to get fearful and for the first time in a while the probability of [music] a short squeeze is quite high. So does that mean that bulls can defend this support and push Bitcoin higher from here?
[music] Let's analyze the probabilities. [music and singing] Hello ladies and gentlemen. This is Son from my crypto paradise. Welcome back. It's great to be here. Today is Saturday and that means that you're watching the last video of this week. So previously we were looking together on 4hour time frame and we have understood that with the highest probability Bitcoin is having this sequence as a corrective mode wave structure in a bigger bull
trend and the next big move is going to be with the highest probability to the upside. So, so far we can see that we are nicely breaking out of this contracting triangle and Bitcoin indeed is trying to push towards that next major resistance $90,000.
But the bears are right now trying to push it back down. And we are having on this bearish pressure a lot of volume. And we can actually see that the whales in the past 24 hours are mostly selling. we have 65% selling versus 35% buying from the whales.
So this push to the downside we can naturally assume that is actually created by the smart money. However, however ladies gentlemen does it mean that Bitcoin cannot push higher? Let's analyze because there is always more things to put into a consideration before we can really assume with a high probability what's going to happen next.
Right? So we need to take a look at the big picture. So first of all let's take a look again on the weekly time frame. Here we will spend only a little time because in the previous videos we went deeply into why weekly time frame is bearish and why since $121,000 I'm still basically staying bearish and focusing on this exchange of the hand zone of 55 and $44,000.
That's the upper boundary and $44,000 that's the lower boundary. and why what we are doing right now doesn't seem like uh basically a new start of a boot trend that will push us towards $169,000. Why I don't believe that this is actually the macro bottom and why do I believe actually that we might have another push lower.
Right? So we have explained that in the previous videos. Let me right now just remind you the probabilities of the next move. So with the high probability there is 60% probability that Bitcoin will start getting rejected at already that $88,000 that we have touched to around $90,000.
We will see a rejection that will push us towards this zone exchange of the hand zone 55 to $44,000. So that's 60% probability. The 30% probability is that Bitcoin will be able to reclaim that $880,000 zone and we will be able to push towards the next important resistance that is sitting at $99,000 and then we will see a reversal to the downside.
All right, this might be the case if the final fifth wave of that high degree C wave and the ultra high time frame fourth wave is going to be an extended one. It's only 30% probability. All right. And 10% probability is that we will reclaim this resistance, turn it into support, and we will be able to continue attacking the previous high at $124,000 and continue in a price discover rally that will
finish at $169,000 with the highest probability. So this is just 10% and for the market makers is right now it's not profitable to do it this way. We have explained why in the previous videos. So this is just a quick recapitulation. Let's take a look on the lower time frame.
Let's zoom in into the daily daily time frame because on the daily time frame we are actually calculating we are counting the waves of the expanded flat right pattern. So we understand that with the highest probability we are right now in a higher degree expanded flat right.
So this was an Awave on the weekly time frame, Bwave and right now we are in a C-wave, right? So the Cwave is a multi-wave structure that means it sat itself into five small waves. So on the daily time frame and on the smaller time frames, what we are focusing on right now is calculating the subwaves of the final fifth wave structure.
Okay, we understand that we might create a five waves to the upside and it might be the final fifth wave, right? However, we also understand that the fifth wave might be an extension. So those five waves might be actually just the first wave of a hard degree in pools.
Then we will have a secondary wave. Then third wave, fourth wave and fifth wave that will take us towards that $99,000. Right? So there is extremely important to watch how the price action is not only reacting and trending to the upside but also how it's going to trend to the downside.
Right? So once we start getting rejected all right it's very important that we going to get rejected in a fashion of a motive wave structure that means five subwaves if however we will start getting rejected and start pushing down in a three-wave structure or variations of thereof we understand that it's just a corrective mode wave structure and the next big move is actually going to push us to in in the opposite
direction right because we understand that if we will be creating a correct Ive mode wave structure is just a correction of a hard degree impulse or an ending diagonal given that we are in the hard degree fifth wave which will increase the probability that we will be able to reclaim in the next push.
All right. So one two in the next push above this 88 to $90,000 resistance zone and that we will be able to push as high as $99,000. Right? So from 30% probability of this move once we start getting some more confirmations for example that the push back is actually a corrective wave structure well it might probably increase to around 60% right so and we will be focusing on creating long setups if
you are in PR 7 VIP you will know about that because we are sharing with the par team with you our personal trade setups with clear entry and exit targets so it's extremely important to watch live the price action that is why with paral team.
We are monitoring the market 24/7 for you and let's right now take a look what's happening on the daily time frame. Are we bullish or bearish on the daily time frame? Let's quickly calculate the probabilities because now it's very important to turn this zone that previously acted as a resistance and then back in November 2025 as a support.
So it's not only the Fibonacci retracement confluence zone of many Fibonacci retracement levels from multiple time frames only one you see right here 0.786 but in the previous videos we were analyzing how much confluences we are actually have here then we also see VPVR right here but also is this historical it's so important historic price action level right so then it was working right here as a resistance then right here and
And we have broken it with nice volume above the moving average volume trend line. And right now we are retesting it with decline in volume. All right. So we can see that as we were broken to the upside the bulls were strong. And as we are retesting it right the bears are not as strong as the bulls were on breakout of this previous resistance which is which is increasing the probability at
this moment that this zone is going to be turned into a support. We can also see a confluence of this moving average trend line. Previously, it worked perfectly as a support and so far we can see that it's working very nicely as a support because the price is even scared to touch it.
The bulls are so aggressive at this level of defending the moving average trend line around that $82,000 that the price has not been even able to touch that line. All right, that moving average trend line. So this is acting very well and it's another conference that is supporting this zone and right now it's increasing the probability that this will be acting as a support and we will be able to push much
higher. However, we need to also take a look at the momentum. So we clearly can see that the bulls are losing steam at this moment. Right? So the context however is important. So they are losing steam indeed. But are they losing steam during a motive wave structure or just during a correction in a larger bull trend?
And because we understand the lower degree price action, we understand that they are actually losing steam during a corrective mode wave structure because that was the fourth wave, right? So it's actually healthy. It's actually healthy to lose a little bit of steam to basically get a little bit of rest before you can again start pushing, right?
So when you are doing push-ups for example, you do 30 50 and then you need to slow down a little bit, right? You slow down, you pick up your strength and then you go for it again. So that's something what's healthy. All right.
What is unhealthy, however, is that you you do like 10 push-ups and then you start slowing down already during the moment where you should go for it. Right? So during your moment where you should go for it, where you should be extremely active, when you start to slow down, you will start to realize all right something is actually bad with my body.
So it's unhealthy, right? When you start to slow down when you should not be slowing down, something is wrong. But at this time this slowdown of momentum is actually healthy because you understand that during the corrective wave structures during the fourth waves the slowdown is actually needed and it's healthy before the bulls can pick up the strength during the next push to the upside in the previous direction which was bullish.
All right. So okay, we do have a bearish divergence also on the RSI on the daily time frame on our MCP RSI intelligence. We can see one out of five bearish points on this indicator. So it's not it's not that crucial at this moment.
And since we understand the context, we also understand that this slowdown is actually healthy. Stoastic RSI bears right now it's telling us that the bears during this corrective wave structure are in control. But as we can see they are already going into an oversold area and they were not able to do much right.
So somebody has been actually absorbing that selling pressure. That's what we were talking about in the previous video. So daily time frame for me it's more bullish than bearish until we can reclaim all of those confluences that are right now working as a support.
Yeah. So if I will see a break to the downside with increasement of volume which we don't see at this moment we can see some bearish increasement of volume. However the price is not even able as I have said to properly touch that moving average trend line.
Right? So once we start seeing however an increasement of volume and the price action will follow and then we will basically turn this from this neutral zone into a resistance again. So I want to see increasement volume on the breakdown and then decline in volume on the retest.
That will tell me okay the bulls are extremely weak right now. They are not able to take over this zone and the bears will be able to attack and push the price lower. All right. So if we will see this kind of reclaim I will be again playing with bearish trading tactics on the daily time frame.
end this time on the daily time frame. I'm waiting for better trading opportunities for me to take some nice high probability and great riskreward uh swing plus short position which might be at this key high time frame resistance zone if we get there which is going to be the $99,000 however which is only 30% probability as we have established on the weekly time frame but more interested I will be if we
will be getting close to this zone and we will touch that $90,000 which takes me to the 4hour time frame because on the 4hour time frame the $90,000 is actually a very important resistance already. Okay. So now the 4hour time frame are we still bullish?
Let's take a look at the price action. But first let's also take a look what the whales are doing versus what the crowd is doing right now. So we can see and this should be bearish, right? So whales are whales are mostly selling.
Well, we need to understand the context. However, we need to take a look at the cumulative volume delta right here. But it's going to be better visible right here. And now by looking at the cumulative volume delta, we can understand that because I have set it up only for spot.
So this is also by the way one of the indicators we will be given to prop parasers very soon. We just need to finalize the injection with AI the same way we have done it with the MCP RSI smart indicator. And this is going to be really cool.
So we will also have the probability points right here. We are just finalizing the code. The coding is not that easy. So we we also want to make sure that it's working flawlessly. So we take a lot of time with that. But we will release it quite soon to proar racers.
So if you are a pro parraer, you will get this indicator very soon as well. So right now what we can analyze on the cumulative volume delta on the spot is basically what the smart money are doing. All right. So what supported the bias that this is just a corrective wave structure was that the smart money they actually reaccumulated right?
So the cumulative volume delta created divergence with the price action. So the price action was creating lower lows but the cumulative volume delta higher lows and higher highs. Right? So we understood that this price action is mostly being driven by the dump in the leverage.
There was deleveraging event. We have been watching the open interest for that. Right? So the open interest went heavily down. So there was long profits taken. That's what pushed the price down which is again not healthy. Right? If this would be a start of a bare trend, right?
If this would be a start of the bare trend, you would see a cumulative volume delta supporting that and open interest supporting that as well. But cumulative volume delta was not supporting that. Actually we have seen that the smart money were accumulating when the price action was trending to the downside.
So there was the absorption of that selling pressure that we were speaking about what also created the bullish divergences and the open interest didn't support it as well. we've actually seen a huge dump of leverage and that was the profit taken from the previous long positions and again when you when you close a long position when you close a long position basically you need to sell the contracts back and that pushed
the price lower as well okay so there was this kind of forced selling I would say nobody wanted to sell there was this kind of forced selling from liquidations and closing of the long positions and the smart money were absorbing that selling pressure yeah we have seen that on Konote volume delta then we have seen a little bit of dump right here during this price decline but then you can see that
they have picked it up again right so the whales bought it during this boot trend back and I have told you like I would be only scared because we have seen that they have started to reaccumulate heavily from here from around $83,000 and it would be it would be very unprofitable for them if all of them would be selling right here so I've told you I would start treating this this market
on the medium time frame with some bearish trading tactics only when the cumulative volume data would go back to the baseline back to the break even point that would tell me all of the whales that reaccumulated right here they've already closed their position at break even but it didn't happen right and it was this kind of shakeoff only because you can see that then they have bought everything back up that was
the higher probability that we went through in the previous video and that's also why I've put around 70% probability that we will see a breakout above this contracting triangle and we will start trading then higher from $84,000 and that's what also happened. We have then seen that the whales came back aggressively.
All right. And this volume was very healthy. The breakout from that contracting triangle was very healthy and right now what we can see is just a healthy profit taken of the whales. So this okay we can see smart money dumped it but take a look at this.
They have not dumped nearly what they have reaccumulated. All right. So right here. So you can see they are right here. There is long way to to dump everything they have started to reaccumulate during this price action trade outside. So again I will be only start looking for some bearish trading tactics once I see that the whales aka the smart money are already out of their positions.
Okay. So we are not there just yet. So yes, we see whales and smart money. Most of the whales are smart money but not all of them also. That's also why we are watching all of those whales and we know exactly how much they are in profit, how much they are in loss.
Also, if you are a pro paraser, we have this kind of weekly board so you know exactly which whale is profitable or not. So it's very important when you are watching individual whales, right? when you are tracking individual whales that you are tracking only the profitable ones but not the ones that are profitable in the past 30 days but the ones that are act at least profitable like at least one or
two years right these are the whales that actually you should be following right so if you're tracking individual whales you need to track the one that has some historic good results because we understand that if somebody is profitable for a few months 6 months also a year can they can just be lucky, right?
The biggest misconception in the crypto and in trading in in general is that you can make money even without a proper strategy, right? You can make money long-term without a proper strategy because you can make money in crypto very easily, right? Because you can get lucky, but then keep the money.
That's the hard thing, right? being profitable long-term over at least the 3ear cycle. That's where most of the people fail. That's where most of the traders fail. And that's also why 99% of traders they lose everything within 3 years. So you can see like most of the people can be profitable for a few months.
They can they can be profitable even for a year but then really maintain your profits over the big cycles. That's where is the difference between a real professional traders and the traders that are just having it as a hobby right so when you are tracking individual whales you need to watch the whales that have a positive track record at least two years and then when you are watching so that's one way
of how to watch whales and then the correct way how to watch whales the useful way also as a pack as a group so then we can see what the group was doing in the last 24 hours, 3 days, 7 days, 30 days, etc.
90 days and basically that also gives you a nice understandment like okay most of the whales are made out of smart money they are doing this thing and then versus what the retail is doing that's why we are watching the fear and greet index on our website my crypto paradise.com you can again see like what most of the retail is doing right and that tells you again something so most of the
most of the basically basic traders they are working with borrowed money with a lot of leverage and when they are leaning one side is probably not really smart, right? So then we can spot these kind of divergences between the crowds and the whales, right?
And we can at this moment see that the whales are selling indeed. But we can see that in the past basically in the past 147 days they've been pretty much accumulating, right? So even though they are heavily selling today we can assume they are just taking profit and because we can see we can see the bigger picture and also on the cumulative volume delta we can see that they still hold the
bitcoins they have been accumulating over the past 7 to 14 days right so they are selling yes but this might be just a profit taking the same way as if we are taking profits on our position right so we have target one target two target three, uh, target four, we don't have more targets than only four.
So, we just take profit on target one, for example. So, at this moment, this seems to be healthy. This doesn't seem like a new fresh bet on the market to start trending lower. All right? So, this is looking just as a profit taking, not as a bet that the market will start to trend lower.
And the context to understand this is very important, right? So it doesn't mean that bitcoin cannot crash right now but as a professional traders we are just focusing on probabilities right so the probability right now is that and this is just a profit taken so ladies gentlemen let's take a look right now also on the fear and greed index and we can see that most of the people are in a fear
mode at this moment on the on the 1 hour time frame time frames are also important right let's take a look right now on the 1 hour time frame they are mostly fearful. We are actually going from the number 20 and that means that most of the people are selling most of the retail is selling and we can actually spot that and confirm that also on the funding crates.
So we can see most of the funding crates right now and really in a long time you have not seen such a cold numbers right in few months right during the summer we have not seen anything like this. So the funding crates are getting kind of negative, right?
So the shorts are getting crowded. All right, the shorts are getting crowded and that's creating short squeeze probability. It's not extreme at this moment. It's 17% but shorts are crowded. And when you understand the context that we are at the support, what we can assume is that the whales some of the whales are taking profits and a lot of people are actually shorting.
Okay. into a support but the price action is not moving lower. Right? There's a lot of sell pressure at this moment but the price action is not moving lower. So somebody is actually absorbing with bits right this selling pressure and uh we can assume that this is really from Wales perspective just a healthy profit taken but they still hold most of their positions in anticipation of higher prices and the retail however
is betting on lower prices. So shorts are being crowded and that might create this kind of domino effect that will help to push the price higher, right? So you shouldn't be shorting at support. You should be shorting at confirmation at resistance and after a support breakdown and retest into resistance that short position, right?
But right now at support shortening, not usually a smart idea to do so. So we can see people are fearful at a support. Okay, whales are not fearful. They are just taking profits. So they have pushed helped to push the price down that scared the retail and right now the retail is shortening into support.
So this might not be even a profit taken. It might be just this kind of manipulation of trying to scare retail and retail right now thanks to that is acting on that and we can see that on the funding crates and confirm that on that sentiment retail is right now scared starting to short and that's that might be something what the whales and the smart money actually want to scare the people
get them into a short position that will make the shorts crowded they will have their liquidations higher and their stop losses once the Smart money push the price a little bit higher. It will trigger this liquidation. Once you close a short position, you need to buy the contracts back.
That push pushes the price higher towards the next liquidation cluster and we can create this kind of domino effect. Right? So at this moment, as long as we are holding this support, ladies and gentlemen, I'm actually more bullish on the 4hour time frame, the price action also supports the bullishness.
Okay. So as you can see right here we have not yet it doesn't seems like we have finished the final fifth wave motive wave structure that subdivide itself into five small waves. Right. So at this time we can see we have created one two.
All right. And it seems like the third wave will be an extended one because within this hard degree third wave we can see a clear one two third wave that finished right here with the last probability. Right now we are doing fourth wave and as long as we hold this support and we don't go below the previous low of that secondary wave which is sitting at $83,000 I am bullish.
All right and we are in a bullish structure. If we will start reclaiming this support I will start looking for the next important support which will be at $80,000. But until then the structure on the 4hour time frame is bullish. So there's much higher probability that right now we are creating fourth wave that might be over the weekend a contracting triangle.
Then we will push higher that will conclude the third wave. Then we will create hardcore fourth wave. This one we will take later in the next video where that might be a support for that fourth wave if we will push higher and then the final fifth wave might indeed push us towards that $90,000.
So I'm still bullish. I still believe that $90,000 is going to come with a higher probably the before the larger reversal. However, if you'll start losing this support, the immediate support at around $83,500 to $84,000, I will start looking for some bearish trading tactics probably.
But until then, I'm still looking and playing with bullish trading tactics personally. And I'm focusing on that $90,000 level before a larger reverse, ladies, gentlemen. Yeah. To the downside. So at this moment in my opinion like I've been calculating it for myself there is like 70 still like 70% probability that we will push at least to 90,000 before we will see a bigger reversal.
All right so I'm still bullish on the medium time frame and I will keep you updated again in the next video on Tuesday. So until then enjoy the rest of your weekend. Take care, trade safe and I will see you on Tuesday. Cheers.
[music] Calm breath, clear eyes. Work done now. Right. No rush, no drag. [music] Right time, full snap. Clean set up. Clean click. [music] Execute like a pro. That's it. M clean set
Educational content, not financial advice. Crypto trading carries substantial risk; you can lose your capital. Past performance does not guarantee future results.











Join the discussion
No comments yet. Members, share how you are reading this.