

In short
A Bitcoin exchange-traded fund (ETF) net flow is the daily balance of money entering or leaving these funds, and a flow grade is our attempt to score whether that tide is building or fading. The source feed reports BlackRock clients sold $9.5 million of Bitcoin on 30 September 2026, part of a $148.7 million net outflow across the funds. Our own MCP Insights data runs through 29 September, where a nine-day inflow streak still stands and the five-day net reads plus $769.4 million. We call this neutral, explicitly not a reversal: our tide grade sits frozen at 53 of 100, unchanged on the day, and it is a model estimate that has not cleared its calibration gate. One outflow day we cannot verify does not move a coin flip. This piece shows you how to read ETF flows yourself, grade and all.
Key facts
- Latest session net flow
- $66.2M
- Net flow over the last five sessions
- $769.4M
- Cumulative net flow since January 2024
- $57.71B
- What would prove this read wrong
- Three straight verified outflow days dragging the five-day net from plus $769.4 million toward negative, which would turn the tide grade from inflow toward outflow and end the nine-day streak for real.
- Reading taken
- 29 September 2026
- Source
- Our MCP Insights tools, from Farside Investors and SoSoValue. Upstream data published by Farside Investors
A fund flow is a balance, not a verdict
A Bitcoin exchange-traded fund, or ETF, is a listed wrapper that holds coins on behalf of investors who want the exposure without holding the keys themselves. Its net flow is the daily difference between the money entering those funds and the money leaving them, summed across every issuer in the market.
A single issuer selling on a single day is just one line in that balance. It can be outweighed by another issuer buying, by the trailing week of demand, or simply by the enormous size already parked inside the funds over the prior two years.
A flow read one day at a time is mostly noise. The tide beneath it turns slowly, and a gauge worth trusting is the one built to ignore the daily chop and measure that slower tide instead.
The reported outflow lands on an unmoved grade
The source feed reports that BlackRock clients sold $9.5 million of Bitcoin on 30 September 2026, one part of a $148.7 million net outflow across all the funds that day. Our own MCP Insights data runs a session behind, closing on 29 September, so we cannot yet verify that outflow directly.
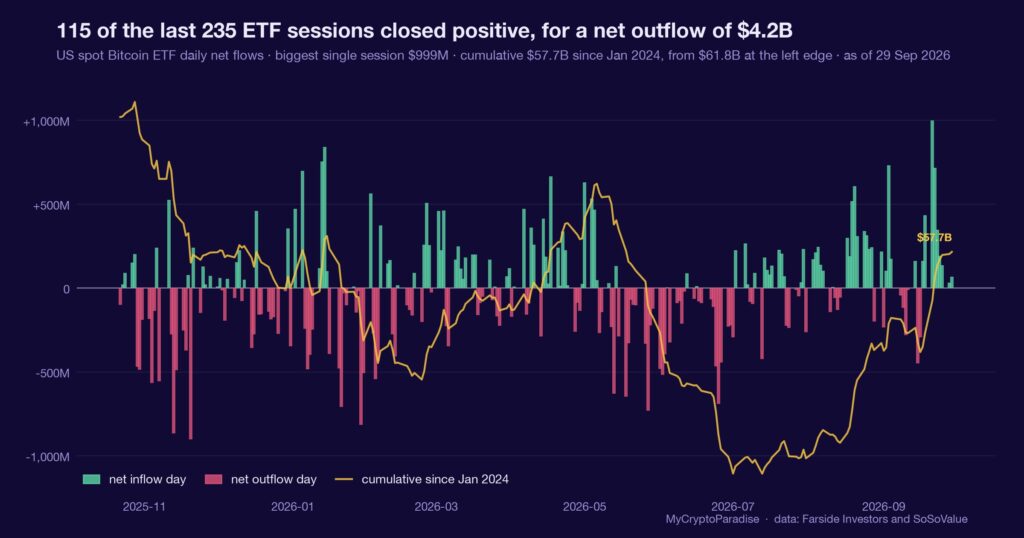
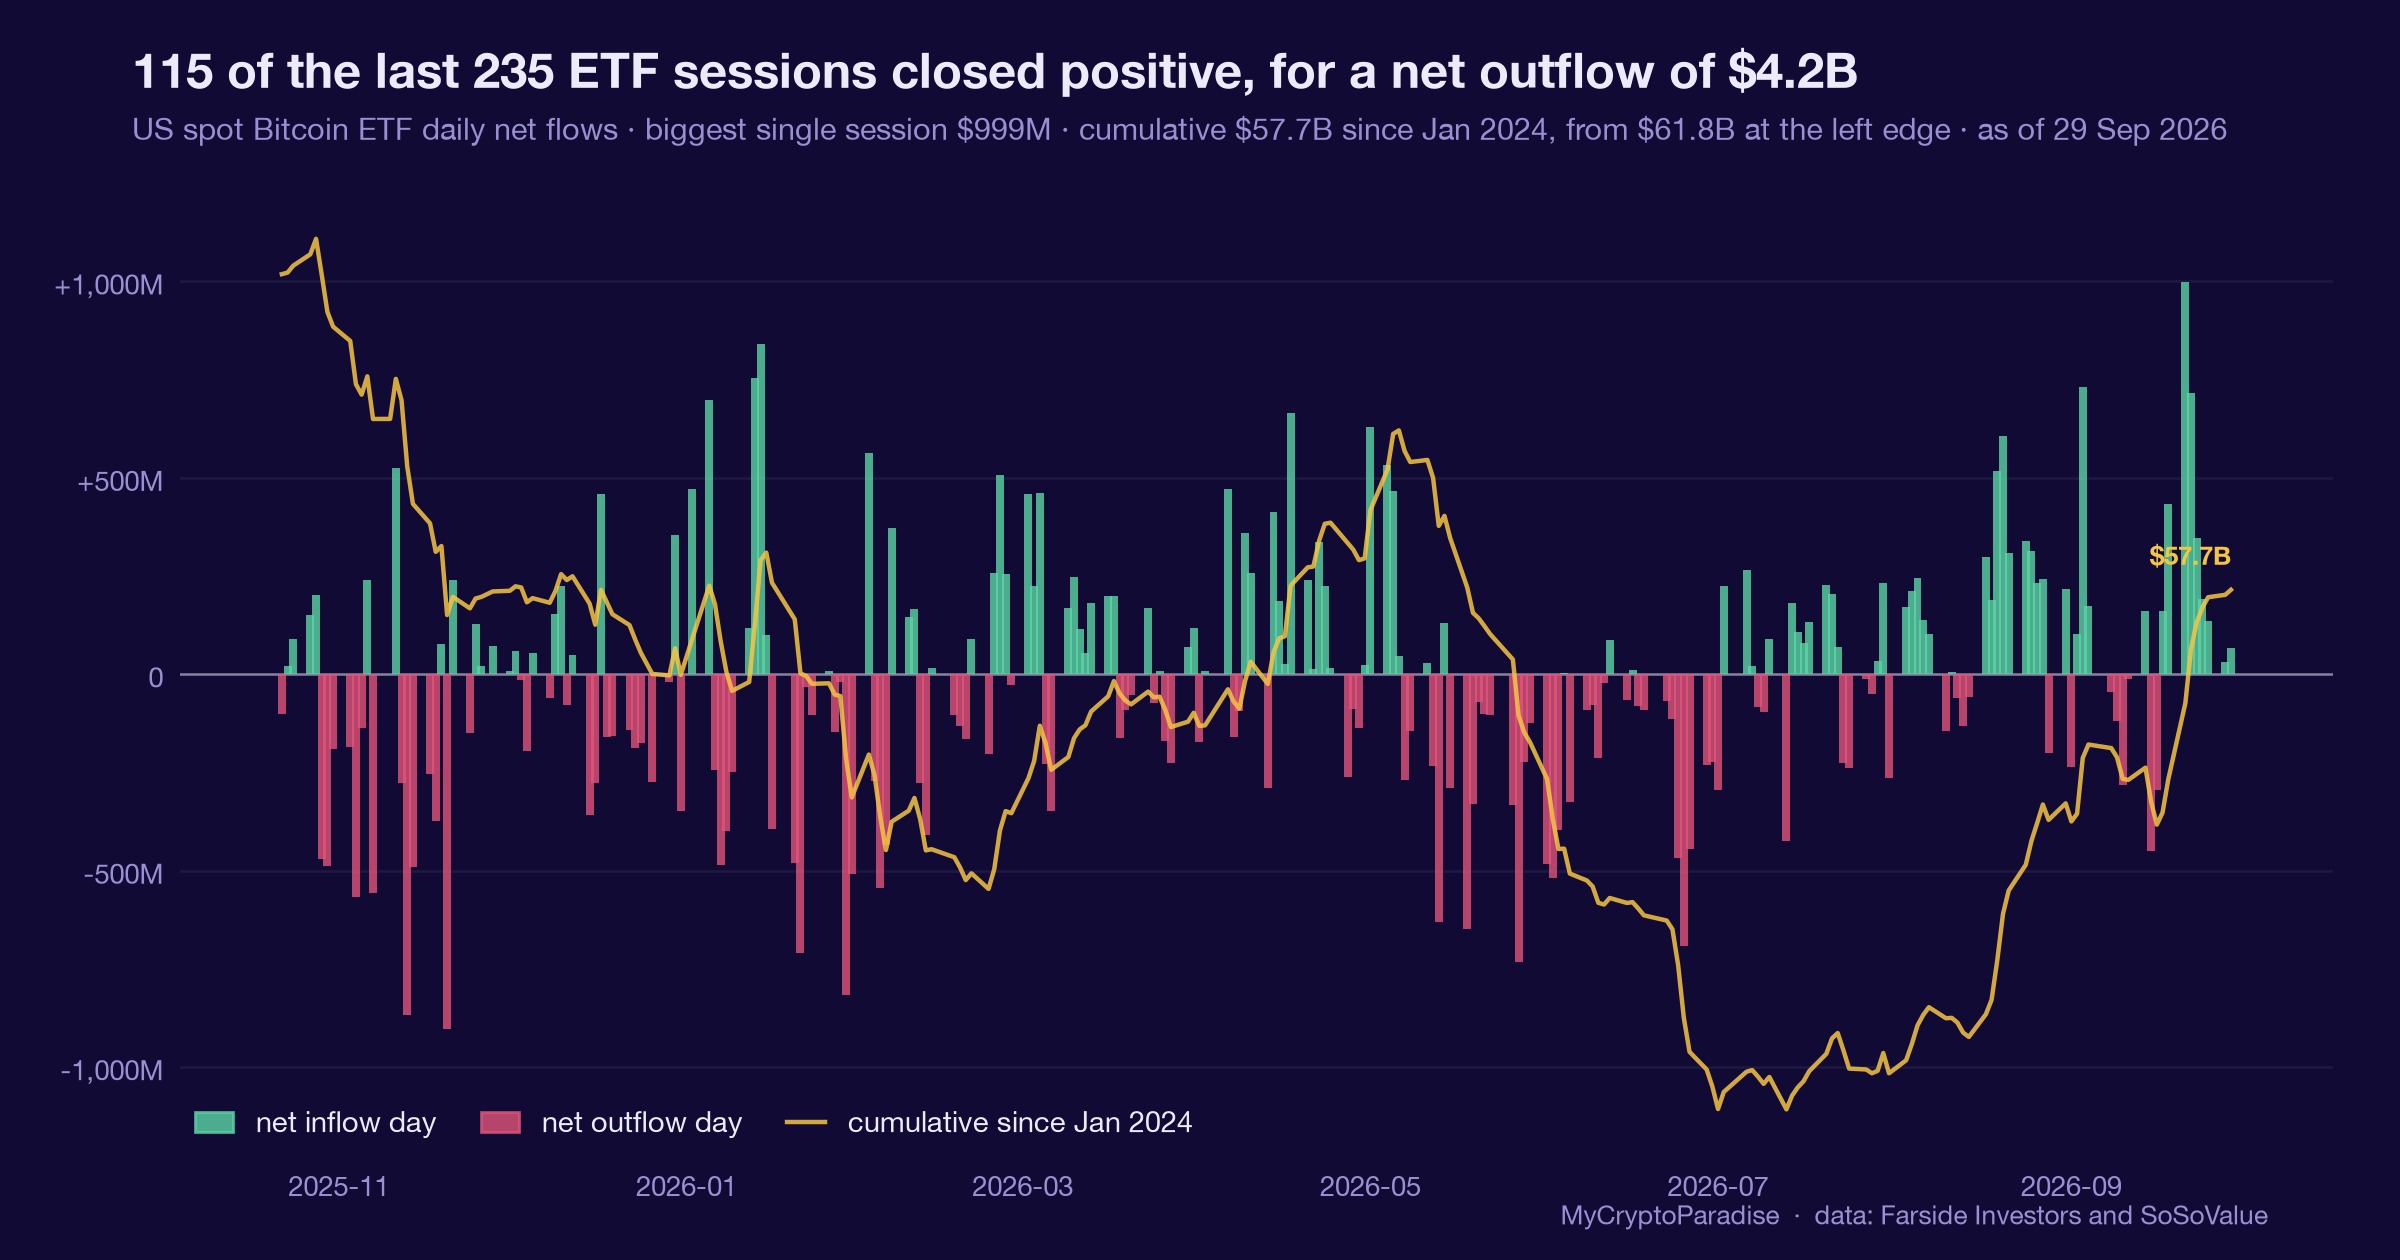
Per our MCP Insights ETF-tide data, 29 September capped a nine-day inflow streak. The five-day net flow reads plus $769.4 million, the latest session added $66.2 million on its own, and cumulative fund holdings now sit near $57.7 billion.
The tide grade prints 53 out of 100, unchanged from the prior reading and sitting inside a wide 17-point band. Its inflow impulse ranks at the 79th percentile, even as spot price slipped 0.57 percent across those same five sessions.
A single reported outflow of $148.7 million is real money leaving. Measured against a $57.7 billion book and a plus $769.4 million week, it is a ripple on a pond. A grade that refuses to lurch on a ripple is doing exactly its job.
What is different here
The ParadiseTeam does not react to a single headline outflow. We score the whole tide: a momentum grade built from hundreds of sessions, carried with its error band and effective sample. When that grade does not move on a reported outflow day, we read the day as noise, not a turn.
The obvious misread is to call this a turn
The tempting move is to see a BlackRock sale, read a red headline, and flip bearish on the spot. That reading mistakes one day for a trend, and it mistakes the single largest issuer for the entire market behind it.
Flows and price have been quietly disagreeing. Money kept arriving across the prior nine sessions while spot drifted 0.57 percent lower, a pattern where the funds absorb supply even as price softens. That gap is an observation about demand meeting selling, not a direction to trade.
This is one input, nothing more. It sits alongside funding, open interest and spot absorption inside PRO Paradiser, and on its own a flow grade is a probability weight on a bias, never the bias itself.
What the grade admits it cannot yet promise
Honesty about the gauge matters more than the gauge reading. Our tide grade is a model estimate that has not cleared its calibration gate, which is why we quote it as an estimate and never dress it up as a settled historical probability.
The up-rate behind the grade, an estimated 51 percent across just 22 effective windows since April 2024, is barely better than a coin flip, and it rests on a thin sample. Twenty-two windows is not a base rate. It is a direction of travel carrying a wide error bar.
So we lean neutral and patient. A number with no error bar is decoration, and a gauge that openly admits its sample is thin is more useful than one that always finds a signal.
The behaviour to watch from here
What happens next is a data question, not a prediction. If the reported 30 September outflow is a one-off, our 29 September data will simply extend: the streak resumes and the grade stays near 53 as fresh sessions print.
If instead the outflow is the start of something, it shows up as consecutive red days dragging the five-day net down from plus $769.4 million toward zero and then negative. That is the moment the tide grade would begin to turn, and the moment the neutral read earns a revision.
Until the data says so, no single headline rewrites the tide. We publish the reading, we publish the level that would break it, and we wait for the sessions to grade the call.
Reading Bitcoin ETF flows yourself, step by step
- Start with the trailing week, not the single day: pull the five-day net flow before you react to any one red or green session.
- Weigh today’s flow against the cumulative size already held, so a large-sounding outflow is scaled against what the funds actually own.
- Separate the largest issuer from the market total, since one fund selling can hide several others quietly buying the same day.
- Check whether flows and price agree or diverge, because money arriving while price falls is absorption, not weakness confirmed.
- Read the grade with its band and sample size, and treat any estimate that has not cleared its gate as a lean, not a law.
The step most people skip is the sample size. A 51 percent up-rate across 22 windows feels like a probability, but a thin, uncalibrated estimate is only a lean.
Every number above is checkable against the live data. Start with the Bitcoin ETF flow tracker, then cross-read the MCP Insights hub and the Crypto Fear and Greed Index.
Act and invalidate
| Scenario | What confirms it | What kills it |
|---|---|---|
| Outflow is one-day noise | Streak resumes, grade holds 53 | Three straight outflow days |
| Tide is quietly turning | Five-day net rolls negative | Impulse stays above 70th percentile |
| No edge either way | Grade stuck near 53 | Band narrows on fresh sample |
Posture: stays defensive-neutral: no new risk on an unverified outflow, and no fresh positioning into a nine-day inflow streak. Let the grade and the five-day net confirm a turn before acting on one reported red day.
Frequently asked questions
Did BlackRock selling cause the ETF outflow?
BlackRock clients sold $9.5 million on 30 September, a small slice of the $148.7 million net outflow reported that day. The rest came from other funds and sellers. One issuer rarely drives a whole-market flow, and here it did not.
Does one outflow day end the inflow trend?
Not on its own. Our data through 29 September still shows a nine-day inflow streak and a plus $769.4 million five-day net. A single reported red day dents that only slightly, so we treat one session as noise until a pattern forms.
Why do you call the flow grade an estimate?
Because it has not cleared its calibration gate. The grade of 53 rests on an estimated 51 percent up-rate across just 22 effective windows since April 2024. That is a thin sample, so we quote it as a lean, never as a settled probability.
What does an absorption divergence actually mean?
It means money kept entering the funds while price fell, here 0.57 percent over five sessions against a positive flow week. That gap says demand is meeting supply at these levels. It is an observation about flow, not a forecast about price.
What would change this neutral read?
Three straight verified outflow days dragging the five-day net negative would shift the tide from inflow toward outflow. A resumed streak with the grade holding above 53 would firm the constructive case. Until then, the highest-probability posture is patience.
Crypto trading involves substantial risk and is not suitable for everyone. Nothing here is financial advice; it is education only. Never risk more than you can afford to lose.
The private Extras feed, where the ETF tide grade, five-day net flow and absorption divergence update with their invalidation levels attached, is part of PRO Paradiser, the intelligence layer behind the ParadiseFamilyVIP strategies.














Join the discussion 9
It is good to see the 53 grade confirmed. I remember similar discussions on Japanese forums in 2013, when it was all still very new.
A single day's flow grade remaining constant after those exits is less about the grade holding, and more about the parameters for its calculation.
true, it’s also about what kind of money left... retail exits often hit different than the big fish selling.
that 53 grade holding constant only means the process wasnt followed in the first place. it needs a defined stop.
I'm still a bit confused how the grade holds with so much selling, like Olivia said. I worry maybe I rely on the fund flow grades too much, I should look at the details more! Sorry.
I was also wondering about the 53 grade... for me the smaller outflows often make me rethink my stablecoin holdings... just to be safe.
it's the liquidity drains that always capture my attention, taking me back to '13. that 53 grade holds only if the overall crowd positioning is net long enough to absorb this.
The '13 drains were different... fewer eyes on the order book then too.
I'm still not sure how the 53 grade holds when BlackRock is selling 🧐, even with the "how to read fund flows" part. It just feels off to me 📉.