

Listen: the breakdown
Market briefing: Listed Bitcoin miners fell below cash breakeven in Q2, with average production costs near $75,500 while BTC trades around $77,014. Spot ETFs just bled $463 million and ended a three-week inflow streak.
- Listed miners fell below cash breakeven in aggregate during Q2 2026, weighted average cost near $75,500 per BTC.
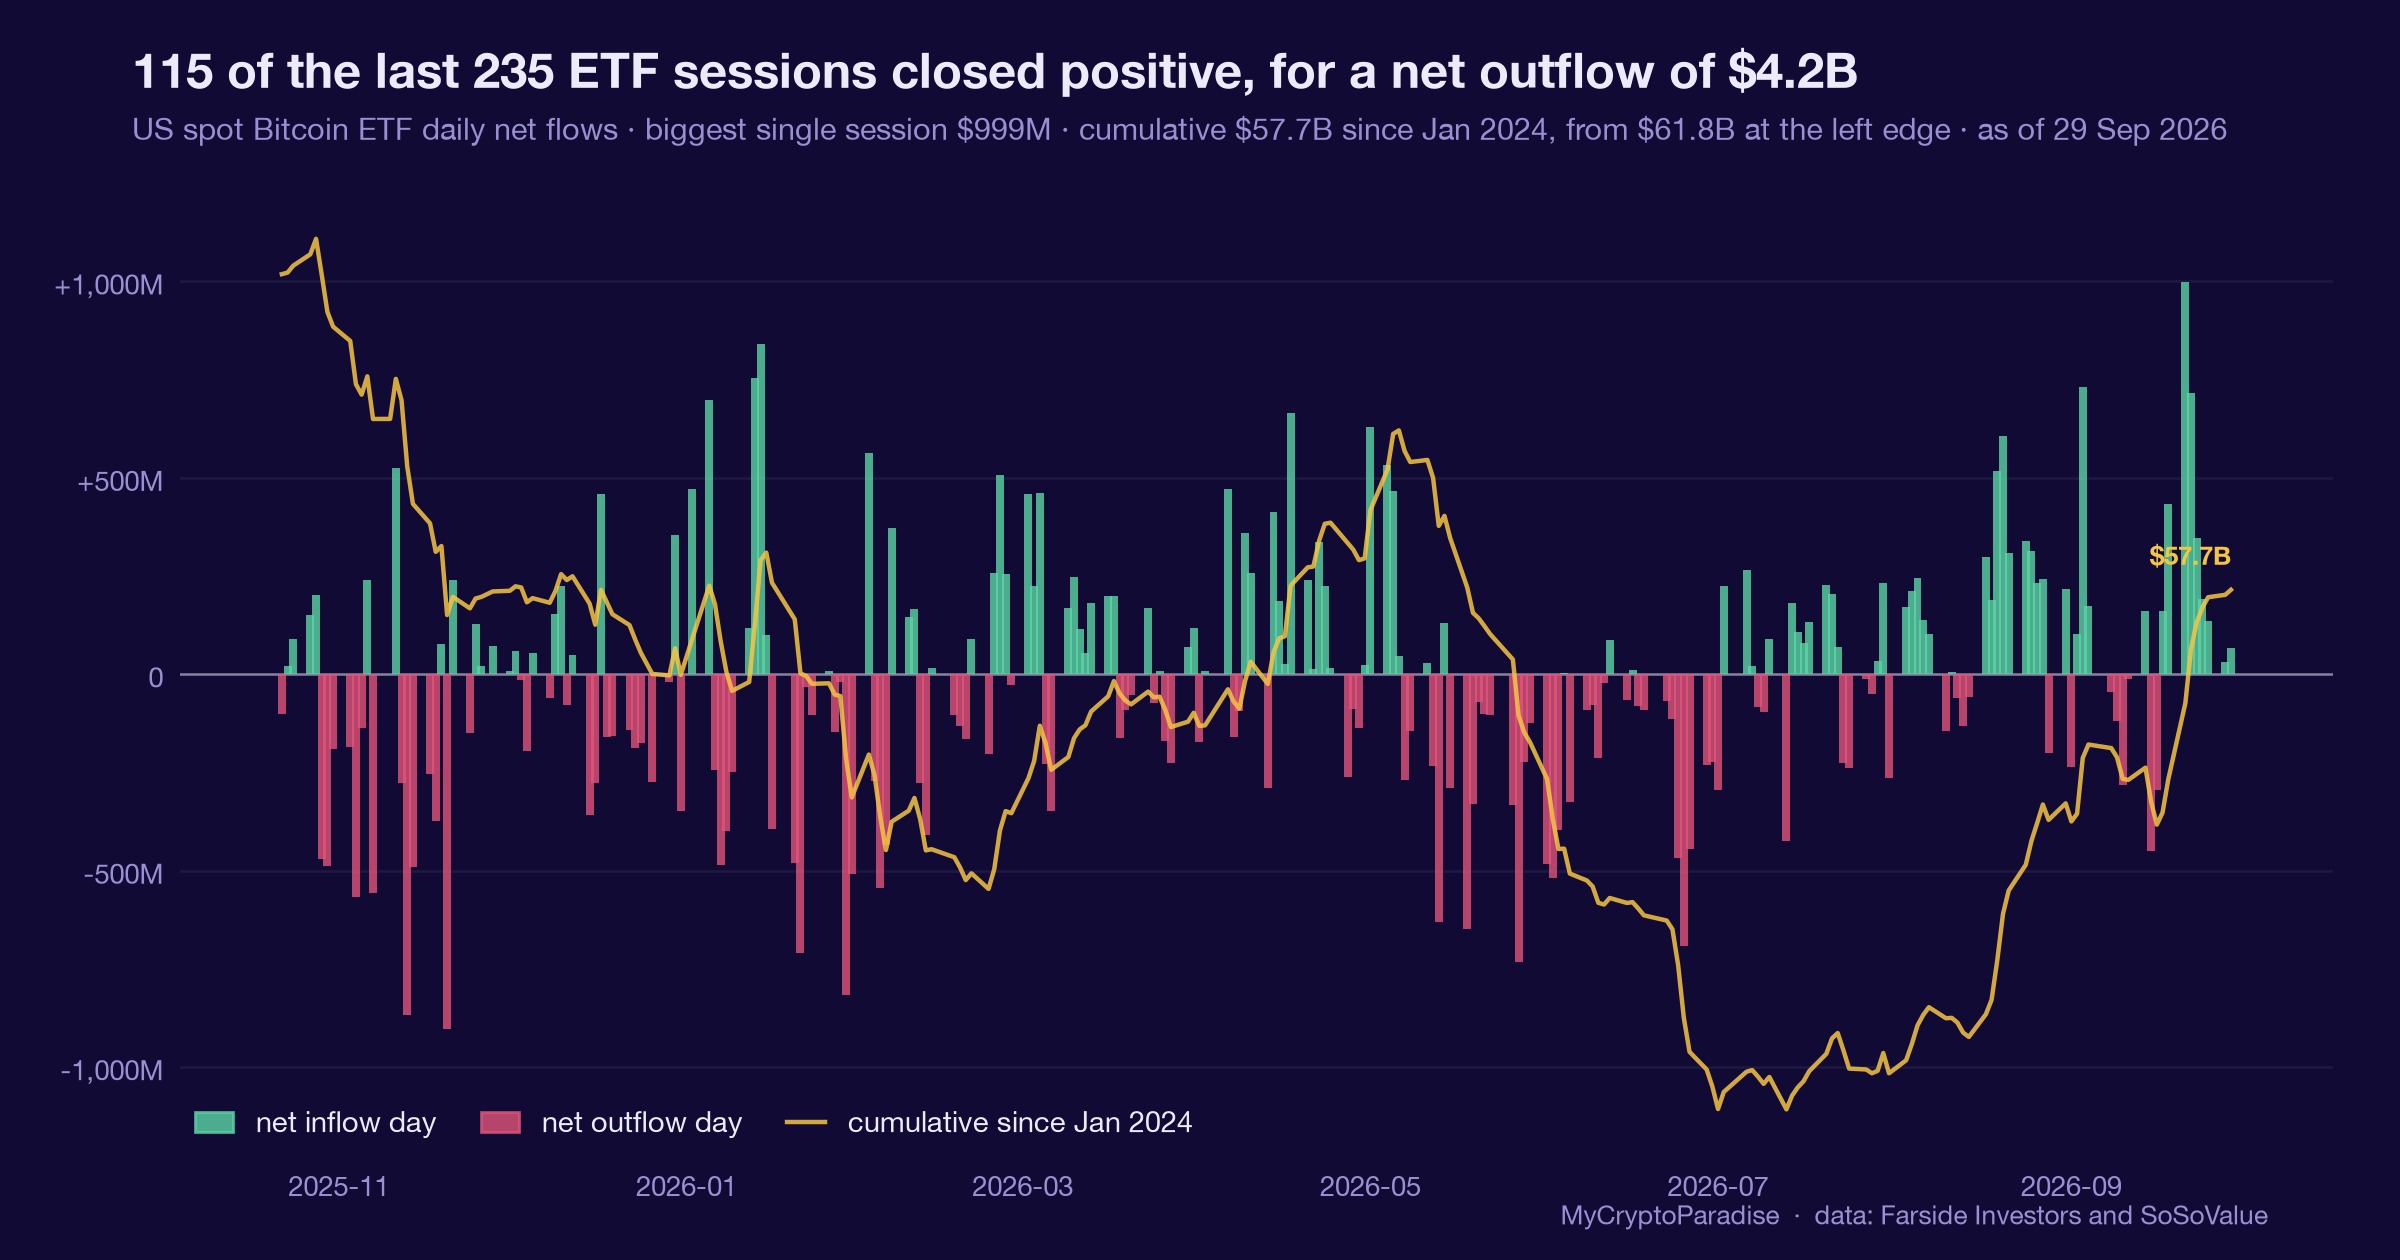
- U.S. spot Bitcoin ETFs saw $463 million of net withdrawals over September 7 to 11, ending a three-week inflow streak.
- BTC traded near $77,014, only a thin margin above the cost line, with distribution risk building near resistance.
Bitcoin miners now spend more to mine one coin than the market pays some quarters. With ETF money leaving too, is a deeper correction loading?
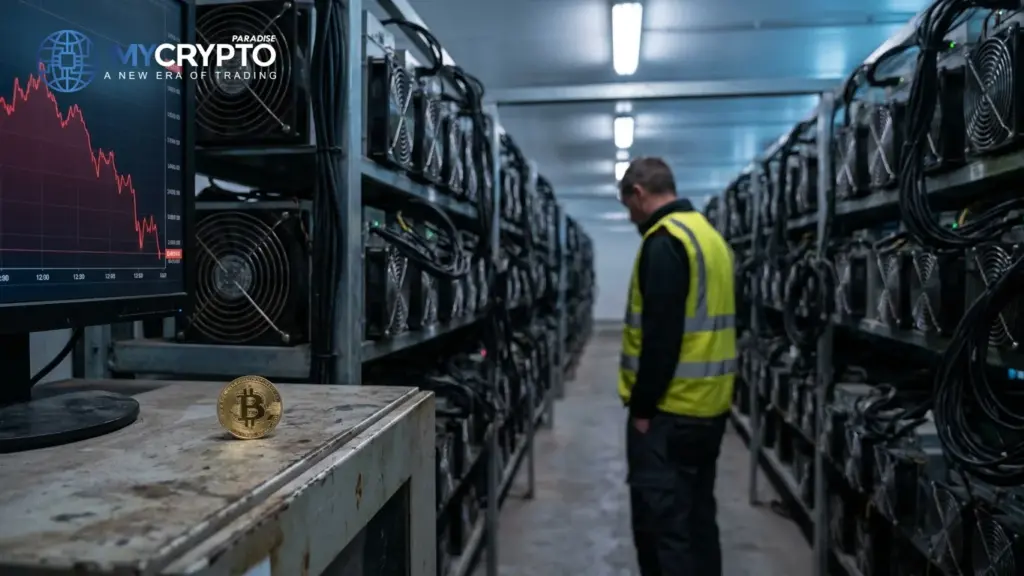
Listed Bitcoin miners slipped below cash breakeven in aggregate during the second quarter of 2026. The weighted average pre-tax cash cost to produce one BTC reached roughly $75,500. That number matters because it sits uncomfortably close to the live price. BTC traded near $77,014 as we wrote this, down about 0.8 percent on the day. The gap between what miners spend and what the market pays has narrowed to a razor.
When production costs press against spot, the economics of holding change fast. Miners run real businesses with electricity bills, debt, and payroll. If the coin they mine barely clears cost, some are effectively paying to keep the lights on, and the ones under strain tend to sell rather than stack.
This lands alongside a second signal we flagged earlier today. U.S. spot Bitcoin ETFs registered $463 million of net withdrawals across September 7 to 11, ending a three-week run of positive inflows. Today we lead with the supply side of that same story: the miners.
There is no single confirmed catalyst behind the current tape. That is our honest read, not a headline fact. But two pressures now point the same way: costs squeezing producers and demand cooling through the ETF wrapper. A market that spent months hearing miners were fine is quietly rediscovering the balance sheet.
Production costs now outrun the spot price
The transmission runs straight from mining economics to sell pressure. Miners earn newly issued BTC and must cover fiat costs constantly. When the average cash cost sits near $75,500 and price hovers around $77,014, the operating cushion is thin.
Thin margins force behaviour. Producers with weak balance sheets sell coins to fund operations rather than hold them for a rebound. That steady, non-discretionary selling adds to the natural supply the market already absorbs each day.
The demand side is not helping. Spot Bitcoin ETFs act as the main pipe for fresh institutional and retail money. When that pipe reverses and $463 million walks out in five days, the buyer of last resort steps back at the exact moment miners need bids.
So the structure weakens from both ends. More coins nudged toward sale, fewer dollars arriving to catch them. Reduced buying pressure meets rising supply pressure, and that combination rarely supports higher prices for long.
None of this guarantees a fall. It shifts probabilities. A market where producers are stressed and passive inflows have turned negative is a market with a softer floor than the headlines suggest. That is the mechanism worth respecting here.
Miner selling meets thinning ETF demand
BTC absorbs the first shock. Miner-linked supply and ETF outflows both hit the largest asset directly, which is why price stalled near $77,014 rather than pushing higher into resistance.
When Bitcoin looks fragile, liquidity drains from the rest of the board. ETH usually feels the second wave, trading as a higher-beta mirror of BTC risk appetite. If leaders wobble, capital rarely rotates bravely into second-tier names.
Altcoins take the sharpest hit in this sequence. Thin order books mean smaller flows move them further, so a modest BTC slide can trigger outsized alt drawdowns. Retail that chased strength late often becomes the exit liquidity here.
Open interest, the total value of active derivatives positions, is the tell to watch. Rising OI as price grinds lower usually signals fresh shorts pressing, while a sharp OI flush can mark forced liquidations that briefly clear the deck.
The honest caveat: a miner cost report is historical, and ETF flows are recent but not a same-day catalyst. We read them as confirming pressure, not igniting it. The cascade risk is real, but it builds through positioning, not a single dramatic print.
Confirmation sits at the 79K distribution zone
The nearest decision point is overhead. The $79,000 area marks a prior distribution zone and the 0.618 Fibonacci retracement, the level that maps a common bounce ceiling. Price stalling there would fit the bearish read.
Confirmation of downside would come from the daily candle. A bearish engulfing print, where a red candle fully swallows the prior green one, alongside the shooting-star tops already showing, would strengthen the case for a deeper move.
Invalidation is just as concrete. A clean reclaim of the $82,000 to $88,000 band as support, held on the weekly, would break the current structure and force us to reassess. We would rather be proven wrong by price than fight it.
On the flows, watch whether ETF withdrawals extend or the three-week inflow streak restarts. A quick return to net buying would ease the demand worry, while a second week of outflows would confirm retail is still leaving.
Miner behaviour is the slower tell. If treasury wallets keep sending coins to exchanges while price sits near cost, supply pressure persists. If miners hold through the squeeze, the market reads conviction, and the floor firms. Both signals matter more than any single candle.
Reading miner stress through smart money
The ParadiseTeam frames the miner squeeze and the ETF exits as the same story told from two sides: supply strain and cooling demand, both arriving near resistance rather than support.
Price sits around $77,014, just under the $79,000 distribution zone where we have been trimming exposure. That location matters. Bearish pressure that appears at resistance, into fear, usually reads as distribution into late buyers, not accumulation.
Contrast that with the alternative. Had this same miner news landed down at the $61,000 reaccumulation shelf with retail capitulating, our read would flip toward smart money buying. It has not. We are near the top of the recent range, not the bottom.
So the stops that matter sit above late longs and below the thin support at $76,000, a level that becomes a downside reclaim target if a bearish engulfing confirms. Trapped buyers near $79,000 are the fuel a move lower would feed on.
Our bias stays bearish on the higher timeframes, with room for one more short-term bounce, potentially toward the 0.786 retracement, before a deeper leg. We are still waiting on confirmation, not front-running it. Manage risk-to-reward, the ratio of reward risked against loss, and respect your stop-loss. Probabilities, not promises, guide every line of this read.
The read behind this: we framed this story through our own market analysis, Bitcoin ETF Outflows Near $500M: Crash Next?
Track it live: our live crypto funding rates and the crypto liquidation heatmap both update in real time, so you can watch this shift for yourself.
Related coverage
For exact entries, targets, and stop losses with full risk management, that is what ParadiseFamilyVIP is for. New to reading these moves? Start with our crypto trading strategies guide.
ParadiseTeam is monitoring the market situation closely, and we are taking these developments into consideration while building our trading tactics inside ParadiseFamilyVIP.
Crypto trading involves substantial risk. Prices are volatile and you can lose money. This article is educational and is not financial advice. Past performance does not guarantee future results.









Join the discussion 4
So does this mean the market might actually see some supply reduction, or is everyone just overreacting to the intraday noise again? 🤔
always knew holding small bits was the way for me. these big miners always chasing breakeven, its a different game for us regular folks.
I view it differently, Tommy. While the scale differs, the fundamentals of acquiring sats remain consistent whether you are a retail holder or a large mining operation.
for me i dont care about breakeven, they have to pay for big machines and power. i just hold my coins.