


Listen: the breakdown
Market briefing: US spot Bitcoin ETFs have shed over $1 billion in two sessions, with BlackRock's IBIT redeeming $405 million on Monday. BTC traded near $76,709, down 2.1% on the day.
- US spot Bitcoin ETFs shed over $1 billion across two sessions, led by IBIT.
- Category assets under management slipped below $100 billion to $98.14 billion.
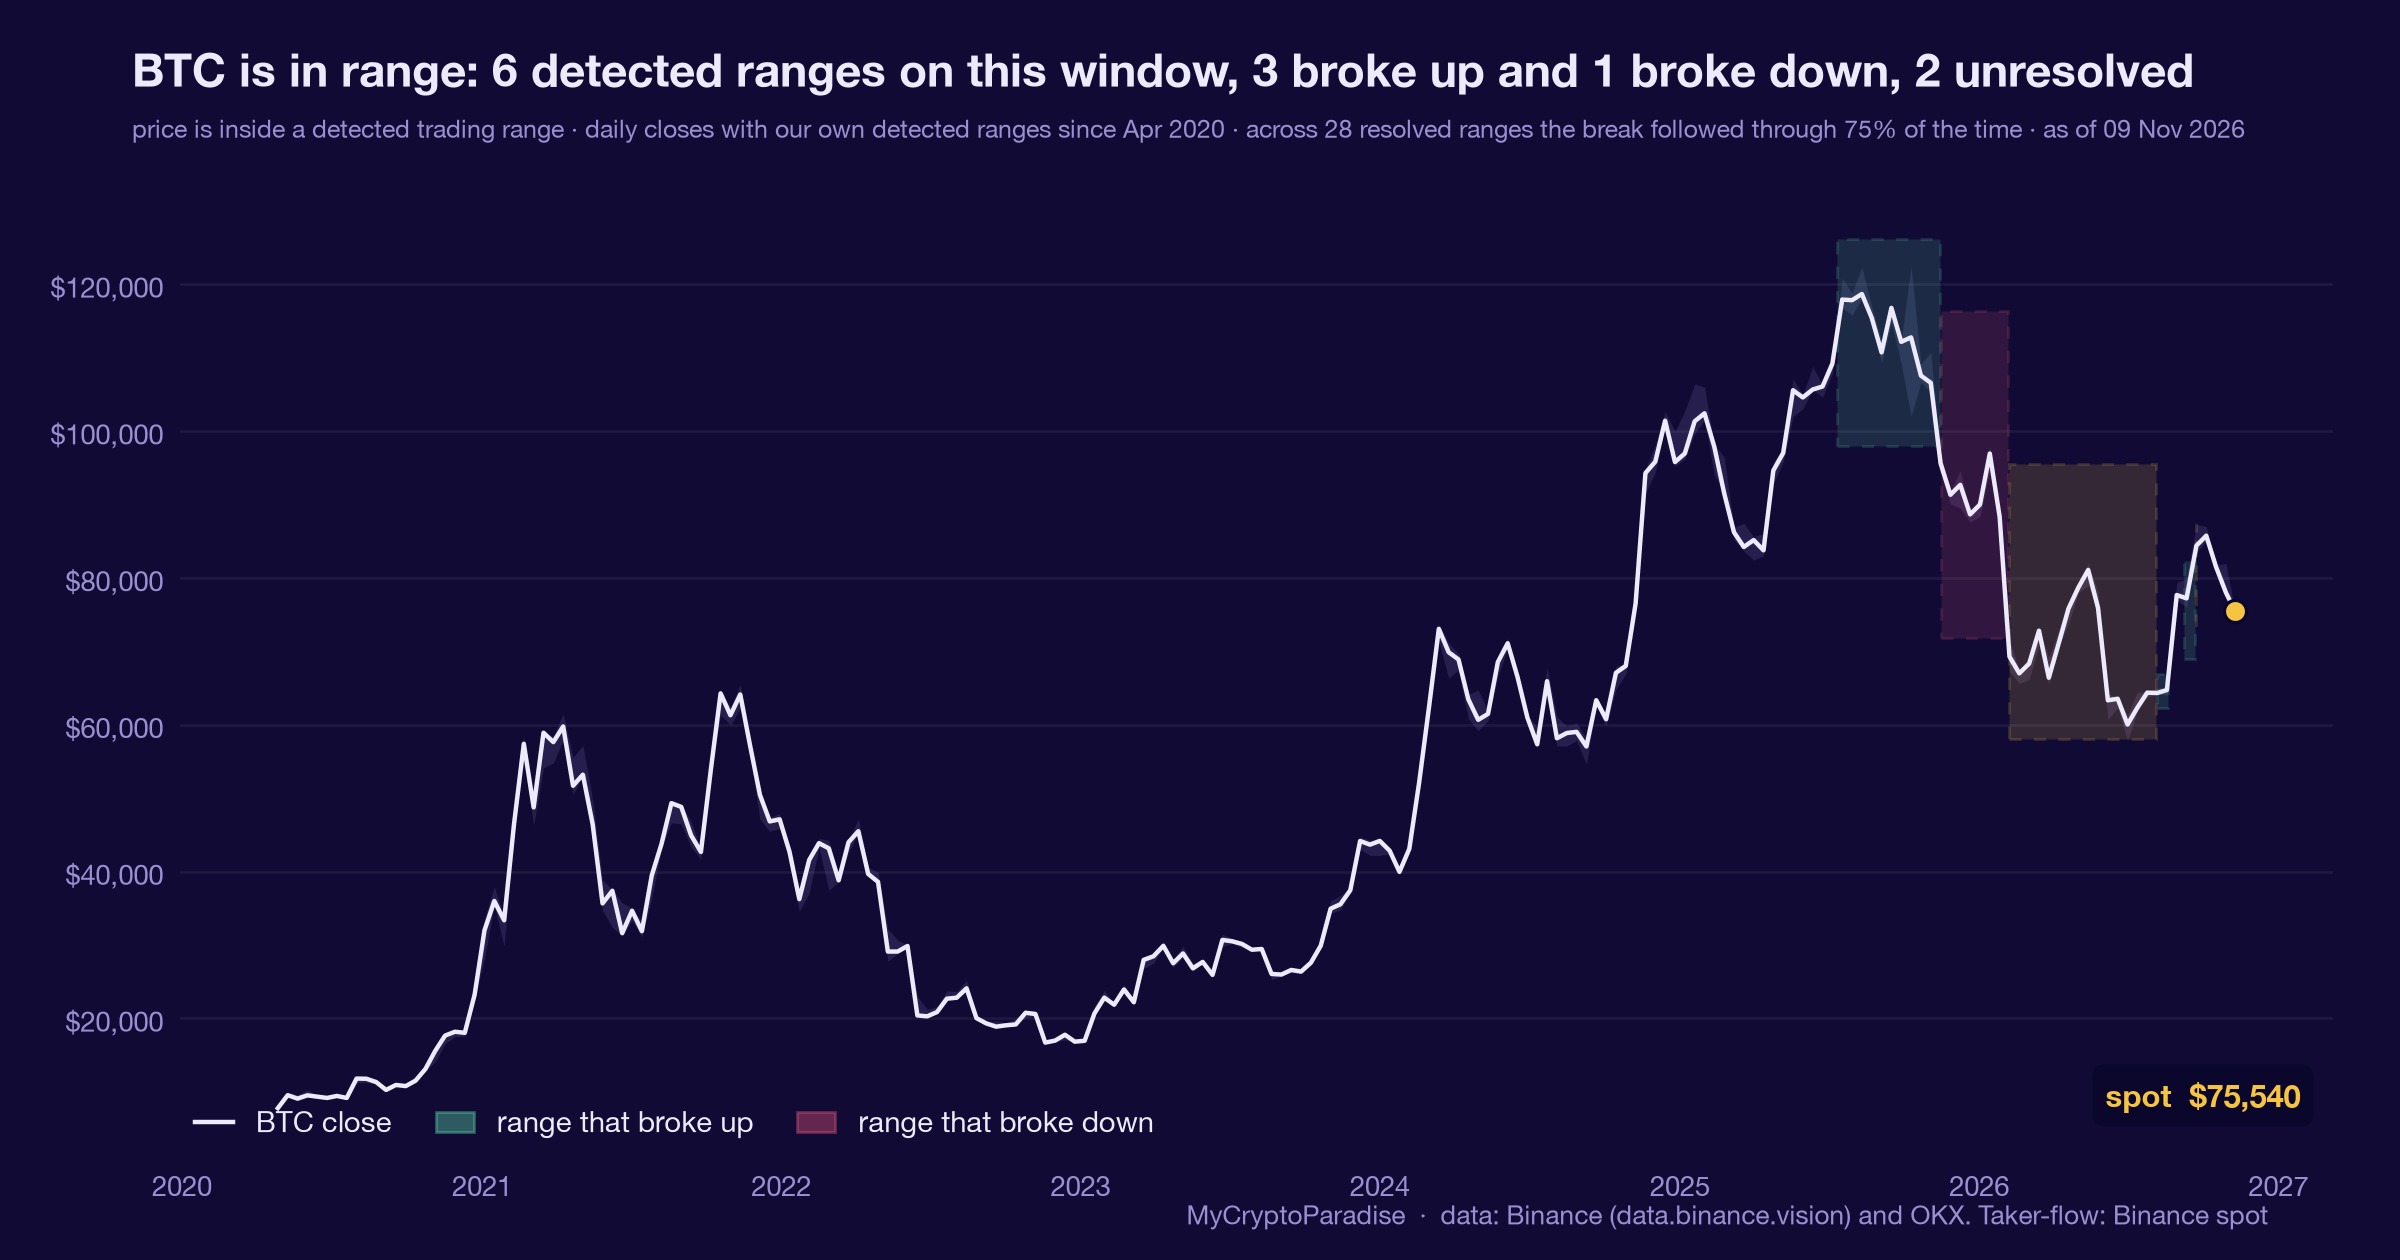
- BTC traded near $76,709, down 2.1%, below the $79k shelf that recently held.
US spot Bitcoin ETFs just bled over $1 billion in two sessions, and BlackRock's IBIT led Monday with a $405 million redemption. Is this forced selling that exhausts, or a deeper cycle?
The number is simple and large. US spot Bitcoin ETFs have shed over $1 billion across two sessions. Monday added $399 million in net outflows. BlackRock's IBIT alone redeemed $405 million.
Friday set the tone. The category lost $643.2 million in a single day. That ended a four-session inflow streak and marked the biggest one-day outflow since June 25. IBIT gave back $233.7 million, Fidelity's fund $201.4 million.
Total assets under management for US spot Bitcoin ETFs then slipped below $100 billion, to $98.14 billion.
Friday had a trigger. Binance-hack security fears, plus a warning that ETF custodians could be targeted, pushed institutions to de-risk. Monday carried the same momentum with no fresh stated catalyst. That absence matters, so we flag the Monday read as interpretation, not a confirmed cause.
Context softens the headline a little. IBIT's cumulative net inflows since launch still stand at $65.9 billion. The fund even closed the prior week net positive despite Friday's hit. One large redemption is not the same as a broad abandonment, whatever the ticker tape suggests.
But the rest of the issuer field is genuinely bleeding. BTC traded near $76,709, down 2.1% on the day, already under the zone that recently acted as support.
Net ETF demand just flipped negative
ETF flows are the marginal buy-side bid for Bitcoin. For most of October, those funds absorbed supply quietly and steadily. That steady absorption is what kept spot firm.
Now the flow has reversed. Two sessions of net outflows pull that bid out of the book. When the largest fund redeems $405 million in a day, authorized participants sell the underlying Bitcoin to meet it. That selling lands on spot, not on paper.
The drop below $100 billion in category assets under management is more symbolic than mechanical. But symbols move sentiment. A round number breaking the wrong way gives every cautious allocator a reason to wait.
The macro chain is short here. Reduced net ETF buying means thinner demand. Thinner demand into existing supply means price has to find lower buyers. That is the whole transmission, and it is working in real time.
The honest caveat stays in view. IBIT closing the prior week net positive tells us this is uneven, not a wholesale institutional exit. The broad complex is withdrawing liquidity while one fund still carried a weekly surplus. Weakness spread across issuers is a different signal than one headline redemption, and the two should not be read as the same event.
Thinner buy side pressures BTC then alts
Bitcoin takes the first hit, because the ETFs buy and sell Bitcoin directly. The outflow is spot selling, and spot selling is why BTC slipped to $76,709. This is not a derivatives wobble; it is real supply hitting the book.
ETH feels it second, through correlation rather than direct flows. There is no spot Ethereum redemption of this scale in the story. But when the reserve asset leaks, risk appetite across the majors contracts with it.
Alts sit at the end of the chain, and they sit there exposed. Higher-beta tokens trade on the thinnest order books. When the marginal Bitcoin bid steps back, liquidity across the long tail thins in sympathy.
Thinner liquidity does not just lower prices. It widens the distance between them. The same sell order that nudges BTC can gap a small-cap, because there is nobody underneath to catch it.
That is the bearish mechanic in plain terms. Outflows remove the buyer who was quietly holding the floor. Price then hunts for the next real bid, and in alts that bid can sit a long way down.
None of this needs a fresh catalyst to continue. It needs only for the redemptions to keep printing. The flow is the story, and right now the flow points one way.
Forced selling or a deeper redemption cycle
The next daily flow prints are the tell. One more session of heavy outflows turns a two-day wobble into a trend. A flat or positive print says the forced selling has largely cleared.
Watch whether the biggest funds stop leading the redemptions. IBIT and Fidelity drove Friday together. If the largest issuer flips back to inflows, the broad complex usually follows within days.
Watch the $100 billion line in assets under management. A quick reclaim frames the break as a sentiment air pocket. A week spent beneath it frames it as a regime change in demand.
On price, the $79k shelf is the structural pivot. BTC trades under it now, at $76,709. Reclaiming it would be the first evidence buyers are willing to pay up again.
Invalidation of the bearish read is specific, not vague. It is outflows reversing to inflows, assets under management back over $100 billion, and spot back above that former support. All three together, not one in isolation.
Confirmation is the mirror image. Continued redemptions, assets under management holding below the line, and price failing to reclaim $79k would mark this as the opening of a deeper cycle rather than a one-off purge. Until the flows turn, we treat weakness as the base case and bounces as the thing to prove.
Where the $79k reclaim fits now
Start with the level, not the headline. BTC traded near $76,709, already below the $79k shelf that recently acted as support. The ParadiseTeam reads that shelf as neutral now, leaning resistance. The outflow did not break structure; it confirmed a structure that had already turned.
That sequencing matters. Smart money repositioned before the news, not because of it. A tracked whale closed longs right before the Binance hack and has since flipped short. We treat these headlines as catalysts, not causes.
So this is not a contrarian accumulation print. There is no evidence of fresh buying inside the move. On its own facts, it reads as continued institutional de-risking, and we respect that.
For positioning, the hierarchy is clear. A reclaim of the $79k zone, held as support, would be the first real shift. Above that sits the 0.618 Fibonacci retracement level, whose reclaim is the trigger for a genuine price discovery mode. Neither is in hand yet.
The retail pattern is the familiar one. The crowd reacts to the outflow headline and the hack after the move; the repositioning already happened.
Keep the risk-to-reward (R:R) honest here. Fading strength into $79k, if it even gets there, respects the bearish flow. Chasing weakness lower, into thin liquidity with stops stacked beneath, is where impatient size usually gets punished.
The read behind this: we framed this story through our own market analysis, Binance Hack: Is Bitcoin's Small Drop Bullish?
Track it live: our live crypto funding rates and the Crypto Fear and Greed Index both update in real time, so you can watch this shift for yourself.
Related coverage
For exact entries, targets, and stop losses with full risk management, that is what ParadiseFamilyVIP is for. New to reading these moves? Start with our crypto trading strategies guide.
ParadiseTeam is monitoring the market situation closely, and we are taking these developments into consideration while building our trading tactics inside ParadiseFamilyVIP.
Crypto trading involves substantial risk. Prices are volatile and you can lose money. This article is educational and is not financial advice. Past performance does not guarantee future results.
Do these Bitcoin ETF outflows exhaust soon, or start a deeper redemption cycle?
How 18 Paradisers are calling it
The first call is still open
Free account, no password. Members just sign in.
Follow this topic: Bitcoin ETF news












Join the discussion 25
that kind of rush out the door reminds me of how my gut said no to that instagram mentor before i even understood what i was being pitched... still learning what the numbers mean tbh 🙂
I'd like to see the IBIT redemption figure broken out by day before I call two sessions a trend. Right now my script only logs the category total, so I can't tell if $405M is one desk unwinding or steady selling.
Katya, good call on the by-day split, because if the $405M came from one desk you'd see it as a single spike, not a slow bleed. Could you also tag the creation and redemption legs separately? 🤔📉
so the 405m out of ibit on its own is what got me, my first sat was bought after a good season and i still dont like watching a number that size walk out the door
Had the same gut feeling in 2018 while my position bled, and nobody had an exit plan, me included. At work I plan barge slots off throughput, not mood, so I'd wait for the outflows to keep stacking before calling it anything.
Honestly the thing that got me was how calm the outflows looked on the chart, while I was at my kitchen table feeling every dip like a punch!! Small accounts get shaken fast, so I keep reminding myself the quiet days count too 🐱
Reminds me of a month at work when the settlement report looked clean until day three, and then.... the outflows were all sitting in a batch nobody had opened yet. Daily totals can hide the same thing.
Fair point Nadia.... but a settlement batch that nobody opened yet is still a batch that exists. The daily totals are only hiding it if you stop reading the ledger after the summary line. I'd still check the IBIT redemption by day before calling it a trend.
fair, but that's my point... a batch you haven't opened is still outflow sitting in the ledger. i'd rather see the IBIT redemptions by day for the last 5 sessions before anyone calls the total a one-off
Wait, did IBIT really account for all of that $405M on day one or was it spread across both sessions? 👀 Trying to match the screenshot timestamps 📉
Good call on the timestamps 👀 Flow numbers often get revised after the first print, so I'd check the settled daily totals before trusting either session's figure 📉
Honestly, two sessions of redemptions tells me less than the families sending money home every week 🤷 I'd rather track how many corridors actually use it than who sold on a Tuesday 📉
Two sessions is noise on a weekly chart, so the "over $1 billion" headline doesn't convince me of anything yet. Four-hour noise is not a signal, and I say that as someone who used to check prices between supplier calls 😅
Pulled the daily flow file myself last night before I trusted the headline... two sessions is a small sample, but I'd want to see that $1 billion number repeat in the next few weeks before reading anything into it.
Ok so I'm still learning this, but at the warehouse I did a stock count every shift, so I look at the running total day to day.... that's what catches my eye first 😅
ok i hear you noah, the stock count comparison is a good one 😅 but i think a running total can make a dip look bigger than it is when you dont know what the normal daily moves look like yet. where do you think the line is between a normal wobble and something real
Nobody sold me a single sat on the way down, and I still think a few hundred million moving out in a couple of days says more about who is panicking than about the asset. I'll keep stacking in my own wallet and hold my position, thanks for the discussion.
Agreed on the panic angle, Ben. One thing I'd check before reading much into it: whether those outflows came from new issuance being pulled back or from existing holders, since on-chain data can't see ETF share redemptions directly. Do you have a source for the breakdown?
Ben, I'd read those outflows differently. In pesos, a sell-off like this is the moment people with no savings buffer get forced out first, so I'd watch who's holding the bag before I'd call it panic. Same logic I use on my own positions..
Diego, you say a sell-off forces out the people with no buffer first, and I agree that happens. But that tells you who got forced out, not what the asset is worth. Whoever is selling at a loss is handing sats to whoever is buying, and I would rather be on the buying side with my own keys than guess who is left holding the bag.
Leading with one fund's redemptions makes the whole category sound like it's bleeding. People hunting for an easy dip will read that and talk themselves into a bargain, which is usually how it gets expensive...
I keep an eye on the ETF flow numbers more than the candle, since a category shrinking below $100 billion tells me more about who is holding than any single red day does. Whether those outflows are long-term holders trimming or a few large players stepping out is the question I'd want answered before reading much into it.
yeah the holder question is the whole thing for me, because a trim by long-term holders looks very different on the stablecoin side than a few big desks pulling out. if the cash isnt leaving the system you read it as rotation, if it is you read it as exit
Honestly the $405M from IBIT stuck with me too, I'm still new enough that I read every number twice!! I remember when my first tiny buy in 2025 was after a night shift and my hands were shaking, so watching outflows makes my stomach drop a little. Sorry, is that too personal for here?
Still thinking about spring 2013, when I printed the whitepaper at an internet cafe with Cyprus on every front page, so these outflows read more like a monetary question to me than a chart.