


Listen: the breakdown
Developing story update (October 20, 2026, 09:36 UTC):
Bitcoin ETFs just saw their biggest day in a month thanks entirely to BlackRock
Developing story update (October 20, 2026, 07:35 UTC):
New context on the October 19 flows: the $527 million net inflow into US spot Bitcoin ETFs is the largest single-day figure since September 22, and it reverses the prior session’s net outflow. That shift from redemptions back to accumulation is the signal traders should weigh, not the headline number alone.
Price action still lags the flow. Bitcoin tagged an intraday high near $83,155 on October 19 before fading back toward the $81,500 area, keeping the 24-hour change negative. The divergence suggests institutional demand is being met by supply at these levels rather than driving an immediate breakout.
What to watch now: Whether the inflow reversal extends into a multi-day streak or fades back to outflows, and if BTC can reclaim and hold above the $83,155 intraday high.
Developing story update (October 20, 2026, 07:06 UTC):
BlackRock's IBIT Bitcoin ETF draws $665 million inflow, highest since October 2025
Market briefing: US spot Bitcoin ETFs pulled in $527 million on October 19, with BlackRock's IBIT taking $665 million, while spot Ether ETFs lost $103 million. BTC still slipped near $81,703, so the demand is real even if the tape stayed quiet.
- US spot Bitcoin ETFs took in $527 million in net inflows on October 19.
- BlackRock's IBIT absorbed $665 million, more than the whole group's net figure.
- Spot Ethereum ETFs saw $103 million leave as ETH slipped near $2,394.
US spot Bitcoin ETF inflows hit $527 million in a single day, led by IBIT, yet BTC still dipped near $81,703. So why did half a billion in demand fail to lift the price?
US spot Bitcoin ETFs pulled in $527 million in net inflows on October 19. BlackRock's IBIT did the heavy lifting, absorbing $665 million on its own. Yet BTC slipped, trading near $81,703 as of the latest read. Strong institutional demand met a market that declined to celebrate.
The split inside that number matters more than the headline. IBIT alone took in more than the entire group's net figure. That means other funds bled out while BlackRock gathered. Institutional money is not moving in one tidy direction; it is concentrating into one name.
Ethereum told the opposite story. Spot ETH ETFs saw $103 million walk out the door on the same day, and ETH fell with it, near $2,394. The rotation looks genuine. Capital is choosing Bitcoin and quietly trimming Ether.
Here is the puzzle traders keep circling. Half a billion dollars arrives, and the price drifts lower. Markets rarely reward the obvious trade, and by now this one looked obvious to almost everyone.
We do not have a single confirmed catalyst for the slip, so treat any clean explanation as our read rather than a fact. The flows are confirmed. The reason price shrugged them off is interpretation, and honest analysis keeps those two things apart.
Institutional demand builds beneath a quiet tape
ETF flows are the slow, patient layer of demand that sits under the daily noise. Every dollar of net creation forces authorized participants to source real Bitcoin in the background. That is structural buying from traditional finance, and it does not vanish because one session closed red.
But the transmission from flow to price runs through timing, not headlines. Creations settle over days, and sellers on the open market can easily swamp a single session's ETF bid. So $527 million of demand can arrive while spot and leverage flows push the other way. The number is bullish; the clock is messy.
The IBIT concentration is the part worth sitting with. One fund taking more than the whole group's net total tells you where conviction lives. Smaller products are seeing redemptions, so the aggregate hides a quiet consolidation of trust into BlackRock.
Ether's $103 million of outflows sharpens the contrast. Institutions are not fleeing crypto. They are expressing a preference, and right now that preference is Bitcoin over Ethereum.
For the wider market this reinforces a theme we have tracked all cycle. Traditional finance keeps wiring itself into Bitcoin through regulated rails, one creation at a time. That drip is unglamorous. It is also the most durable bid in the asset's history, and it rarely shows up in a single day's candle.
BTC absorbs the bid as Ether flows reverse
BTC is the direct beneficiary, even with a lower close. Steady ETF creations thin out available spot supply over time, which tightens the float that short sellers eventually have to buy back. That is a slow squeeze, not a fireworks display.
The immediate price dip near $81,703 reads as absorption, not rejection. Someone is selling into this demand, most likely short-term holders and leveraged longs taking the exit while a deep institutional bid stands ready to catch it. Smart money tends to accumulate exactly when the news looks good and the price does not follow.
Ethereum feels the opposite pull. Outflows plus a dip near $2,394 mean the marginal institutional dollar is leaving ETH, so its liquidity cushion is thinner than Bitcoin's right now. That makes ETH the more fragile of the two on a wobble.
Altcoins inherit Ether's weakness with leverage attached. When BTC absorbs the institutional bid and ETH leaks, capital rarely cascades down the risk curve. Smaller caps get starved first.
So the near-term map is a widening gap. Bitcoin carries a structural tailwind that has not yet converted to price. Ether and the long tail carry the drag. Until BTC's flows translate into a reclaim of higher levels, the divergence is the trade the market is actually pricing.
Where confirmation lives above 85K
The first tell is whether these inflows continue or prove to be a one-day spike. A single strong print is noise; three or four in a row is a trend that spot price cannot ignore forever. Watch the daily net figure, not the drama.
Price confirmation sits above $85,000. A reclaim and hold there would signal that institutional demand has finally overwhelmed the sellers who absorbed it this week. That is the level where trapped shorts start to feel the squeeze.
Invalidation is cleaner and lower. A decisive loss of the $78,000 to $79,800 zone, with flows drying up at the same time, would tell us the bid was not deep enough to defend the structure. That combination, weak flows plus a broken support, is the real warning.
Ethereum is the honesty check on the whole story. If ETH outflows keep stacking while BTC inflows persist, the rotation thesis holds and relative strength stays with Bitcoin. A sudden ETH inflow flip would muddy it.
One quieter signal deserves attention: volume on any retest of support. Thin volume into a dip, followed by a firm bounce, usually marks accumulation rather than distribution. Heavy volume breaking the zone means the opposite. Let the behaviour at the level, not the headline, settle the question.
Reading these inflows against the 79K zone
The ParadiseTeam frames this through one question: does $527 million of demand change what happens at the levels that already matter? With BTC near $81,703, the answer is that it strengthens the floor more than it promises an immediate rip.
Our standing map still centres on the $78,000 to $79,800 support zone. Persistent ETF inflows give that zone a reason to hold, because a regulated institutional bid tends to sit under price exactly where overleveraged longs are most vulnerable to liquidation. That is the smart-money mechanic we keep flagging. Spot CVD (cumulative volume delta) has been printing higher lows while price probes support, which is the footprint of patient accumulation absorbing retail fear. Today's inflows fit that behaviour cleanly.
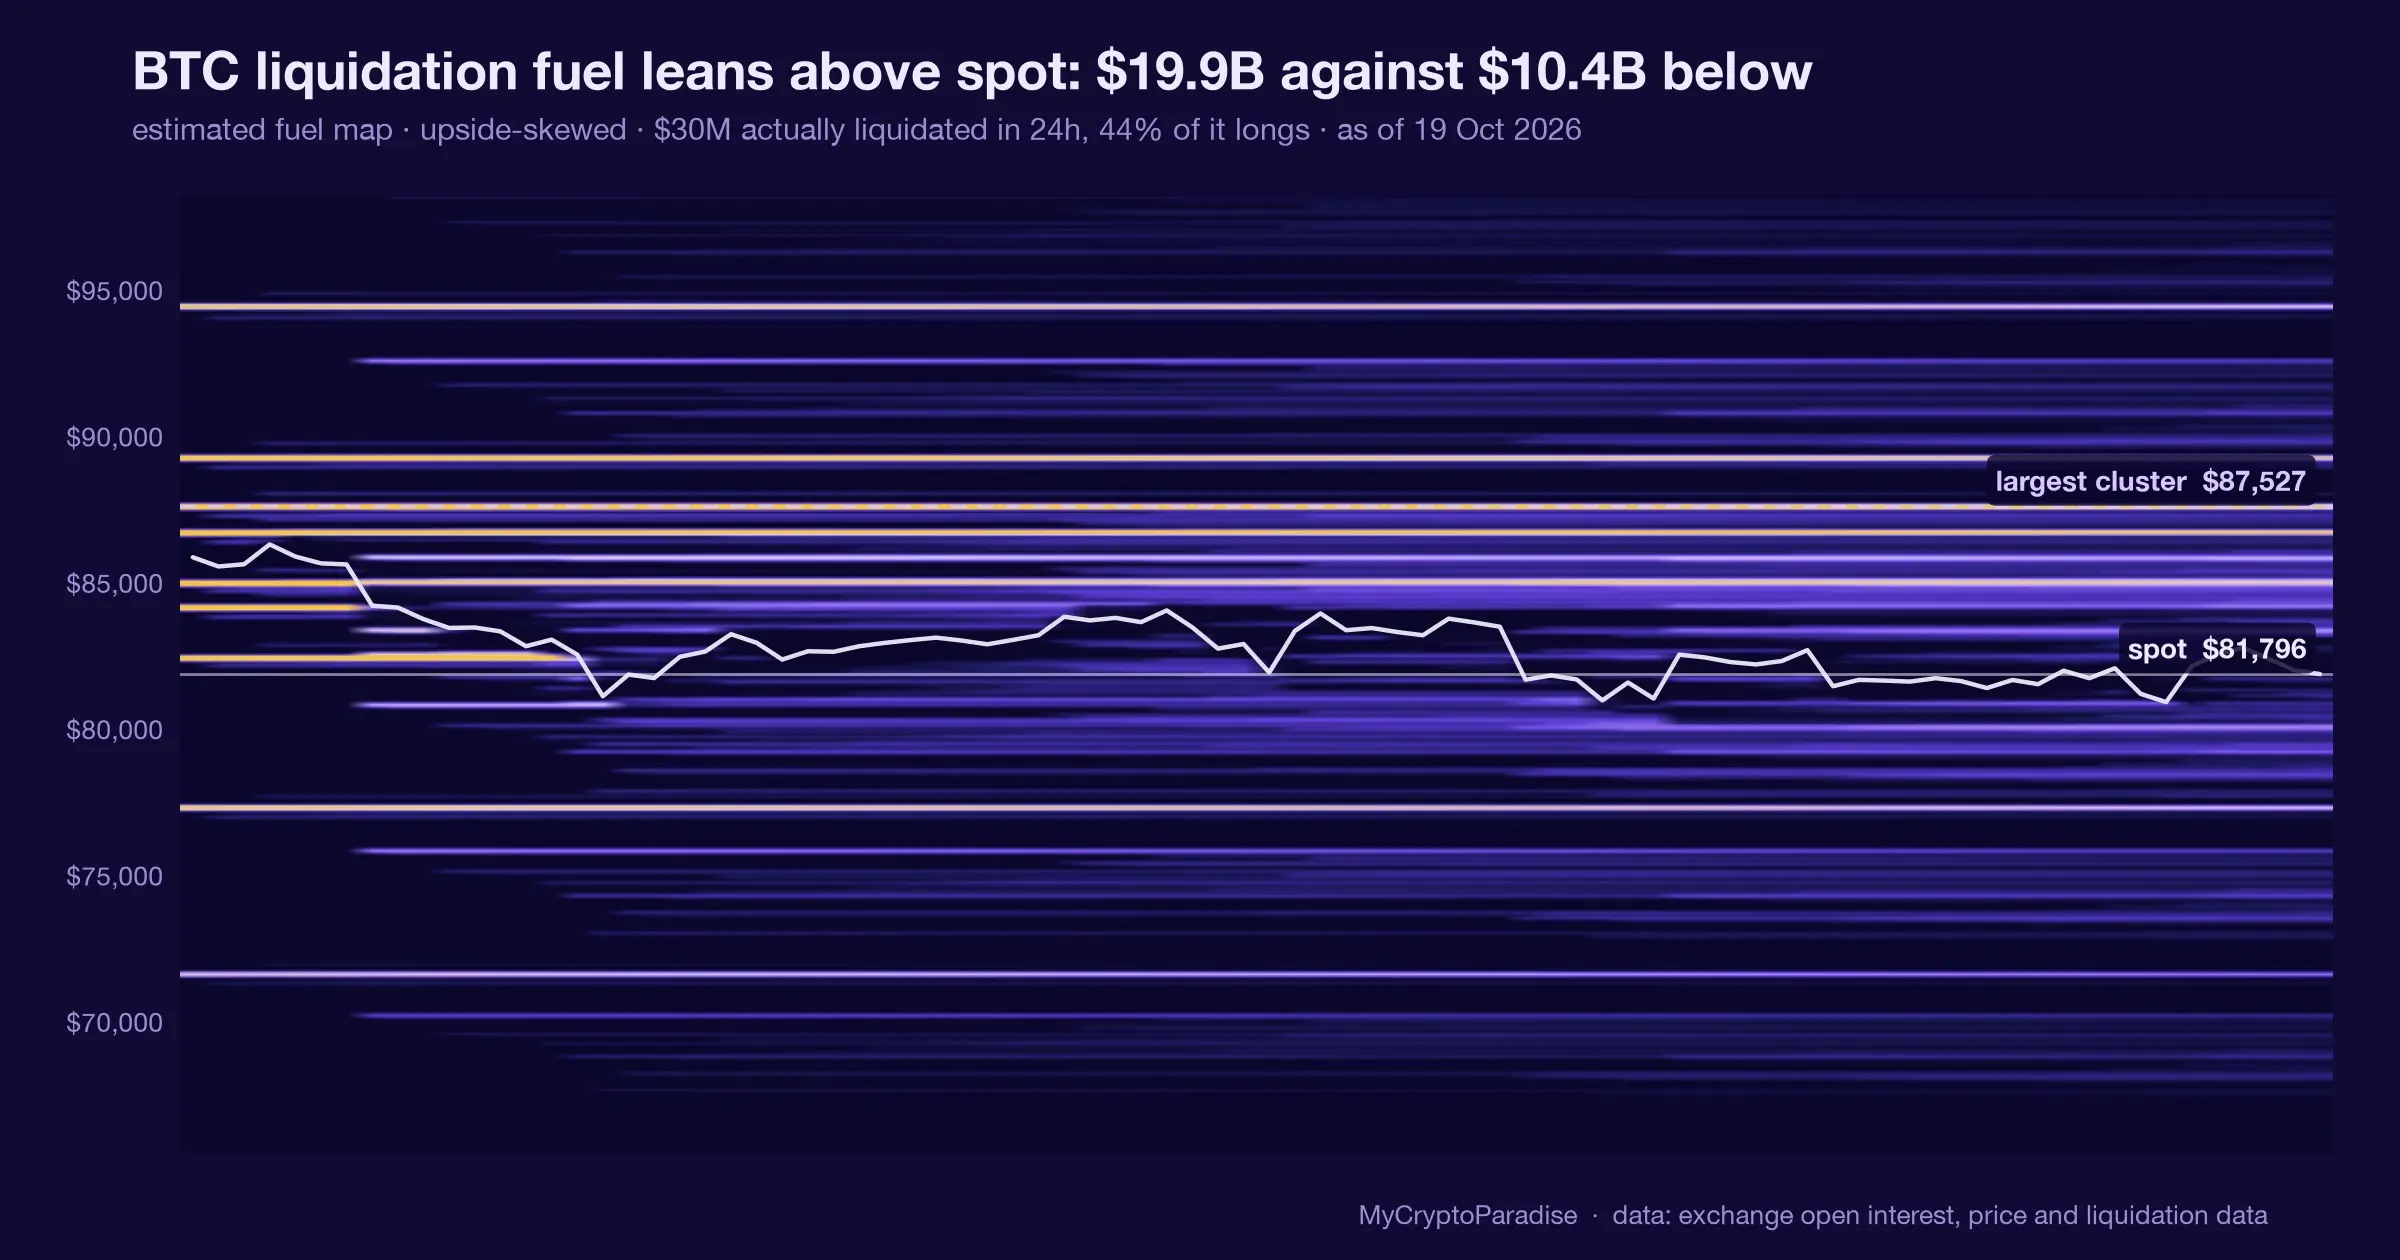
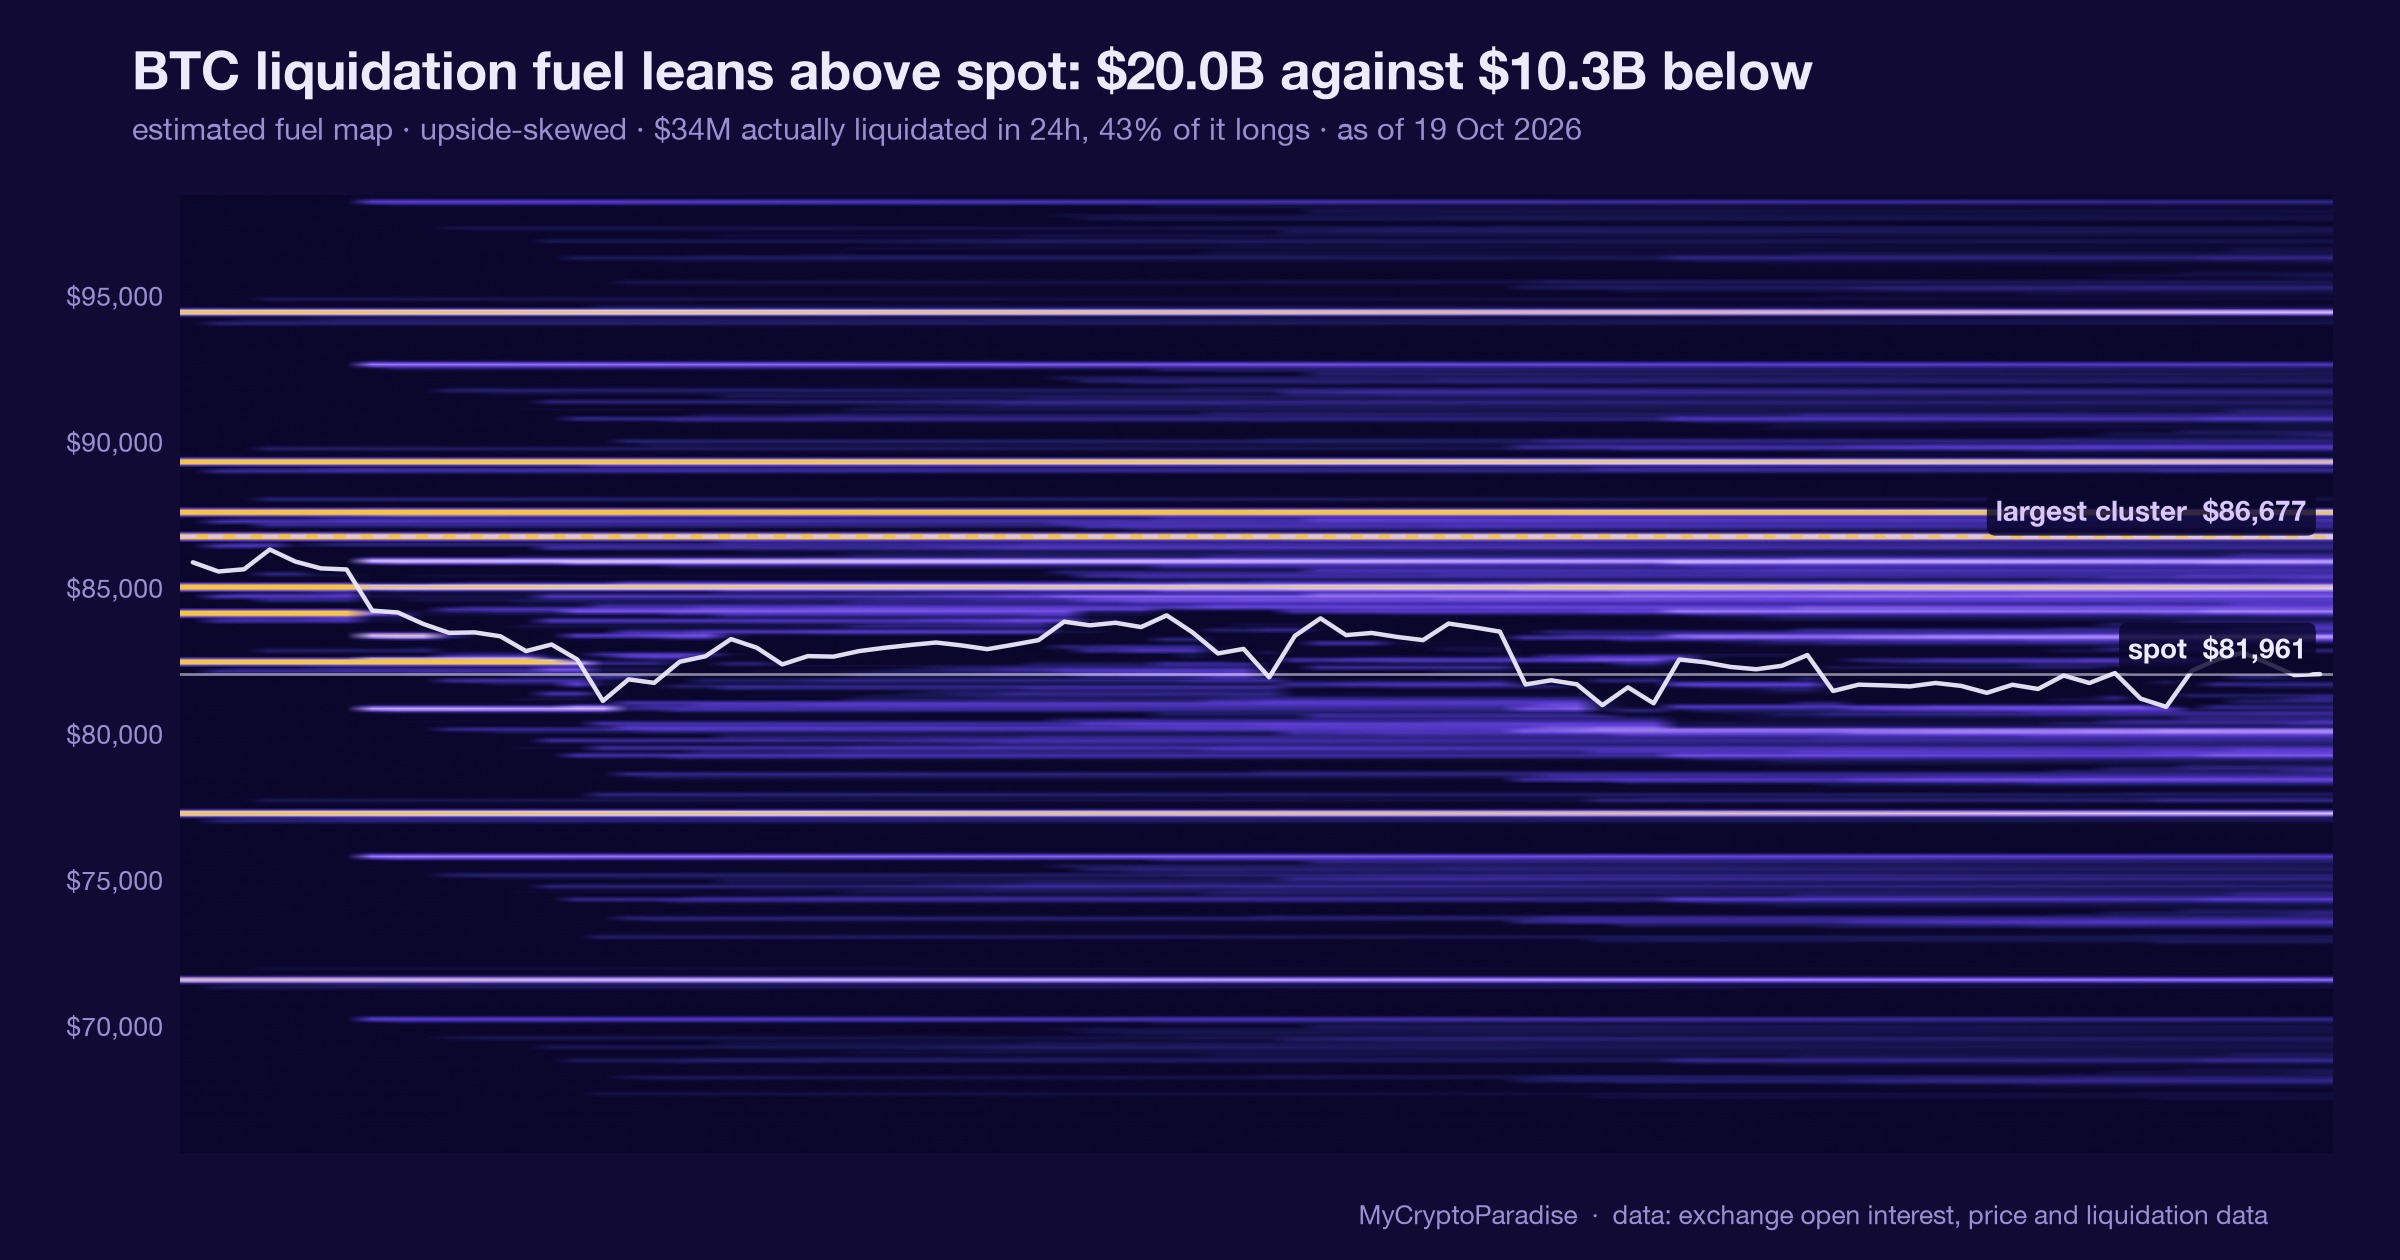
The caution is honest and it comes from the lens, not from this story's facts. Overleveraged shorts cluster between $85,000 and $90,000. Strength can stall there, and good news arriving into resistance is often where distribution hides, so a push higher needs to be earned, not assumed.
So the ParadiseTeam reads it as constructive but unconfirmed in price. Hold the support zone and the inflows become fuel for a move toward $85,000 and eventually the $90,000 cluster. Lose it on fading flows and the structural bid gets tested properly. Probabilities, not promises, and the $79,000 line decides which way this leans.
The read behind this: we framed this story through our own market analysis, Can Bitcoin Rally Back to $90K?
Track it live: our live crypto funding rates and the crypto liquidation heatmap both update in real time, so you can watch this shift for yourself.
Related coverage
For exact entries, targets, and stop losses with full risk management, that is what ParadiseFamilyVIP is for. New to reading these moves? Start with our crypto trading strategies guide.
ParadiseTeam is monitoring the market situation closely, and we are taking these developments into consideration while building our trading tactics inside ParadiseFamilyVIP.
Crypto trading involves substantial risk. Prices are volatile and you can lose money. This article is educational and is not financial advice. Past performance does not guarantee future results.
Do these ETF inflows lift BTC to reclaim $85K before a dip to $79K?
This is how 9 Paradisers are calling it. Tap your call.
No calls on this one yet. Tap yours to be the first.
Free account, no password. Members just sign in.
Follow this topic: Bitcoin ETF news












Join the discussion 1
It's quite the confluence, watching institutional flow chase a dip like this. Reminds me of the early days, reading the whitepaper after Cyprus, wondering if liquidity would ever truly decentralize.