

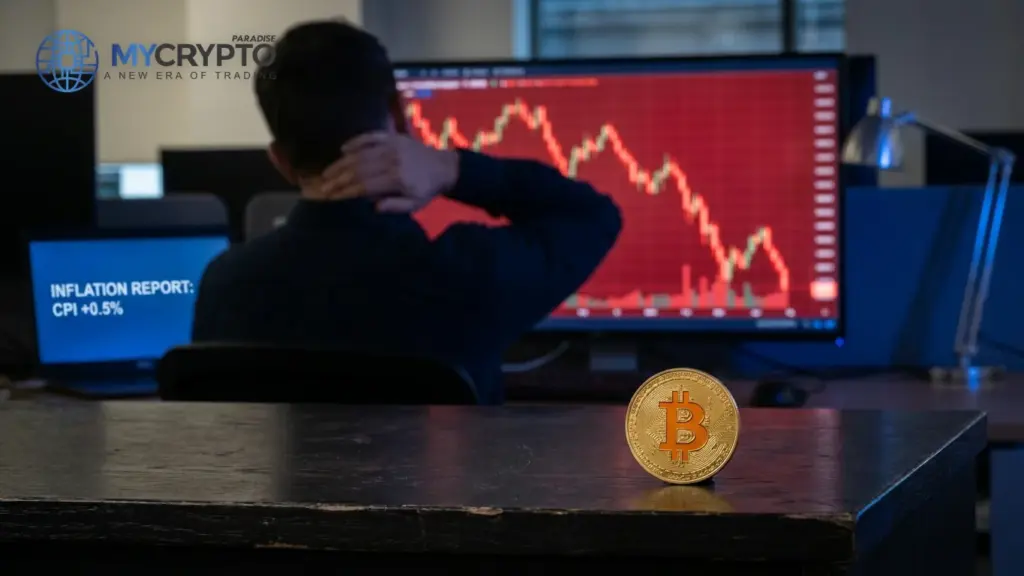
Listen: the breakdown
Developing story update (September 11, 2026, 10:08 UTC):
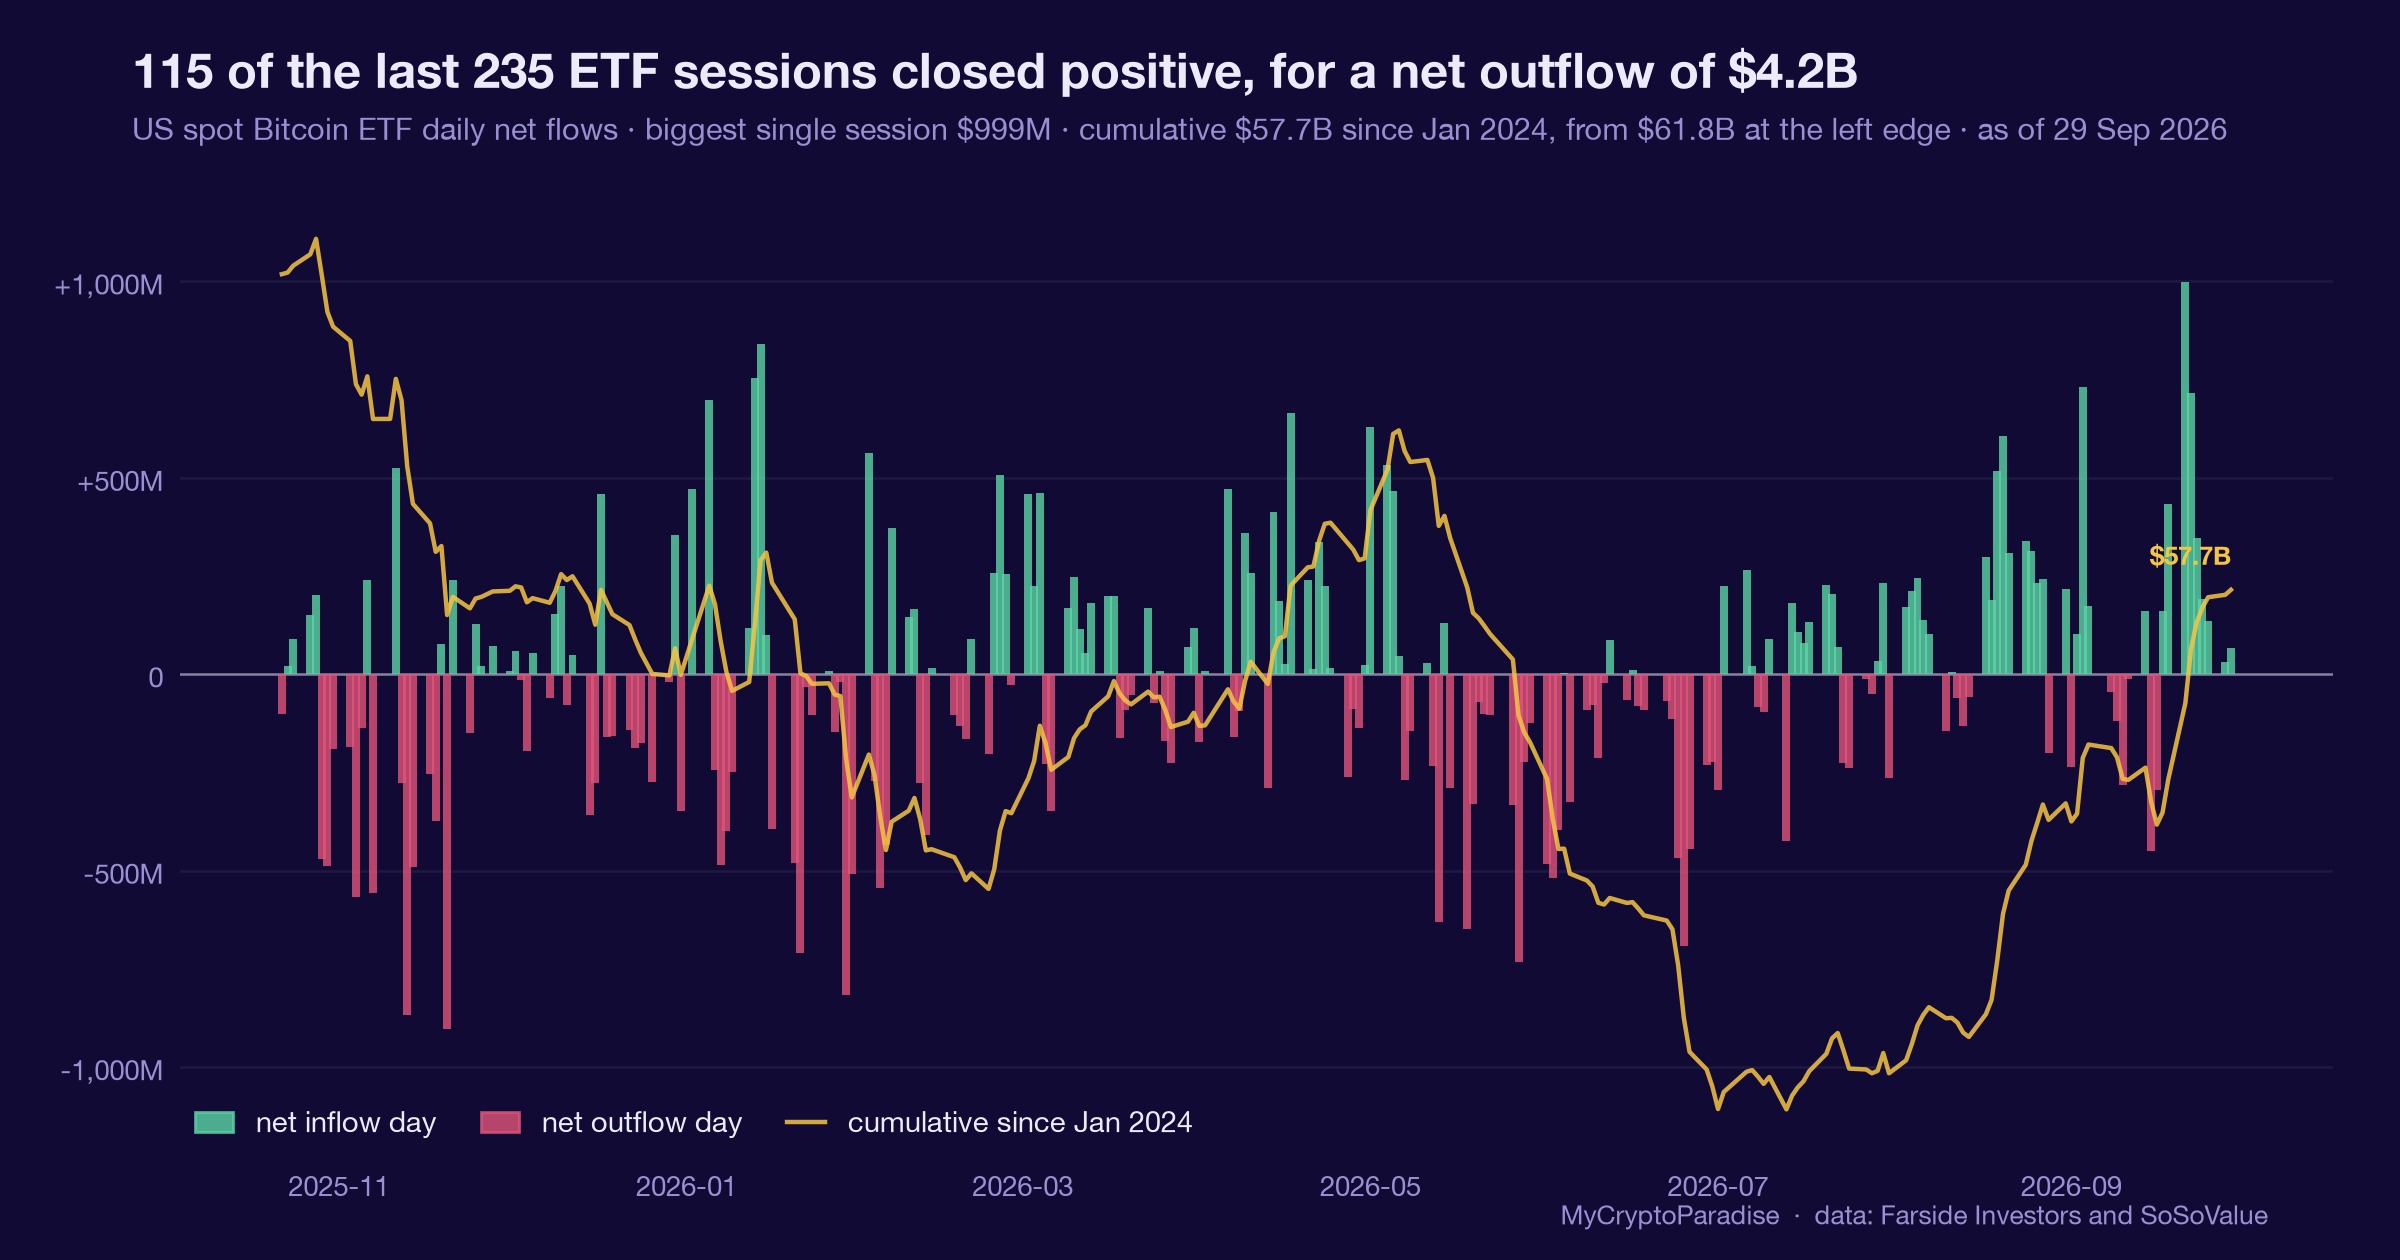
Update: while spot price keeps grinding under the $79K to $80K zone ahead of the CPI print, US spot Bitcoin ETFs have now pulled in roughly $723.5 million in net inflows month to date, based on our sources. That is a steady institutional bid running underneath the weak headline price action.
For traders this is the tension to watch. Leveraged longs are still being flushed near the $77.5K support break, yet passive ETF demand has not turned off. If that inflow pace holds, it can slow a deeper flush; if it stalls, the path toward the lower accumulation zone opens up faster. Treat both as probabilities, not certainties, and size accordingly.
What to watch now: Whether spot ETF net inflows keep building through the CPI reaction or stall as BTC tests support.
Developing story update (September 11, 2026, 09:04 UTC):
Ahead of the 8:30 a.m. ET CPI print, Bitcoin extended its slide, tagging a lower intraday low near $76,800 after losing the $77.5K support and repeatedly stalling under the $79K to $80K zone. Forced liquidations closed roughly $96.53 million in BTC positions over the past 24 hours, consistent with leveraged longs being flushed rather than a spot-driven breakdown.
A crosscurrent worth watching: US spot Bitcoin ETFs still show about $723.5 million in net inflows month-to-date, so institutional demand has not confirmed the price weakness even as short-term traders capitulate. Separately, West Asia tensions have pushed crude oil to around $108, adding an inflation input that could color how the CPI figure is read.
What to watch now: Whether the CPI print flips ETF inflows to outflows or holds the $76.8K low as liquidations cool.
Developing story update (September 11, 2026, 08:02 UTC):
Fresh data adds two macro cross-currents to today’s setup. Spot Bitcoin ETFs have taken in about $723.5 million in net inflows this month even with one day of outflows, a sign institutional demand is still absorbing supply while price grinds lower. That inflow can slow, but not stop, a squeeze on retail leveraged longs.
On the macro side, crude oil pushing to roughly $108 per barrel on West Asia tensions adds an inflation input that likely stiffens the Fed’s hand ahead of today’s CPI print, keeping yield pressure on risk assets. Watch how BTC reacts to the number rather than the headline.
Levels to trade against are firming up: near-term support sits around $76,800 and $76,200, with resistance layered at $79,600, $80,000, $80,500, and $83,000. Losing $76,200 opens room toward the deeper ‘exchange of hands’ zone; reclaiming $80,000 would probably relieve the immediate downside pressure.
What to watch now: Whether ETF inflows keep absorbing supply or fade as oil-driven inflation risk stiffens the CPI reaction.
Developing story update (September 11, 2026, 07:41 UTC):
Update: Bitcoin has now lost the key $77,500 support level after repeatedly failing to reclaim the $79,000 to $80,000 resistance zone, printing a fresh local low near $76,796.54 as CPI approaches.
The break was accompanied by roughly $96.53M in forced BTC liquidations over the past 24 hours, based on our sources. That points to leveraged longs being flushed out, which fits the long-squeeze setup we flagged rather than a genuine bid stepping in.
What to watch now: Whether $77.5K flips to resistance on the CPI reaction, opening the door toward the lower demand zone.
Developing story update (September 11, 2026, 07:20 UTC):
In a positive development for Cronos, an additional $9.1 million has been recovered from the Tectonic exploit. This significantly reduces the outstanding unrecovered amount, providing further clarity on the incident’s financial impact.
Bitcoin continues to consolidate ahead of today’s August CPI data release, which remains a key catalyst for potential price movement. Traders should continue to monitor the market’s reaction to the inflation report for directional cues.
What to watch now: Monitor the final unrecovered amount from the Tectonic exploit and Bitcoin's reaction to the upcoming CPI data.
Developing story update (September 11, 2026, 06:32 UTC):
Two fresh data points sharpen the pre-CPI picture for traders. Spot Bitcoin ETFs in the US have now pulled in roughly $723.5 million in net inflows so far this month, even after one outflow day, based on our sources. That steady demand sits against a spot price still holding the $77,000 area and testing $78,000 support.
On-chain positioning has also cooled: the sell-side risk ratio has dropped to about 7 basis points, down from 16 at August’s peak. Lower sell-side risk typically signals that realized profit and loss activity is quieting, which can precede sharper moves once a catalyst like today’s CPI print lands. Retail sentiment remains in greed territory while leveraged longs stay exposed, so a hotter reading could still hand whales the liquidity to push lower before any sustained bounce.
What to watch now: Whether ETF inflows hold after the CPI print, or reverse if the number comes in hot.
Developing story update (September 11, 2026, 06:10 UTC):
The macro calendar just got heavier. Beyond today’s CPI print, both the Federal Reserve and the Bank of Japan are now scheduled to deliver policy decisions on September 16, based on our sources. That turns the next five sessions into a back-to-back catalyst window rather than a single data event, and traders should size positions accordingly.
Bitcoin is now probing the $78,000 support level after the earlier consolidation nearer $80,000. Price action stays inside the $77k to $80k range, so this is a support test rather than a breakdown, but a soft CPI bounce could still be capped ahead of the September 16 decisions.
What to watch now: Whether $78k support holds into CPI, then how BTC positions ahead of the Fed and BoJ decisions on September 16.
Developing story update (September 11, 2026, 05:05 UTC):
Update: fresh demand data shows US spot Bitcoin ETFs now sitting at roughly $723.5 million in net inflows so far this month, based on our sources. That is a real bid running underneath price even as BTC holds below the $80,000 resistance into today’s CPI print.
On-chain positioning has also cooled: a sell-side risk ratio has eased to about 7 basis points, down from 16 at August’s peak, based on our sources. That points to lighter profit-taking pressure than last month, though it does not remove the CPI event risk still scheduled for 8:30 a.m. ET.
For traders, the active line has tightened to the $78,000 support retest, with BTC near $77,091 and up about 0.3% in the last hour. A softer inflation read could spark a bounce, but on our read that likely offers distribution into strength rather than a confirmed reversal.
What to watch now: Whether $78,000 support holds through the 8:30 a.m. ET CPI print and if ETF inflows keep building.
Developing story: This story is still unfolding. We are tracking it and will update this article as more details are confirmed.
Market briefing: Bitcoin traded near 76,916 dollars, down about 1.8 percent, as markets braced for the August CPI print with Fed hike odds above 73 percent and an APT supply unlock adding pressure.
- August CPI lands today at 8:30 a.m. with Fed hike odds already above 73 percent
- BTC sits near 76,916 dollars, a whisker above 76,800 support, resistance at 79,600
- 11.31 million APT unlock adds tradable supply as ETF inflows hold at 723.5 million this month
Source: U.S. Bureau of Labor Statistics
Bitcoin is pinned to 76,800 support as the August CPI print lands and 11.31 million APT tokens unlock. Is this smart money distributing into retail, or a bear trap?
Bitcoin is walking into the most watched data print of the month, and it is doing so from a position of weakness. The August Consumer Price Index, or CPI, lands today at 8:30 a.m., and traders have spent the week bracing for it. BTC changed hands near 76,916 dollars, down about 1.8 percent on the day, sitting a whisker above the 76,800 support everyone is watching.
The setup did not appear out of nowhere. Recent producer price data pushed the odds of another Fed rate hike above 73 percent. Rising rate expectations tend to lift yields, and Bitcoin has been trading in sympathy with yields for weeks. A hot inflation number would only harden that hawkish tilt.
Two altcoin stories add to the pressure. Roughly 11.31 million APT tokens unlock today, dropping fresh tradable supply into a nervous market. Cronos, meanwhile, recovered 111.2 million dollars, a headline that reads better than it trades.
Here is the honest part. There is no single confirmed catalyst forcing price lower right now.
What we have instead is a convergence: a macro data risk, more coins to sell, and a market that has already lost its nerve. We should be careful not to confuse a busy calendar with a clear cause. Markets love a tidy story, and today offers three.
Still, the structure matters more than the narrative. ETF flows stayed positive this month, yet price drifted toward support anyway. That gap between demand headlines and price action is exactly what we want to examine.
Rate expectations now steer every crypto bid
The transmission runs straight from a single data point to your Bitcoin position. CPI measures how fast prices rose last month. A hotter reading tells the Fed inflation is not tamed, which raises the odds of tighter policy. Tighter policy means higher yields, and higher yields pull money away from risk assets like Bitcoin.
That is why a backward-looking inflation figure can move a forward-looking crypto market in seconds. Traders are not pricing last month. They are pricing what the Fed does next.
The producer data already did half the work. It lifted hike odds above 73 percent, so the market walked in leaning hawkish. A soft CPI would relieve that pressure. A hot one simply confirms the fear the market is already carrying.
Rising oil prices sit underneath all of this. Energy feeds directly into inflation, and it has been climbing. That keeps the hawkish case alive even if today's core number cools.
For Bitcoin specifically, the correlation with yields is the whole game right now. When yields rise, leverage gets more expensive and the marginal buyer steps back. BTC has tracked that logic closely. So the CPI print is not really about consumer prices. It is about liquidity: whether the cost of money rises, and whether the last discretionary dollars keep flowing into crypto or quietly retreat.
From Bitcoin support down to leveraged alts
If CPI runs hot, the liquidity squeeze moves in a predictable order. Bitcoin leads, because it is the most liquid and the first thing large players trim. A break below 76,800 support would hand momentum to sellers and expose lower levels quickly.
BTC sets the tone, and everything else follows with a lag and a multiplier. Ethereum typically drops harder than Bitcoin in a risk-off move, as leveraged longs unwind and open interest, or OI, gets flushed.
Then come the alts, where the damage compounds. This is where today's supply story bites. The 11.31 million APT unlock adds sellable coins precisely when buyers are scarce. New supply into thin demand is rarely kind to price.
Cronos shows the other side of the coin. Recovering 111.2 million dollars is a real operational win, yet a single good headline does not reverse a market-wide risk-off tide. Structure beats press releases.
The deeper worry is stacked leverage. When BTC slips through a defended level, cascading liquidations can drag the whole board down together, correlations snap to one, and diversification stops helping exactly when you need it.
Against all of this sits 723.5 million dollars of net ETF inflows this month. That is genuine demand, and it cushions the downside. But it has not stopped price from drifting toward support, which tells us who is quietly selling into that demand.
The 76,800 line decides the next leg
The 76,800 support line is the whole story for the next few sessions. Hold it on a hot CPI, and the bearish case weakens fast, because it would mean sellers threw their best punch and price refused to fall. That is the invalidation we respect most.
Lose it on rising volume, and the path opens toward lower local lows. A clean break with follow-through, not a quick wick, is what confirms genuine distribution rather than a stop hunt.
Watch how price behaves in the first hour after 8:30 a.m. The initial spike often traps the impatient. The real move frequently comes on the second reaction, once the algorithms finish and humans decide.
On the upside, 79,600 dollars is the first major resistance. A soft CPI could spark a relief rally, but we would treat a stall into 79,600 with suspicion. Bullish news that cannot clear resistance often marks distribution, not breakout.
Keep an eye on open interest and funding through the print. A sharp OI drop alongside a price bounce signals a short squeeze, which fades. A steady bid with flat funding is healthier.
Finally, track whether ETF inflows continue after today. Persistent demand under 76,800 would suggest smart money is stepping in low. Sudden outflows would confirm the fear. The data prints in hours. The reaction is what actually matters.
Reading the support retest through smart money
The ParadiseTeam reads this as a market being tested at support rather than one that has broken. BTC near 76,916 dollars sits right on the 76,800 shelf, and how it defends that shelf through the CPI print tells us who is really in control.
Our higher timeframe bias leans cautious into this event. The convergence of a hawkish data risk and the APT unlock argues for supply pressure, and the consolidation around 77,000 looks more like a retest than a base.
Here is the mechanism that matters. Retail sentiment reads strong while price drifts lower, which usually means professionals are selling into that confidence. When the crowd feels good and price does not follow, someone is quietly offloading. That is why we treat a stall into 79,600 dollars as a place to reduce risk, not chase. Resistance rejections after bullish headlines are classic distribution.
The flip side keeps us honest. If 76,800 holds while retail panics and ETF inflows persist, the same picture inverts, and accumulation becomes the more likely read. Levels, not stories, decide it.
For structure, the ParadiseTeam watches 76,800 as the pivot and 79,600 as the ceiling. A daily close beneath support shifts probability toward lower lows. A reclaim of 79,600 on volume would force us to rethink the bearish lean. Risk-to-reward, or R:R, only favors patience here.
Track it live: our live crypto funding rates and the Crypto Fear and Greed Index both update in real time, so you can watch this shift for yourself.
Related coverage
For exact entries, targets, and stop losses with full risk management, that is what ParadiseFamilyVIP is for. New to reading these moves? Start with our crypto trading strategies guide.
ParadiseTeam is monitoring the market situation closely, and we are taking these developments into consideration while building our trading tactics inside ParadiseFamilyVIP.
Crypto trading involves substantial risk. Prices are volatile and you can lose money. This article is educational and is not financial advice. Past performance does not guarantee future results.









Join the discussion 4
it's funny how a good chart really makes these cpi days feel a bit less like guesswork, feels clearer somehow ✨
love a clean chart with some honest levels, reminds me of a well-designed UI when the structure just clicks! ✨ that 76,800 is a big one.
i see a lot of noise there with that 76,800 level. its not cleanly defined enough for a reliable trade plan.
i hear ya on the UI feel... but i actualy think 76,800 might be more of a testing point than solid support for now... 🤔