

Listen: the breakdown
Developing story update (October 14, 2026, 13:42 UTC):
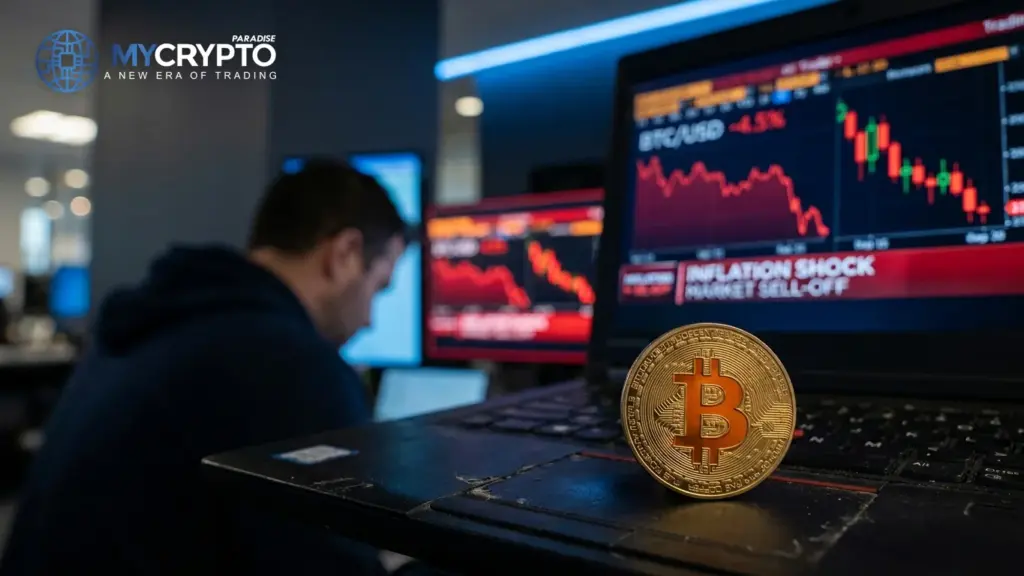
U.S. inflation rises to 3.7% in September, above expectations of 3.6%, sending bitcoin (BTC) sharply lower and raising the prospect of further Fed rate hikes.
Developing story update (October 14, 2026, 13:30 UTC):
Fresh detail on the print: alongside the 3.7% year-over-year headline, U.S. CPI rose 0.6% month-over-month in September, a hotter sequential pace that reinforced the move. In the first minutes after the release Bitcoin shed roughly $1,000, sliding from about $83,800 to $82,800 before steadying in the low $82,000s.
The selloff was not purely a CPI story. Bitcoin was already under pressure from spot ETF outflows, rising U.S. bond yields, and a firmer dollar, so the hot inflation read landed on an already-soft market rather than a strong one. That combination raises the probability of follow-through if sellers stay in control.
The level to watch is unchanged. Holding the $82,000 support zone keeps this in shakeout territory and points to supply being absorbed, while a sustained break below it would likely open further downside.
What to watch now: Whether $82,000 support holds or breaks on a sustained close as ETF outflows and yields stay elevated.
Market briefing: Bitcoin slipped below $83,000 after U.S. headline inflation printed a hot 3.7%, the third-highest reading since September 2023. BTC was trading near $82,806, down about 0.5% on the day, as traders priced more Fed tightening.
- U.S. headline inflation hit 3.7%, its third-highest reading since September 2023, hotter than expected.
- Bitcoin dipped below $83,000 and traded near $82,806, down roughly 0.5% on the day.
- Traders ramped up Fed rate-hike bets, tightening the liquidity outlook for crypto.
Source: U.S. Bureau of Labor Statistics
A hot U.S. CPI print pushed Bitcoin below $83,000 and revived Fed rate-hike fears. But if this Bitcoin CPI selloff is so bearish, why is support still holding?
Hotter-than-expected U.S. inflation hit the market, and Bitcoin answered fast. BTC slipped below $83,000 within hours of the print. By our read it was trading near $82,806, down roughly 0.5% on the day.
The number that moved it was headline inflation at 3.7%. That is the third-highest reading since September 2023. For a market that had penciled in easier policy, it landed like cold water.
Traders reacted by pricing more Fed tightening, with some bets now stretching the rate path toward 2027. Higher-for-longer rates drain liquidity from risk assets. Crypto sits at the far end of that risk curve, so it felt the move first.
Here is the part the headlines skipped. The selloff was loud, the actual damage was modest. A sub-1% daily drop is not a collapse, however the alerts described it.
Bitcoin even ticked slightly higher in the last hour, holding just above the $82,000 shelf that bulls have defended for days. The crowd read panic. The tape read absorption.
That gap between the story and the chart is the real news. Hot inflation is genuinely bearish for liquidity, and we respect that. But a market that refuses to break on bad news is telling you something about who is buying. Smart money tends to welcome a scary print at support, because it lets them buy from nervous sellers at a discount. Retail, meanwhile, sees the word plunge and reaches for the exit. This Bitcoin CPI selloff is testing exactly that fault line now.
Hot inflation reshapes the rate path
The mechanism here is simple, and it starts with the CPI print. Consumer price inflation at 3.7% tells the Federal Reserve its job is not done. When inflation runs hot, the central bank keeps rates high or lifts them further.
Higher rates raise the cost of money everywhere. Safe assets suddenly pay more, so capital has less reason to chase risk. That repricing hits the most speculative corners first, and crypto lives there.
The 2027 angle matters too. Markets had been leaning on future rate cuts to refill the liquidity tank. A 3.7% reading, the third-highest since September 2023, pushes that relief further out.
Tighter liquidity is the real headwind, not the headline word plunge. Less cheap money means fewer buyers willing to bid aggressively. Order books thin out, and the same selling pressure moves price further than it would in a flush market.
For Bitcoin, this is a familiar force. BTC trades as a high-beta liquidity gauge, so it amplifies macro shifts in both directions. When the liquidity story turns cautious, BTC usually feels it before equities do.
So the honest read is that hot CPI is a genuine macro negative. This is not fabricated fear. Yet a confirmed macro negative that fails to crack a defended support says the selling is being met by patient demand. That tension is what makes this inflation print worth your full attention.
Tighter liquidity presses the risk ladder
The liquidity hit travels in a predictable order, and Bitcoin is the first stop. BTC took the CPI blow directly, sliding under $83,000 before steadying near $82,806. As the deepest, most liquid coin, it absorbs the first wave of macro selling.
Ethereum sits one rung down the risk ladder. When rate fears tighten liquidity, ETH typically falls a little harder than BTC. Thinner support means it has less of a cushion against a liquidity squeeze.
Alts are the sharp end. Lower-cap tokens carry the least liquidity, so a macro scare drains them fastest. In a hot-CPI tape, capital rotates toward safety, and the smallest names bleed first.
Here is the nuance that keeps this from being a clean rout. Open interest, the total value of outstanding futures contracts, sits near a low. OI (open interest) that low means little leverage is stacked up to force a cascade.
Funding rates are also near their 90-day baseline. That tells us the crowd is not crowded long, so there are fewer forced sellers to feed a spiral lower.
So the bearish macro impulse is real, but the fuel for a violent liquidation is thin. Price can still grind lower on sentiment alone. What is missing is the leveraged powder keg that turns a dip into a crash. For now, the cascade looks orderly rather than panicked, which is rarely how a genuine plunge behaves.
The $82,000 shelf decides the next leg
The $82,000 level is the line that decides this. Bulls have defended it for days, and it held through the CPI shock. A clean, sustained break below it would confirm the bearish macro read is winning.
Watch how price behaves on any retest. A quick wick below $82,000 that snaps back is absorption, meaning buyers are stepping in. A slow, heavy close under $81,000 is something else, and it would open the door lower.
To the downside, losing $81,000 is the real warning. That is the lower boundary of the support band. Below it, the defended structure breaks and the liquidity story earns a point.
To the upside, reclaiming and holding above $84,000 would flip the script. It would say the market shrugged off the inflation scare faster than the alerts did. That is the near-term invalidation of the bearish case.
Keep an eye on the momentum picture too. The Stochastic RSI, a momentum oscillator, has been trying to climb out of oversold territory. If it turns back down here, it supports the cautious macro read.
Finally, watch volume on any move. A break lower on heavy volume is conviction. A drift lower on thin volume is often just nervous retail selling into patient hands. The difference tells you whether this CPI selloff has real legs, or is simply noise dressed up as a crisis.
Smart money's answer to the inflation scare
The ParadiseTeam is watching the $82,000 support as the whole story right now. With BTC near $82,806, this CPI print is a stress test of that level, not a new trend. The question is who blinks first.
Our standing lens leans short-term bullish continuation, and the structure under price supports that. Whales opened a roughly $37M long near $82,300, and that zone has flipped from resistance to support. Buyers near 60% against 34% sellers suggests smart money is absorbing this dip, not fleeing it.
Retail, by contrast, is reading the plunge headline and sitting neutral to fearful. That is usually the backdrop for accumulation: scary news, defended support, low leverage, and a crowd that is not greedy.
Stops matter here. A pile of sell stops likely sits just under $82,000 and $81,000. A hot-CPI wick that sweeps them, then reclaims, would be classic smart-money behavior, using the fear to fill longs cheaply.
Our caution is honest, though. The macro impulse is bearish, and strength still has to clear real resistance. $84,000 is the prior high, $84,500 our noted profit zone, and $90,000 looms with a roughly 60% rejection probability. Good news into that wall can quietly become distribution.
So the ParadiseTeam keeps the risk simple. Either $82,000 holds and this print ages as a dip, or $81,000 breaks and the bears earn their case.
The read behind this: we framed this story through our own market analysis, Bitcoin at $82K: Can Bulls Defend It?
Track it live: our live crypto funding rates and the crypto liquidation heatmap both update in real time, so you can watch this shift for yourself.
Related coverage
For exact entries, targets, and stop losses with full risk management, that is what ParadiseFamilyVIP is for. New to reading these moves? Start with our crypto trading strategies guide.
ParadiseTeam is monitoring the market situation closely, and we are taking these developments into consideration while building our trading tactics inside ParadiseFamilyVIP.
Crypto trading involves substantial risk. Prices are volatile and you can lose money. This article is educational and is not financial advice. Past performance does not guarantee future results.
Does BTC reclaim $84K before it loses $81K?
Settles on BTC's first hourly close above $84,000 or below $81,000, at the latest Wed 21 Oct.
This is how 4 Paradisers are calling it. Tap your call.
No calls on this one yet. Tap yours to be the first.
Free account, no password. Members just sign in.
An education game, not trading advice.












Join the discussion 1
I understand the inflation print makes sense for a selloff, but I'm still wondering why it stalled exactly at that support level mentioned. Is that just a coincidence or is there something more?