



In short: The Wyckoff Method reads price, volume, supply and demand to reveal whether buyers or sellers are gaining control. It is a framework for interpreting market behaviour, not a prediction tool. Wait for price to confirm before acting, and always define your invalidation.
The Wyckoff Method reads price and volume together to reveal whether buyers or sellers are gaining control. It is a framework for interpreting market behaviour, not a crystal ball.
Rather than labelling schematics, it asks a simpler question. Is trading effort actually producing a result? This lesson shows you how to read that shift in supply and demand.
What the Wyckoff Method Is
The Wyckoff Method is a technical analysis framework built around price, volume, supply, demand and market structure. It focuses on how large participants build and unwind positions.
It was developed by Richard Wyckoff in the 1930s for traditional markets, and its core ideas still apply to liquid crypto assets. You can read the background on Investopedia.
Picture Bitcoin falling toward support as volume expands. High volume alone confirms nothing. The key is what that activity achieves.
If heavy selling pushes price below support, it holds there, and another decline follows, sellers are producing results.
But if selling turns extreme while price barely makes a new low before reclaiming support, the message changes. Sellers are spending effort for little downside.
If the next decline weakens further and buyers break bearish structure, evidence of a shift in control grows. Measure the effort, weigh the result, then wait for confirmation.
The Composite Man
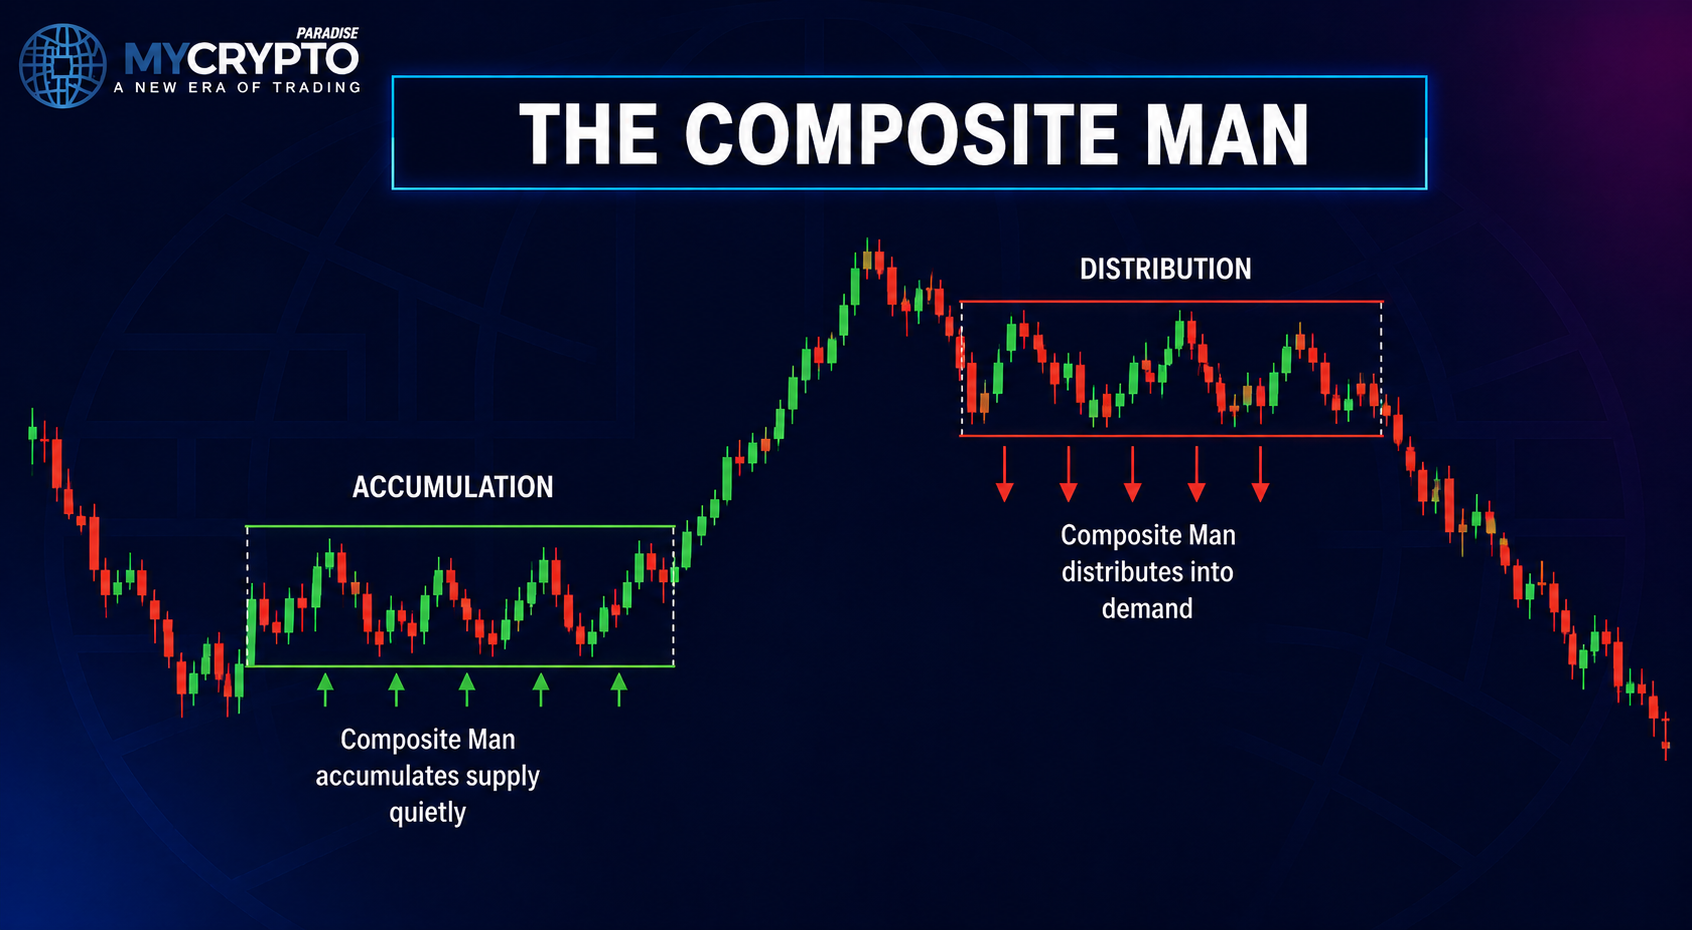
The Composite Man is a mental model for how large professional participants operate. It does not claim that one whale controls the entire market.
Liquidity and Large Participants
Large positions need liquidity. Major participants cannot buy or sell size at once without moving price against themselves.
This is why wide trading ranges matter. They can be the areas where substantial positions quietly change hands.
Accumulation and Distribution
During accumulation, large players may absorb supply before a markup. During distribution, they may release positions into demand before a markdown.
Reading Breakouts and Breakdowns
A brief move below support is not automatically bearish. A push above resistance is not automatically bullish.
What matters is the reaction. Acceptance and continuation show strength, while a fast return inside the range signals rejection. Sentiment tools like the crypto fear and greed gauge add useful context here.
The Wyckoff Price Cycle
The price cycle explains how markets rotate through phases as supply and demand shift. Each phase shows which side is gaining control.
Accumulation
Accumulation develops after a decline as selling weakens and supply is absorbed. Demand slowly strengthens.
Markup
Markup begins when demand takes control and price breaks higher. Higher highs and higher lows tend to form.
Distribution
Distribution develops after an advance as buying weakens and supply increases. The trend starts losing strength.
Markdown
Markdown begins when supply takes control and price breaks lower. Lower highs and lower lows tend to form.
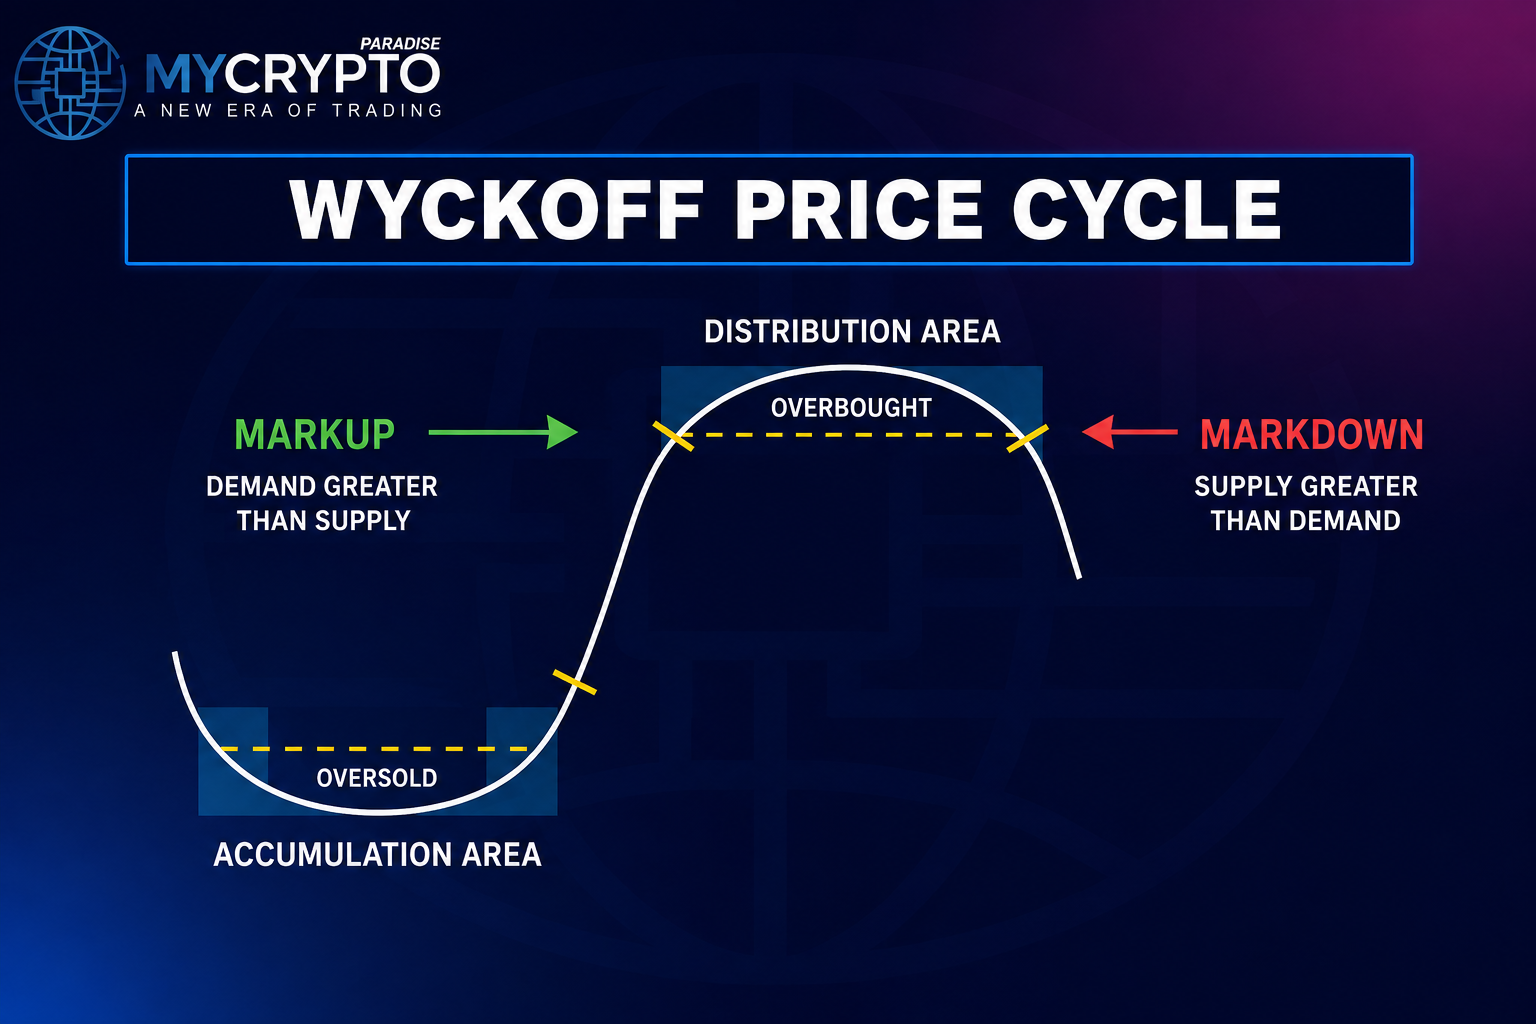
Together these four phases form the full cycle. They give a structured view of how trends develop, mature and turn.
The Three Laws of Wyckoff
Wyckoff rests on three laws: Supply and Demand, Cause and Effect, and Effort versus Result.
Supply and Demand
When demand exceeds supply, price tends to rise. When supply exceeds demand, price tends to fall. Analysis focuses on where that balance begins to shift.
Cause and Effect
A trading range builds the cause. The move that follows is the effect. A decisive breakout with acceptance helps confirm the direction.
Effort versus Result
Volume is effort and price movement is result. Strong volume with strong movement supports the trend. High volume with little progress warns that one side is tiring. Reading crypto funding rates can sharpen this read in derivatives.
Wyckoff Market Structures
Wyckoff names four range structures. Each shows how the balance develops before a reversal or a continuation.
Accumulation
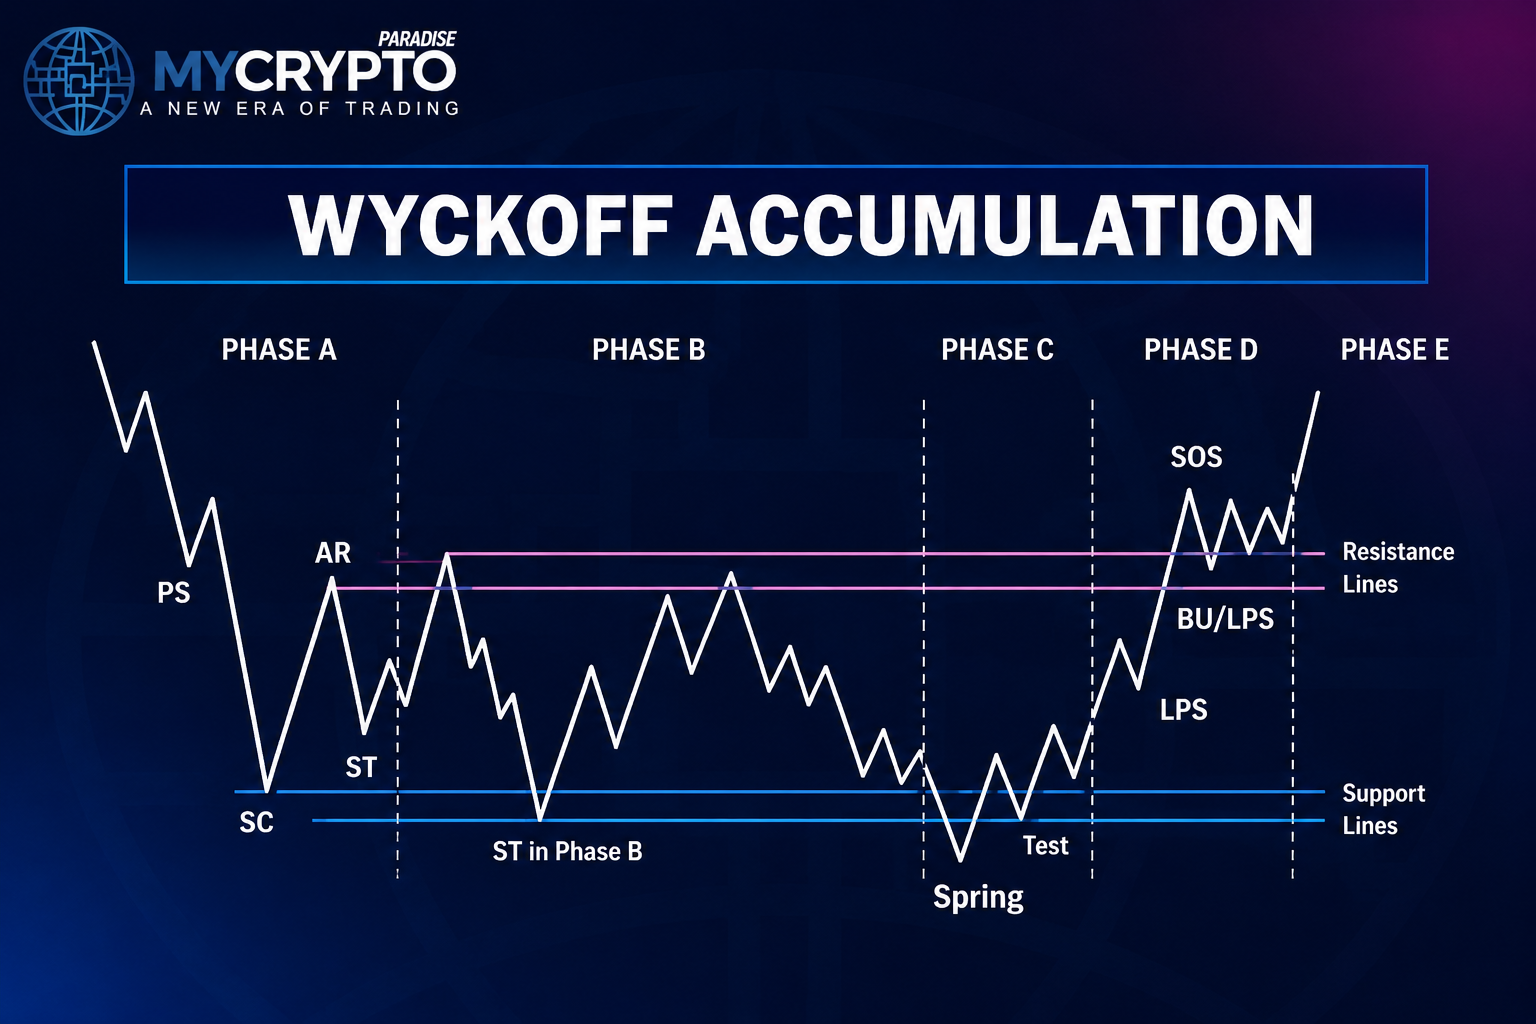
This forms after a long decline as selling fades. Failed breakdowns, Springs and stronger recoveries hint that sellers are losing control.
Distribution
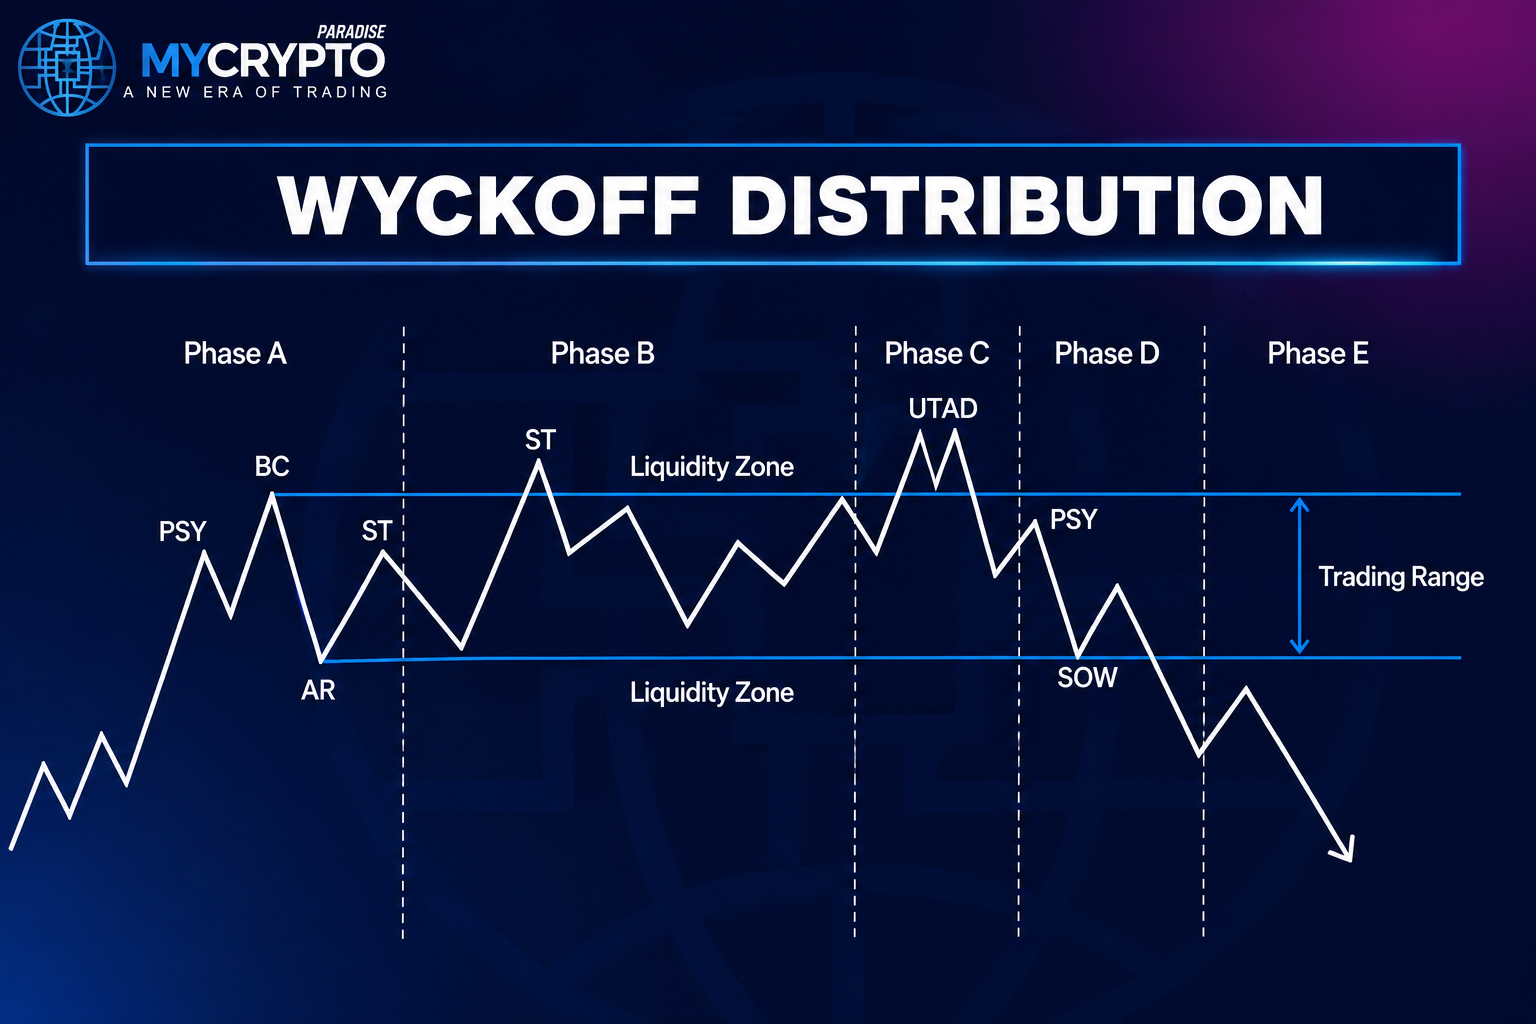
This forms after a sustained advance as buying fades. Failed breakouts, Upthrusts and weak rallies hint that demand is losing control.
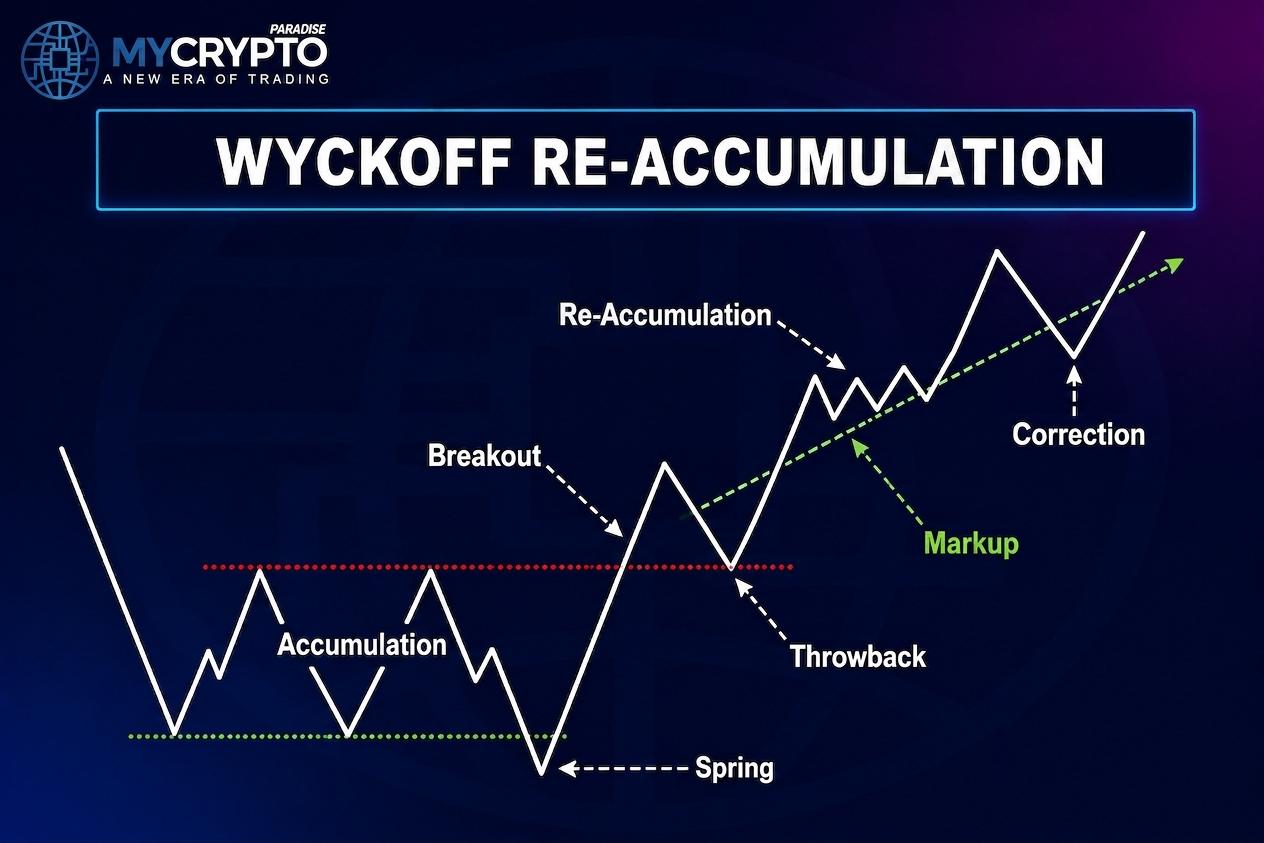
Reaccumulation
Price pauses inside an uptrend. Supply is absorbed while demand rebuilds, and acceptance above resistance can support continuation.
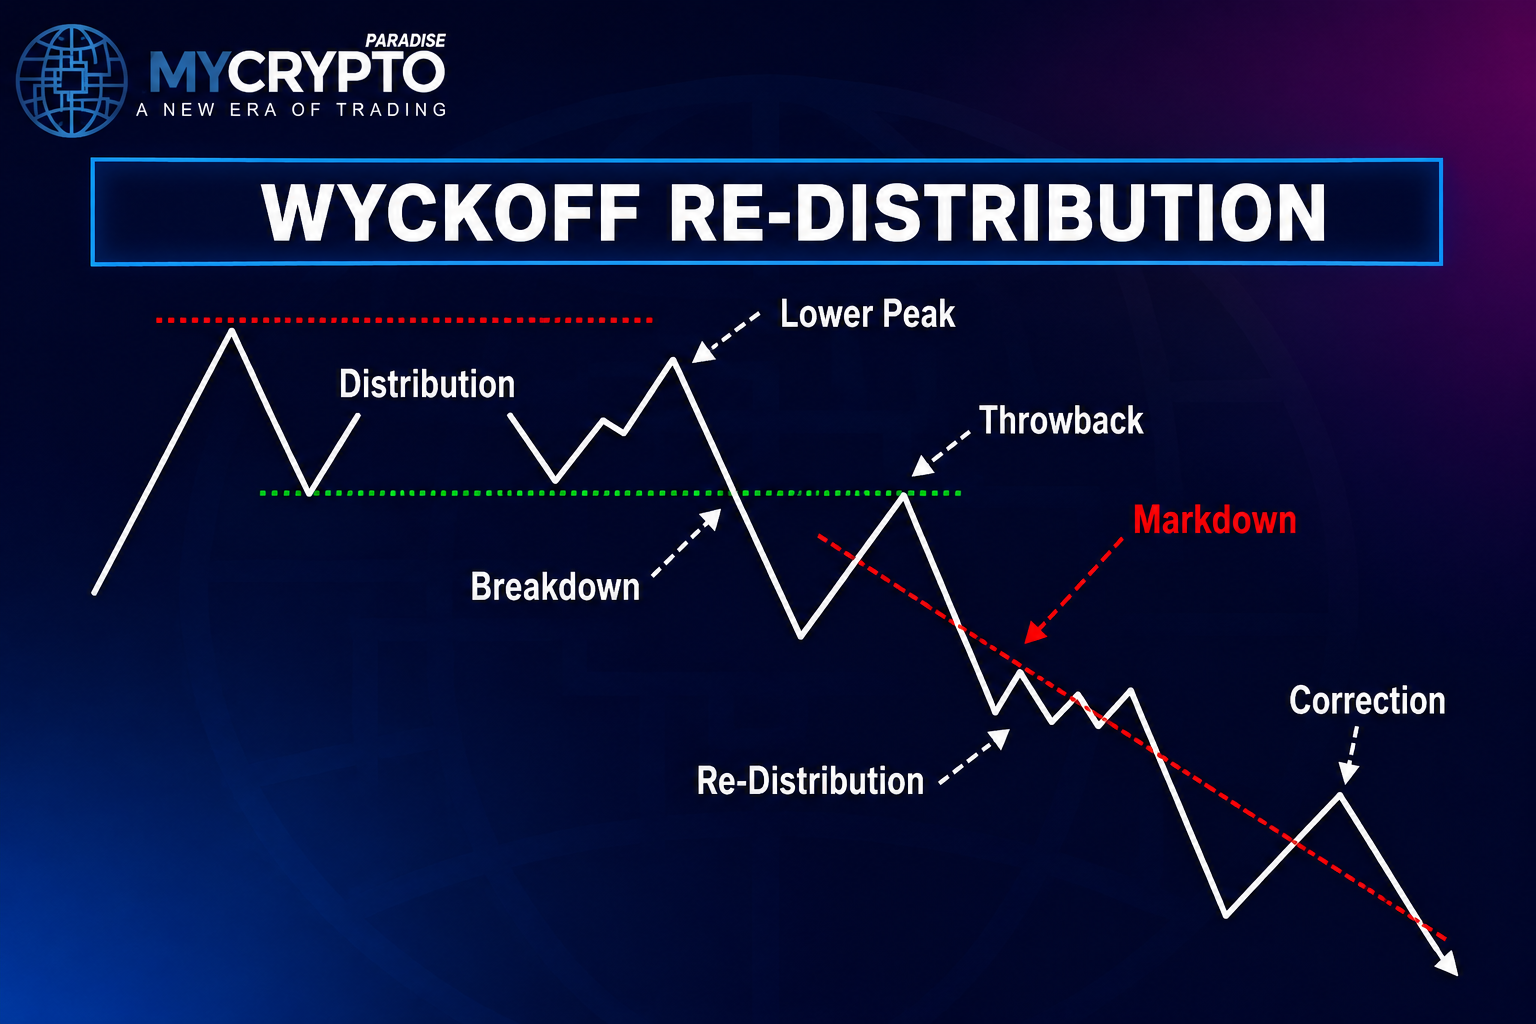
Redistribution
Price pauses inside a downtrend. Demand stays too weak to overcome supply, and a confirmed breakdown can extend the fall.
Volume Analysis in Crypto
Crypto has no single volume source. Bitcoin trades across all major exchanges, so one venue shows only part of the activity.
For that reason, relative changes in volume often matter more than absolute figures. Compare volume against the price move it produces. A crypto liquidation heatmap can show where forced orders sit.
Wyckoff and Other Frameworks
Traditional analysis maps support, resistance and trends. Wyckoff studies the supply and demand behind those levels.
It also pairs well with Smart Money Concepts. A Wyckoff Spring can be a sweep of sell-side liquidity, and both frameworks agreeing makes a case stronger. Compare it with Elliott Wave theory for structure, or with a bullish engulfing pattern at support.
Common Mistakes
- Calling every range accumulation. It may be distribution or plain consolidation. Let price and volume set the bias.
- Treating every sweep as a Spring. Look for rejection, recovery and weakening supply first.
- Over-labelling the chart, which creates false precision and reduces clarity.
- Reading high volume as automatically bullish or bearish.
- Entering before confirmation that one side has control.
- Ignoring invalidation when price contradicts the thesis.
Practice This
Open a daily Bitcoin chart and mark one clear trading range. Note where volume expanded and what price did next.
Ask whether effort matched result. Then define a single invalidation level before you would ever consider acting.
Is Wyckoff Reliable for Crypto?
Wyckoff does not predict every move. Accumulation can fail and Springs can break down.
Its value is a structured way to read behaviour and wait for confirmation. Discipline and clear invalidation stay essential on every setup.
At MyCryptoParadise, a professional crypto signals and trading-education service operating since 2016, we teach Wyckoff alongside Smart Money Concepts, liquidity and risk management. MCP University FREE keeps these lessons open to everyone.
FAQs
What does the Wyckoff Method measure?
It measures the relationship between price, volume, supply and demand. This reveals whether buying or selling pressure is actually moving price, and which side is gaining control.
What are the three Wyckoff laws?
Supply and Demand, Cause and Effect, and Effort versus Result. Together they explain price movement, how ranges prepare a move, and whether volume is producing a result.
Does Wyckoff work for crypto?
Its principles apply to liquid assets like Bitcoin and Ethereum. Because volume is spread across venues, relative volume changes usually matter more than absolute figures.
Which timeframe suits Wyckoff analysis?
Higher timeframes like the 4-hour, daily and weekly give clearer structure. Lower timeframes can refine confirmation and execution once the bias is set.
Can Wyckoff predict Bitcoin's next move?
No. It builds probability-based scenarios, not guarantees. Confirmation, invalidation and risk management stay essential on every setup.
Crypto trading involves substantial risk and is not suitable for everyone. Nothing here is financial advice; it is education only. Never risk more than you can afford to lose.














Join the discussion 3
always wondered how much of the smart money component of Wyckoff can be approximated by tracking open interest and perp basis. its a bit different right
Tobias, the funding rates on perps can give a good read too, no? 🤔 Always watching for those dips. 👀⬇️
Yeah, Wyckoff on the smaller timeframes is where it gets spicy 🔥 - always looking for that accumulation with volume spikes. You know? 📈🤔