

• Bitcoin and altcoins dropped as oil spiked above $103 following Trump’s escalation remarks on Iran
• No mention of ceasefire or peace increased geopolitical risk and inflation fears
• Rising oil strengthens the dollar and delays rate cut expectations, pressuring crypto liquidity
When markets expect peace but get escalation instead, what happens to risk assets like Bitcoin and several other altcoins??
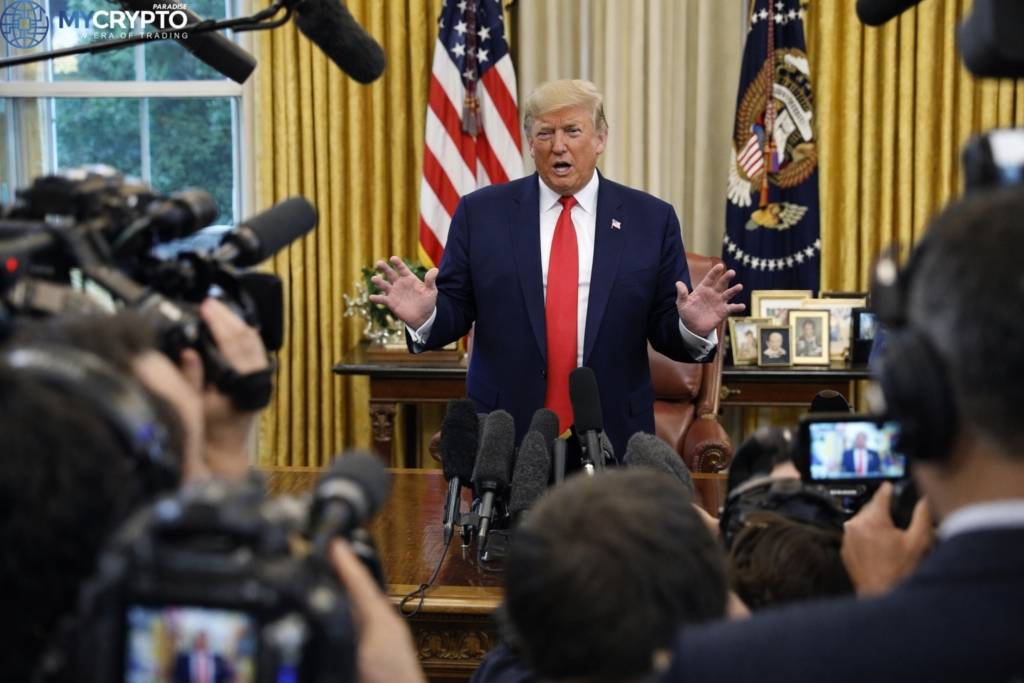
Crypto markets weakened after Donald Trump delivered a 19-minute speech signaling continued military escalation with Iran, with no mention of ceasefire or peace negotiations.
Trump warned that U.S. operations could continue for another two to three weeks and suggested further strikes on Iranian infrastructure if no agreement is reached. He also stated the U.S. would not rely on oil passing through the Strait of Hormuz.
Markets reacted immediately. Oil prices surged more than 6%, moving above $103 and even touching $106 in some reports, reflecting expectations of prolonged disruption in global energy supply.
Bitcoin dropped below $67,000, while Ethereum fell toward $2,045 from over $2,100. Major altcoins including Solana, XRP, and BNB recorded losses, with SOL declining over 6% and extending its weekly drop to 11%.
Equity markets also weakened, with the Nasdaq down 1.40% and the VIX rising, signaling increased uncertainty. The U.S. dollar strengthened as risk appetite declined across global markets.
Interestingly, in Simon’s recent analysis, he specifically pointed out that a rejection around the $69K zone would likely lead to downside pressure, which is now playing out almost precisely as expected, was this triggered by market liquidity or geopolitical pressure? watch the analysis for further insights.
Why Trump’s Iran Speech Matters for Crypto
This is not just about geopolitics. It is about liquidity.
Rising oil prices feed directly into inflation expectations. Higher inflation reduces the likelihood of interest rate cuts, and fewer rate cuts mean tighter financial conditions.
Crypto thrives on liquidity. When liquidity expectations weaken, Bitcoin and altcoins tend to follow.
The absence of de-escalation language matters more than the escalation itself. Markets were positioned for relief. Instead, they got uncertainty. That mismatch is what drives sharp moves.
Market Impact of Oil Surge and Crypto Sell-Off
The immediate impact is classic risk-off behavior.
Oil up, dollar up, crypto down. It is almost mechanical at this point.
Bitcoin is now struggling below resistance near $69,400, forming lower highs and lower lows. Key support sits around $65,700 and $64,900.
Ethereum is hovering near $2,010 support, with deeper downside levels near $1,905 and $1,736 if weakness continues.
Data shows growing open interest in $80,000 BTC call options for May 2026, suggesting longer-term positioning remains bullish even as short-term sentiment deteriorates.
The Fear and Greed Index sitting at 12 confirms the mood. Extreme fear is not subtle.
What to Watch Next After Trump’s Speech
Watch oil. It is the leading indicator right now.
If oil continues climbing, inflation fears will stay elevated and crypto could remain under pressure. If oil stabilizes or drops, risk assets may find relief.
Watch geopolitical headlines closely. Markets are reacting faster to political statements than to economic data.
Also monitor rate expectations. Any shift back toward rate cuts could quickly reverse sentiment.
Finally, watch Bitcoin’s key support levels. A break below $65K could trigger further downside, while holding that level may stabilize the market.
Insights for Traders on Crypto Sell-Off
Smart money is not panicking. It is repositioning.
Institutional players are likely reducing short-term exposure while maintaining long-term optionality. The buildup of $80K call options suggests they still expect upside, just not immediately.
The second-order effect is where things get interesting. Sustained geopolitical tension pushes capital into oil and defensive assets first, but eventually forces central banks into difficult positions. If growth slows while inflation stays high, policy responses can become unpredictable, and that volatility often finds its way back into crypto.
Traders should think in layers. Short-term, this is a headline-driven market. Medium-term, it is a liquidity story. Long-term, it is still a structural adoption trend.
The edge lies in not confusing the three.
ParadiseTeam is monitoring the market situation closely, and we are taking these developments into consideration while building our trading tactics inside ParadiseFamilyVIP.
Video transcript
Auto-captioned from the video audio and lightly cleaned. It is what was said, not a written article; for the structured breakdown read the sections above.
A lot of people keep asking us when the Bitcoin bottom going to form and we always tell them to form a true bottom in Bitcoin, there needs to be a bloodbath among long-term holders that includes Bitcoin miners. We have not seen such a capitulation just yet.
So, does it mean that Bitcoin will need to see one more major crash? Let's analyze the probabilities. >> My Crypto Paradise. >> Yo, ladies and gentlemen of Paradise Cup. This is Salmon from My Crypto Paradise. Welcome back. It's great to be here. Today is Tuesday and that means that you are watching the first video of this week.
First of all, let's recapitulate what we have been going through together in the previous videos. So, first of all, we have been expecting that Bitcoin will start crashing from $74,000 towards our support zone right here that had its lower boundary at $65,000. We have been expecting $65,000 to hold because we have been watching this buy wall that's been created by $67 million in bids.
So, this $65,000 buy wall held and we have been expecting afterwards what's going to happen next. After that, we will see some price action to the upside because we have understood that Bitcoin will start seeing a nice breathing pattern of a first wave and then a higher degree secondary wave, right?
So, in the last video, we have been actually expecting that Bitcoin will start recovering and we have been taking a look at $69,000 as the next important resistance. Previously, we have been looking for $74,000, but in the last video, we have been actually getting the resistance, the main resistance on low time frame perspective a little bit lower to $69,000 and we will be talking if this resistance is still intact in this
video and what I do expect from the macro time frame. So, we can get back to this adjusted net unrealized profit and loss because this is extremely understand to understand if we want to has a high probability of buying a long-term bottom. You can see that in the bear market in 2018, 2019, and also in the bear market that happened during 2022 and 2023, we have been seen a huge capitulation from
long-term holders where also the Bitcoin miners are counted in. And Bitcoin miners are always playing a big role in the distributions of Bitcoins in losses and creating these macro bottoms because the Bitcoin miners are huge players in the crypto space, right? And if you take a look at the context of the current global situation, we also know that some of the Bitcoin miners, the smaller ones, are having right now a very
tough time during the increasing energy crisis, right? So, they need to pay much more expensive bills, and the smaller miners are actually starting to get pretty nervous together with Bitcoin going lower and lower, right? So, what is usually happening, what happened in 2022 bear market, is that they have been distributing their Bitcoins right here in a loss, all right?
So, this was the bottom creation. And why is that important? Because the smart money, the people that basically have a loads of money and they are just waiting to buy at the right time at the right level. They are waiting for somebody to sell to them.
When you are planning to buy billions and billions of dollars of some asset, you need somebody big to start selling to you as well, right? So, how do you create it? You can get it from retail based on manipulating the news, based on manipulating the sentiment and so forth.
And you know that the news never creates the movements, they just provide the liquidity for the big players, right? So, doesn't matter what happens in the world, it's just about liquidity. The market would dumped anyway, the market would pumped anyway. The news are just these kind of like things that the retail traders can then point their fingers to, okay?
And also, the news are something that really helps the liquidity to start moving. When we have a bullish news, a lot of people feel FOMO. When we have bearish news, a lot of people feel panic and they basically react on the news emotionally, right?
You know that I don't want you to get trapped here. That is why we are going deep into these kind of mechanics, what's happening behind the scenes, and we are focusing on these kind of insights and on technical analysis to make sure that our trading approach is professional and disciplined, all right?
So, what we need to understand that these bottoms are always formed by hands being exchanged, all right? The coins are moving from weak hands to strong hands. And weak hands are not just talking about the retail that is panicking. I'm also talking about the Bitcoin miners and big institutions that are forced to sell, otherwise they would basically go bankrupt or they would not be able to survive any longer, okay?
So, they need to sell in a loss, basically. And that's what the smart money are waiting for, right? The smart money has always an abundant amount of cash and they are ready to buy and they want to buy at the strategic levels. So, strategic level was in 2022 that $16,000, right?
That's This is the zone the smart money been accumulating and the Bitcoin miners and big institutions, they're being forced to sell to those smart money. So, this is how the bottom was created in 2022-2023. The bottom was likewise created in 2018-2019 the same way, right here at around $3,000, all right?
It was absolutely the same. We have been watching on this chart Bitcoin adjusted net unrealized profit and loss that a lot of big institutions, a lot of big whales are actually capitulating. They're selling their Bitcoins in losses. And we have been also watching then other data.
And we have been seeing how the hands are exchanging, how those weak hands are selling to those big hands. And the big hands are actually absorbing. The The strong hands are absorbing all that selling pressure. So, that was happening right here during the 2019 bear market.
And also right here during the 2023 bear market. We have been watching that every time. We have been watching that every time. And as you can see right now, they're not really just yet uh capitulating as hard as they have been right here, right here, or right here.
So, that makes me also think that we need to go a little bit lower. And you know that based on our technical analysis, we have the reaccumulation zone created right here at 55 to 44,000 This is the similar zone of the 2022 and 2018 that been right here.
In the current market situation, the same zone is at around 55 to 44,000 based on my analysis. So, you know, as a professional trader, however, I need to be prepared for absolutely everything. So, you know that we have been together and are distributing Bitcoin right here at around 109,000.
And then right here around 121,000. We have been distributing our Bitcoins right here at these strategic levels. And then we have been expecting that Bitcoin will start moving right here towards that zone 55 to 44,000. What we have been also discussing in the previous videos is that I'm not yet reaccumulating my Bitcoins aggressively back, right?
So, I have been reaccumulating strategically some of the Bitcoins, but before I will be able to get aggressive, I need first to see bulls either they are strong enough that they can start pushing the market to the upside, and you know that we have created the first cyclical wave right here.
Now, we are finishing the secondary cyclical wave right here, and we are preparing for the next big inhale. The market is a big organism that is inhaling and exhaling. You always want to be on the side of the trend. What if the inhales trend is stronger, you want to position yourself before the inhales.
When the exhales are stronger, you want to be positioning yourself on the exhales, right? So, right now, we are waiting for the next inhale, all right? And we want to be positioned for the inhale that will take us towards $169,000. That will be the third cyclical wave, ladies and gentlemen.
But before I will position myself for this wave aggressively, and you know that we are sharing with you not only this kind of portfolio divers ifications exactly inside of Paradise on the VIP, but also our personal trade setups. We are doing scalping, we are doing day trading, we are doing swing trading.
So, you have all of that information if you're in Paradise on the VIP live, but right now, what's important for the sake of this video to understand is that I'm waiting either for bulls to show me that they are strong enough that they can start pushing the markets towards the $169,000, or I want to see the capitulation of the long-term holders.
I want to see on the on-chain the exchange of the hands, all right? And that means I want to see Bitcoin at the zone of 55 to $44,000. This is going to be my plan B for reaccumulation. So, plan A, either the structure of Bitcoin will change, it will start becoming from bearish into a bullish, right?
And you know that for the structure analysis, we are using Elliott Wave Theory and other indications. We are also looking what the whales are doing behind the scenes, etc. So, I'm waiting for that or I want to see basically the other stuff that we have been talking about.
So, there is only plan A or plan B and I'm doing nothing in the meantime. I'm basically sitting on my hands. I'm being patient. I'm waiting for my opportunity and when the opportunity comes, I'm going to strike hard, right? So, this is what professional trading is about.
It's patient, patient, patient, waiting, waiting, waiting and then like a sniper execute a perfect accurate shots, okay? So, this is extremely important to understand, ladies and gentlemen, plan A, plan B. Let's right now have a look and zoom in into the structure. Let's have a look on the daily time frame, all right?
So, from the daily time frame perspective, you know that we are doing the breathing pattern of inhale, exhale, inhale, exhale where the inhales are much more stronger than the exhales. That means because we are also understand that these patterns are unfolding itself into five waves, all right?
We also know that with the highest probability until the structure is going to be changed, the next big inhale is going to be to the downside. And where it's going to stop from the daily time frame perspective is at our major plus key support at $44,000, all right?
So, until the structure changes from bearish into bullish on the daily time frame, I'm still expecting more downside and that is why in private zoom VIP, I'm playing with bearish trading tactics on the daily time frame, all right? So, you already know that this is a fourth wave.
We know exactly because we are analyzing the market for a long time enough and you know that I don't want you to get trapped here during this price action. That is why I'm recording for you three times a week these videos and I'm trying my best to explain to you how the structures are unfolding and we are looking deep into it together, right?
You know that my main focus is not on making money, it's on preserving the capital because I know the traders that are focusing on on long-term profitability and that are not chasing just the quick buck, that's the ones that will be able to survive the 3-year cycle, and that's the only day traders that will be successful for long term.
That means 3 years plus. Other traders that are just chasing the quick bucks, they usually get eaten by the big players. It's sad story. I have been doing this since 2016, so I have seen a lot of people going up very quickly. They have been outperforming me for a long time, for many months, but then, suddenly, in few days, sometimes even 1 week, they lost absolutely everything.
And it's always a sad story, you know? It's always a sad story. And I'm always telling them, like, if you would be focusing on your system, if you would be disciplined in your execution, and follow it step by step, you wouldn't be doing this, all right?
But a lot of people are bored with a disciplined trading system. They just want the excitement. And for these kind of people, it's actually better to go to casino, all right? Trading, however, professional trading is kind of boring, and it's, to be honest, not for everyone.
Not everyone has a big patience. Not everyone is really willing to go with a discipline and follow a boring system over and over again, and just wait for the edge, and then strike. Because 80% is pretty much nothing, and then 20% you execute, and you make a lot of money.
But 80% it's either like small loss or break even, very boring. And you need to go over and over with this. You need to You need to secure your capital. But most people, they actually prefer to have huge gains in the short run, so they are risking a lot.
They are not following some disciplined system, all right? And so, they are on this kind of roller coaster. They win big, they lose big, they win big again, then they lose big. And with this kind of approach, in the short run, they outperform me, but in the long run, the the curve goes downside, and they basically lose more than they make, all right?
And within 3 years, these day traders are no longer in the market and they're focusing on a different hobby. For me, this is not a hobby. For me, this is like a business, all right? So, I'm focusing on making sure that I'm growing my capital and I'm focusing on trading execution like if I would be building a business, all right?
That's the the important thing to understand. The best traders are not the ones that like have the best technical understanding of the market. The best traders are the ones that can really work with their mind and with their own psychology the best. This is the most important thing to understand.
So, from the daily time frame perspective, the structure is still bearish. Let's have a look on the momentum indicators. So, we are having lower high on the price action, lower high on the RSI as well. Right now, we are doing the reclaim, so we have already done that.
We have been taking a look at it in the previous videos. Breakout, retest, this is a successful reclaim. Right now, we are doing retest of the RSI trend line. Again, if we will touch it and then again start looking to the downside, it will be another nice opportunity if it's going to nicely confluence on the price action with the moving average trend line, with this resistance 1.618 Fibonacci retracement level, and with
the VPVR for increasing your short exposure. If we will have a look on the MACD histogram, we can see that we are creating higher low, higher low here as well, which is not for me a bullish divergence. We are actually having bearish cross right here.
There is nothing bullish on this. So, let's have a look on the stochastic RSI. Yes, we are in an oversold area, but you know that we have been here in 20th January for a very long time in oversold area as well. And as you can see, we have still been dumping.
A lot of people don't know how to use the stochastic RSI. It's actually to understand who is in power, right? So, right now, who is in power? Bears. So, I'm not playing with the bulls, I'm playing with the bears. Let's have a look if I I'm I keep on repeating that.
So, once the structure will start changing into bullish, how do I recognize that? Is that we will get a nice five waves structure above all of these resistances. The main resistance on the daily time frame is $82,000. If with a five wave structure we'll be able to break above all of these resistances and stake out all of the sell walls that are there, then will I be buying right here?
No, I'm not going to FOMO, right? I will not be following the bullish news that will for sure be pushing right here. So, I will be waiting actually for the nice retrace. I will wait for my confirmation that this is changing into support, and then I will be executing a beautiful, high probability, and high risk reward trade.
I will be waiting for it. I have the discipline. I have the patience, okay? I'm not trying to be here for just a month, make my money, and then go away. This is basically something that I want to do for the rest of my life, right?
And because I want to do it for the rest of my life, to stay in the game, okay? So, I'm going to wait with my patience for my confirmations, all right? I'm sorry. Somebody doesn't like it. I'm sorry. I'm waiting for my confirmations.
I'm not here to make a quick buck and go away. This I'm playing with my own capital. I'm playing with a lot of money. So, I really want to make sure that I'm playing only the highest probability trades and the trades where I can have the best risk reward, okay?
So, I'll be waiting for my confirmations. Until then, until we can have the bullish structure, I'm still playing with bearish trading tactics. I'm playing with the bears because the high probability is that we'll start pushing in the five wave towards that $44,000. Let's zoom in into the structure.
Let's have a look on four hour time frame, ladies and gentlemen. You know that if you're analyzing the market for a long enough, this is basically a negotiation between bulls and bears, but you understand that this is actually called somehow. This structure is actually pretty obvious structure that is called somehow.
If you take a look after it's been developed, you can see pretty clearly that this is a double three formation, right? Made out of WXY corrective motive structure. This was a zigzag. This was a running flat. And then we have got the double zigzag Y that finished right here at 75 to 76,000 dollars, right below our resistance right here.
And with the highest probability, the corrective motive structure, aka the higher degree fourth wave, is finished. And right now we might be creating the final fifth wave. For the fifth wave, what do we know about a fifth wave? Well, we know that a fifth wave is an inhale, and it's a motive wave structure.
That means it subdivides itself into five smaller waves. So, what do we know about it? Is that it's actually going to subdivide itself into smaller waves like this, 1 2 3 4 5, right? We know also that the inhales and exhales are differentiating themselves somehow.
The inhales in this trend are actually motive waves as well. That means they are five-wave structure, 1 2 3 4 5, and the exhales are actually three-wave structures or variations of thereof, right? So, what we have created right here is so far a first wave, then a secondary wave, which was a zigzag, right?
ABC three-wave structure. And right now we are creating the third wave, which is this one, the biggest inhale. All right, this is the biggest inhale of that five-wave structure. What can we expect from the third wave is that because the first wave was kind of short, the third wave is going to be extended.
And what do we know about extension is that the subwaves is going to be pretty recognizable, right? So, so far with the highest probability, we have created a first wave, and right now we are creating the secondary wave, right? Then we will have a third wave, and then fourth wave, and then fifth wave.
That will be the finishment of the third wave, then we will have a fourth wave, and then final the fifth wave from the higher degree perspective. What kind of stoppages of this move to the downside if that's going to happen, if you will continue to go to the downside, what kind of stoppages can we actually expect?
Where the next important supports are? Well, we have one at $60,000, which is weak for me. It's weak, but I will definitely be protecting my short exposure, my short portfolio exposure once we hit here. Maybe I will be taking some profits. It depends on the current liquidity and volatility in the markets, but I will be definitely taking some profits once we hit $55,000, $49,000, and $44,000.
And at these supports, depends on how we will be structuring the price action. I might be already taking a look at some buy trading activity. I will be taking a look at some bullish trading tactics on the medium time frame. All right? Depends on the confirmations, amount of confirmations I will be getting, but definitely I will not be shorting anymore right here.
I will be already shifting my focus into bullish trading tactics on the 4-hour time frame. So, right now, let's zoom in into this price action on the 1-hour time frame. Let me just remind you, ladies and gentlemen, that on the 4-hour time frame until we can reclaim this resistance, all right?
That means breakout, retest. The breakout needs to be with rising volume, retest with declining volume, then some base. I will not be playing along until then. If this is going to happen and we will turn this resistance into support, then I will be positioning myself into some nice high probability and great risk-to-reward trading positions on the bullish side, but until then, I'm still playing with the bearish trading tactics.
And I still I still expect that we will be visiting those supports that I have been talking about. Let's have a look at some bullish indications right now on the 4-hour time frame. So, bearish indications first. Lower highs, okay? And lower highs right here as well.
This is not a bearish divergence, but we have an exaggerated bullish divergence. As you can see, we are creating lower lows, but equal lows on the on the RSI. It's not a strong sign, but what does it mean? That the bears are pushing to the downside, but they are losing momentum.
All right? So, this is actually suggesting that right now we might go a little bit higher before we might continue to go lower. That's from lower time frame perspective. Let's have a look also on the on the MACD histogram. We can see lower high, lower high here as well.
Bullish cross, so definitely fresh short position. Right now, I don't have a confirmations for that. So, if you are not shorting from uh higher prices, right now there's no confirmation to increase short exposure. Stochastic RSI in an overbought area, and we might very soon start pushing to the downside, and that will be very nice for bears.
You know that I want to see both flags looking to the downside and being in this zone. Once that's the fact, I will be definitely looking to start aggressively increasing my short exposure. Let's have a look right now at the structure. We need to zoom in for that on 1-hour time frame.
So, we here we have created the first inhale, then a corrective exhale, and right now we are with the highest probability creating the third most impulsive inhale, which is the third wave structure. What do we know about it? It's also a motive wave structure.
So, from here we have created So, basically it's a lot like this, and we are subdividing itself into smaller waves, right? So, one that's a motive wave, 1 2 3 4 5. Perfect. So, we have finished that. That's why I have a number one right here.
So, what do we know about number two? We know that it's a deep correction. It needs to It needs to retrace at least 50% of this wave, all right? Which started at $72,000, finished at $65,000. So, we can put our counting tool right here.
So, around 10% let's decrease it by five. We can see that we have not touched that just yet. I want to see at least 69,000 that is to be hit. We have a strong resistance at 69,600 all right, which is confluence of many important things.
The VPVR then if you take a look at my Fibonacci retracement tool and analyze this this wave, it's actually 0.618 Fibonacci retracement level. As you can see a historic price action very important level. Previously it was working as a support right here, right here as well.
Right now it's going to be acting as a resistance. There is sitting a lot of liquidity ladies and gentlemen, all right. So, I do believe that this level might be hit. It's a high probability right now and if I will be getting a nice confirmations from the structure, you know what's happening, right?
Then we might be moving to the downside. So, definitely I'm waiting for this level to be hit. I'm looking forward to it because it's a high probability level to be hit. There's a lot of liquidity there and I will keep you updated on Thursday how's that progressing.
I'm also waiting for the structure corrective motive wave structure of the secondary wave, which might take one of the structure of these nine waves, all right. So, once that's going to be finished that's going to be another probability. Once we get bearish divergences on multiple indicators, that will be another increment of probability that we might start moving to the downside.
So, I'll keep you updated about that in the next video. Ladies and gentlemen, until then take care. Play with professional trading strategy and I will see you again on Thursday. Cheers. >> I think in probabilities not emotions and I remain calm and disciplined in every market condition.
I follow my trading system with precision and patience waiting only for high probability setups. I respect risk management and protect my capital above all else. Losses are feedback that sharpen my strategy and wins are the result of discipline execution. I detach from outcomes
Educational content, not financial advice. Crypto trading carries substantial risk; you can lose your capital. Past performance does not guarantee future results.














Join the discussion
No comments yet. Members, share how you are reading this.