

In short
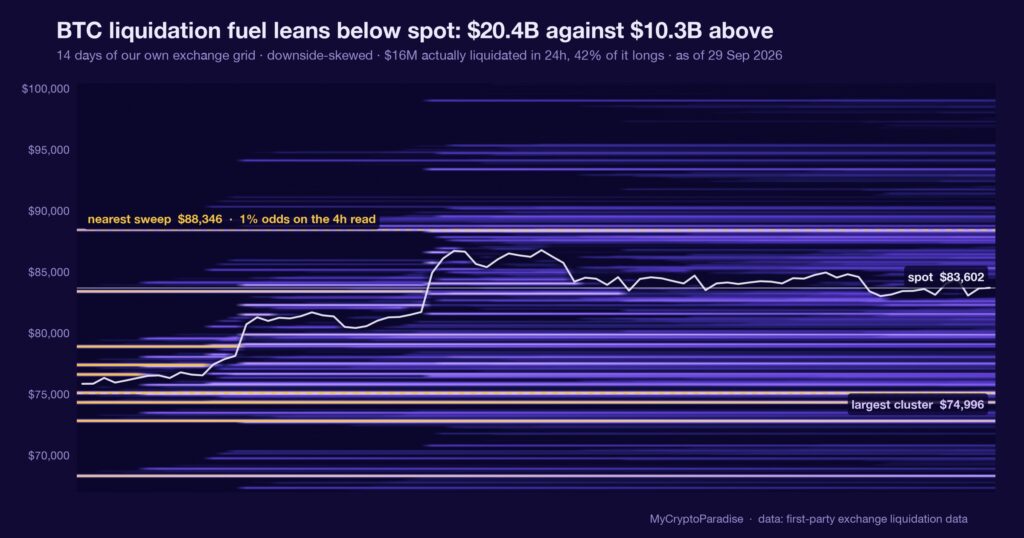
A liquidation heatmap plots where leveraged positions would be force-closed if price reached each level: it maps forced sellers and forced buyers, not the resting limit orders sitting on the book. Our MCP Insights leverage map for 29 September 2026 is a live model estimate, flagged as such, and it has not passed its calibration gate, so we quote it as a recon reading rather than a settled figure. Against it we set our order-flow absorption recon, which measures climax episodes at the 95th percentile over a 180-day window. We called this neutral, explicitly not a trade and not a direction: an estimated map is a lean at best. Base rates for liquidation-pocket regimes are not yet wired, so we claim no historical frequency and invent none. This piece shows you how to read a heatmap yourself, against the resting bids beside it.
Key facts
- BTC spot at the reading
- $83,602
- Estimated BTC liquidation fuel above spot
- $10.31B
- Estimated BTC liquidation fuel below spot
- $20.38B
- Fuel balance
- downside-skewed, -33 points toward the heavier side
- What would prove this read wrong
- A calibrated heatmap that prints a heavy liquidation pocket well below spot while the resting bids beneath it thin out, which would convert today’s no-trade into a defensive lean.
- Reading taken
- 29 September 2026
- Source
- Our MCP Insights tools, from first-party exchange data
Forced liquidity and resting liquidity are different animals
A liquidation heatmap answers one narrow question: if price travelled to a given level, how much leveraged position would be force-closed there. It is a map of coercion, not of intent. Nobody chose to sell at those prices; their margin did.
Resting bids and offers on the order book are the opposite. Those are limit orders that someone placed on purpose, willing to transact if price arrives. One is fuel that ignites when touched; the other is a cushion that may absorb the move.
A gauge that shows where you would be forced out is not the same as a gauge that shows who wants in. Confusing the two is how a heatmap gets misread as a target.
Today’s map is a model estimate, so we read it lightly
Our MCP Insights leverage map for 29 September 2026 carries an estimated flag: it is a recon reading generated by our model, not a figure that has cleared its calibration gate. We treat it accordingly. An estimate is an input, not a verdict.
The firmer anchor beside it is our order-flow absorption recon, which flags climax episodes at the 95th percentile of a rolling 180-day window. That threshold is deliberately high: it fires only when taker flow is genuinely extreme, and today it is not screaming. Both readings agree on restraint.
A number with no error bar is decoration. When the calibrated series is not there, the honest move is to read the mechanism and size the position at zero, not to dress an estimate up as a measurement.
What is different here
The ParadiseTeam does not read a liquidation heatmap in isolation: we set the leverage map against the resting order book and against our absorption recon, then we down-weight any series flagged as an estimate. A single map is a lean; three disagreeing series are a risk size.
The heatmap is not a prediction of where price goes
The commonest misread is to see a thick liquidation pocket and treat it as a destination. Clustered leverage does behave as a magnet once price drifts toward it, because forced closes chain into one another. But the drift has to start first, and the heatmap says nothing about what starts it.
This is where the resting book matters. A heavy liquidation pocket sitting directly above a wall of resting bids is a very different setup from the same pocket floating over thin air. One has a brake; the other does not.
A read that quotes only the leverage map and ignores the resting book is quoting the confirming half of the evidence. The disagreeing half is what sizes your risk.
One indicator, held against the others
Our recent liquidation reads have leaned on where the fuel sits, and lately that fuel has been draining rather than building. That is context, not a conclusion. Today the map is an estimate, so it sits lower in the stack than usual.
This is one input. It sits alongside funding, open interest and spot absorption, and today it is the one carrying the least conviction, precisely because it is unresolved. A fuel map is a probability weight on a bias, not the bias itself. The other layers live in PRO Paradiser.
The highest-probability trade for most readers here is no trade at all. An estimated map plus unwired base rates is not a setup: it is a reason to wait for the calibrated print.
What would make this map worth trading
The read becomes actionable the moment the calibrated print replaces the estimate. Then the size of each pocket carries weight, the imbalance between above and below becomes a real number, and the resting book tells you whether the nearer pocket has a brake in front of it.
Until then, the discipline is to hold the mechanism in mind and the position at zero. A map you cannot yet trust is still worth reading, because reading it now is how you recognise the setup the instant it firms.
Patience is not indecision. Refusing to trade an estimate is itself a decision, and it is the one the data supports today.
Reading a liquidation heatmap yourself, step by step
- Open the leverage liquidation heatmap and check first whether the reading is flagged as a live model estimate or a calibrated print.
- Locate the thickest pockets above and below current price, and note the dollar size of each, not just its colour.
- Overlay the resting order book: mark where limit bids and offers cluster, since those brake or feed a move into a pocket.
- Ask what would have to start the drift toward the nearest pocket, because a magnet does nothing until price is already moving.
- Set your invalidation at the level that would rebuild the opposite pocket, then size the position for a lean, not a certainty.
Most readers skip step one and quote the estimate as though it were measured. The flag is the whole difference between an input and a decoration on your chart.
Every number above is checkable against the live data. Start with the crypto liquidation heatmap, then cross-read the MCP Insights hub and the Crypto Fear and Greed Index.
Act and invalidate
| Scenario | What confirms it | What kills it |
|---|---|---|
| Calibrated map prints heavy below | Downside pocket dwarfs upside and holds | Base pocket rebuilds above spot instead |
| Estimate stays unresolved | Absorption recon keeps flagging restraint | A climax print above the 95th percentile |
| Price drifts toward a magnet | Resting bids thin out beneath it | A wall of resting bids absorbs the move |
Posture: Defensive-to-neutral while the map reads as an estimate: no trade is the base case, and any lean waits for the calibrated print and a look at the resting book beside it.
Frequently asked questions
What does a crypto liquidation heatmap actually show?
It shows where leveraged positions would be force-closed if price reached each level, mapping forced sellers and buyers rather than voluntary orders. It is a picture of where margin breaks, not a forecast of where price is headed next.
Why call today’s reading a model estimate?
Our live leverage map for 29 September 2026 carries an estimated flag, meaning it was generated by our model and has not cleared its calibration gate. We quote it as a recon reading, never as a calibrated probability or a historical rate.
How is a heatmap different from order-book walls?
A heatmap maps forced liquidations, positions closed against the holder’s will when margin fails. Order-book walls are resting limit orders someone placed deliberately. One is fuel that ignites when touched; the other is liquidity that may absorb or reject the move.
Is a thick liquidation pocket a price target?
No. A pocket acts as a magnet only once price already drifts toward it, and the heatmap says nothing about what starts that drift. Treating a cluster as a destination ignores the resting bids that might brake the move entirely.
What is the honest posture on this event?
Neutral, and explicitly not a trade. With the map flagged as an estimate and base rates for these regimes unwired, no historical frequency applies. The base case is patience: wait for the calibrated print and read it against the resting book.
Crypto trading involves substantial risk and is not suitable for everyone. Nothing here is financial advice; it is education only. Never risk more than you can afford to lose.
The private Extras feed, where the leverage liquidation heatmap, the resting order-book walls and the absorption recon update with their invalidation levels, is part of PRO Paradiser, the intelligence layer behind the ParadiseFamilyVIP strategies.














Join the discussion 17
the article leans neutral but seems to miss forced buying from perpetual funding rates i always see that move significant amounts on exchanges especially when they flip hard
I'm always charting resistance to the nearest decimal, but this "forced sellers" angle feels a bit like a debit without a corresponding credit on the books 🤔. What exactly defines "forced" here?
nah, these heatmaps are for forced buying too, not just sellers. 📈 i always check both sides 💰. seems like a weird angle to only focus on one. 🤔
I used to stare at these for hours, trying to find patterns, then realized I was just watching emotions play out instead of the actual book 😅. It's so easy to get caught up.
i'm not sure how you can be neutral on this if it's all about forced selling, that just seems risky to me?! especially with leverage involved. sorry if thats a silly question.
yeah, for sure I've been chopped up before trying to read forced buying on the heatmap 🤦♂️, anyone else just watch it for the vol?
lean neutral" is a cop-out here. What's the specific invalidation for this map at *this* specific moment?! Aisha, forced buying from a heatmap is a stretch if you only check one side.
Mateusz, the specific invalidation is less useful if you don't know the volume behind these liquidation points. These maps show potential, not actual order sizes.
Hmm, I still feel the 'forced sellers' part needs more nuance. Sometimes what looks like forced selling is just a strategic exit by a large player, no? My wife still doesn't get why I watch these screens all day! 😂
so this assumes liquidation maps are only for forced selling eh? where exactly is this written in the protocol. sounds like an incomplete checklist.
That's a dangerous oversimplification, Anna. Focusing only on one side of a forced move is how people get wiped out, not just 'incomplete'!! 🤦♂️ It's crucial to understand both.
Reading these maps carefully, especially the 'forced seller' aspect, could have saved some basis points on my position in May '21. It’s a crucial distinction.
honestly all these maps just remind me of getting rekt on leverage 🤦♂️, the only 'forced' anyone should be is buying spots. 😬 just my two cents 📉
Yeah, still remember when I only looked at green on these maps. Cost me some purchasing power, for sure.. took a while to see the full picture.
the forced selling is one part its also showing where buyers get trapped sometimes and get liquidated too
I’m still learnin how to read these maps... but seems like watchin both sides is key. How often do y’all check for forced buys? 📈👀
Yeah, for sure heatmaps are like a double-edged sword 🗡️. I always check them, but my first year I was just chasing green dots 🟢🟢, thinking it was a cheat code 😂. Liam, I feel you 🤦♂️.